
CHAPTER 11
Surveys and Crowdsourced Data
11.1. INTRODUCTION
Later, in Chapter 12, we will analyze and discuss the use of PMI data. In essence, PMI data is collected from surveys of managers in the industry concerning their economic expectations. Essentially, PMIs can be utilized as a proxy for more traditional macroeconomic datasets, such as GDP, which tend to be released on a heavily lagged basis, as we already discussed in Chapter 1. However, there are many different contexts where survey data can be utilized by investors. In this chapter, we will discuss the use of other types of survey data that can be gathered from sources such as consumers or subject matter experts. We will discuss two case studies to show how they can be utilized to understand consumer products (in this case produced by computer games firms) and also to estimate crude oil production.
Later in this chapter, we will examine alpha capture data. These datasets essentially consist of sell-side broker recommendations. In the final part of this chapter, we will look at survey data for corporate earnings releases and macroeconomic data releases. We will show how crowdsourcing can be used to compile these datasets.
11.2. SURVEY DATA AS ALTERNATIVE DATA
Data obtained by surveying people who have a view on a company (or any other entity of interest) or an asset (physical or financial) may turn out to be very insightful. This is particularly the case when information is not obtainable in other ways, or is obtainable with a delay or at prohibitively high price (e.g. on-site visits and travel, satellite images, credit card transactions acquisition). This information can be used to monitor a current position, evaluate a trade that will be performed, extract trading signals, or assess a risk situation.
In this context, the “people” surveyed are not “insiders.” The survey would instead involve respondents whose background allows them to express an informed opinion with regard to, for example, the current and/or potential future performance of a company and/or the industry it operates in and the broad market context. These relevant “people” to include in a survey can also mean scouts and researchers. They can collect visual or other types of information about company assets such as the condition of buildings and facilities, quality of its products, foot-traffic, and so on. A deep domain expertise in this latter case is not needed.
In general, a survey leverages not one person but a multitude of people. Their opinions can be averaged to provide a wisdom-of-the-crowds view. Hence in principle this is likely to provide better information than the view of single person. Figure 11.1 shows a hierarchy of potential contributors to a survey. From people on the ground (scouts) it can be narrowed up to managers and senior company executives.
Current technology allows identifying, contacting, and onboarding contributors through mobile applications. Features like geolocation, image uploading functionality, and rating of contributors allow us to control the veracity of this type of data source. A sample of contributors can be set up quite quickly, usually in a few days or even hours, and the results of a survey can be available shortly after that. The universe of potential contributors – defined by those individuals who have access to a mobile device – is estimated to be around 3bn people. The coverage is global, including remote areas not accessible or monitored by other means.
A survey can be conducted in anticipation of an event such as product launch, earnings report (we'll talk about crowdsourcing earnings forecasts later in this chapter), or election results. It can be also conducted as a confirmation of already public information or any private beliefs. They may not always be linked to any specific event. Instead they can be conducted to understand trends better, such as the switch to generic (and cheaper) medicines of a population, intention of a population to opt for an electric vehicle for the next purchase, and so on. All this information can be of invaluable help to investors and asset and risk managers.
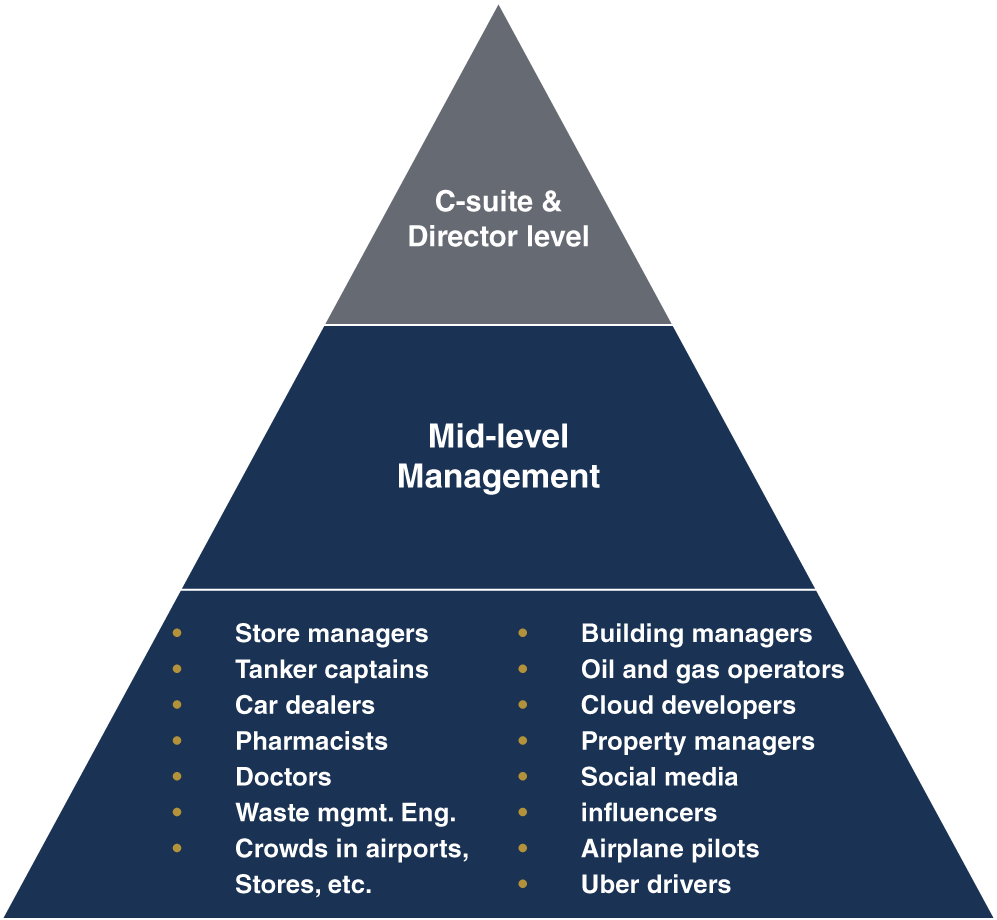
FIGURE 11.1 Hierarchy of contributors.
Source: Based on data from Grapedata.
11.3. THE DATA
In the first case study we will be using data from Grapedata. The company provides an alternative data-sourcing platform through which one can instantly connect with any individual or group of individuals globally and perform on-demand surveys. This offers an opportunity to unlock offline information that can be important in financial decision making and due diligence. This information may not be available from other sources. It makes use of an online mobile phone platform on which more than 70,000 contributors are currently onboarded. The platform provides compliance oversight, aggregation, and anonymization.
Key tasks include targeted survey data on precise demographic cohorts and seeking out specific individuals who would be inaccessible via traditional routes. Once connected, dialogue channels allow ongoing information sharing in real time. It is synced to the mobile device of a client who can enter queries at any time, 24/7, via an encrypted application.
To get a sense of a typical timeline of a survey conducted by Grapedata, an example is shown in Figure 11.2.
The process followed by Grapedata in a survey is illustrated in Figure 11.3. After a client query, Grapedata checks that contributors are screened for geolocation. They are also passed through a background check, which is intended to increase the veracity of the dataset that will later be delivered to clients. After the answers stage, respondents are rated. The rating is based on the quality and the promptness of the answers. Low-rating respondents' answers are not incorporated in the final dataset and those respondents are no longer employed for future surveys.
11.4. THE PRODUCT
Grapedata provides geolocated surveys in a fully digital way through its online platform. It engages with respondents in three ways:
- Pooled surveys
- Q&A surveys
- Reports
Scouts are employed in pooled surveys to collect information where deep domain expertise is not needed. For example, these can be shopping mall customers who can be asked to express an opinion on the changes in traffic. In order to get better insights, this information can sometimes be augmented or cross-checked with foot-traffic data providers who use other means to collect information. In other cases, pooled survey data can be the only way to get certain information. For example, an investor might want to detect the foot-traffic changes in a chain of pharmacies and/or the changes of their sales, but these stores are out of the reach of satellites or out of the focus of mobile phone tracking companies. The questions asked in pooled surveys are specific, but deep expertise and detailed answers are not required. For example, questions could be something like “How has the total sales changed in the last six months?” with a simple set of answers “Up/Neutral/Down,” “Has the number of customers declined?” with answers “Yes/No,” and so on.
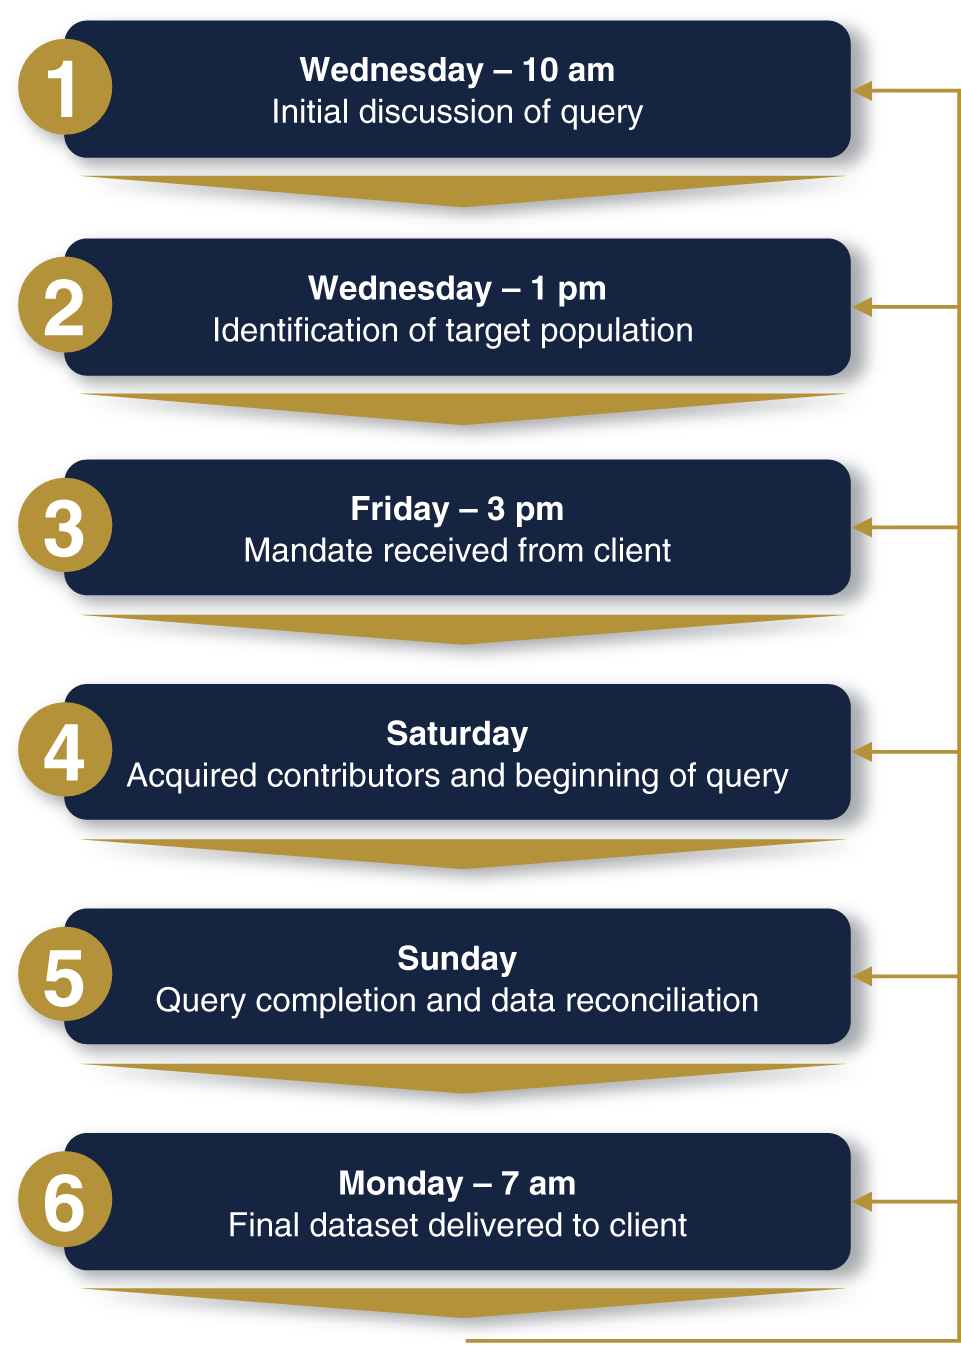
FIGURE 11.2 Typical timeline of a survey.
Source: Based on data from Grapedata.
Q&A surveys are generally based on a smaller sample of respondents with a specific domain knowledge. The elicited responses can be much more detailed and elaborated. Q&A surveys are required by clients who want a more detailed background and justification to the answers provided by the respondents. The answers are for very specific questions, such as “What is the daily oil production in a region?” These require deeper expertise and domain knowledge than in the pooled survey.
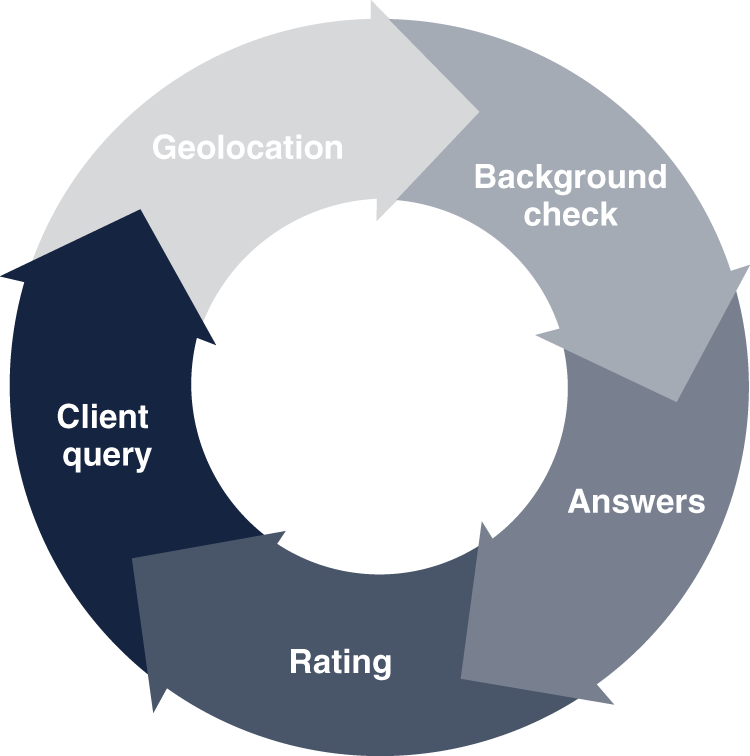
FIGURE 11.3 The process followed in a survey.
Source: Based on data from Grapedata.
Apart from pooled surveys and detailed Q&A sessions, if required by a client, respondents can be asked to compile detailed reports on specific queries like company performance and evaluation.
In contrast to pooled surveys, respondents to Q&A surveys and reports are onboarded after undergoing automated background checks through “World Check-One.” They are given preliminary assignments to test their knowledge. In this case, data is screened by Grapedata and Optima Partners (for compliance sensitive cases) before it is shared with a client.
11.5. CASE STUDIES
11.5.1. Case Study: Company Event Study (Pooled Survey)
Grapedata conducted a pooled survey on January 31, 2019, on the market attitude toward the imminent release of a new game (JX Mobile III) in Q2 2019 by Kingsoft, a Chinese software company based in Beijing.
The survey was commissioned by an asset manager with a long position in Kingsoft. They wanted to check whether the attitude of the gaming community to the new release was positive. They also wanted to know how much customers would be willing to spend on it. This survey would have helped the asset manager to estimate several metrics, including the future earnings of Kingsoft and hence the impact on its share price. This information would be used to assess whether they should maintain a long position in the stock. Grapedata kindly provided us with this survey data.
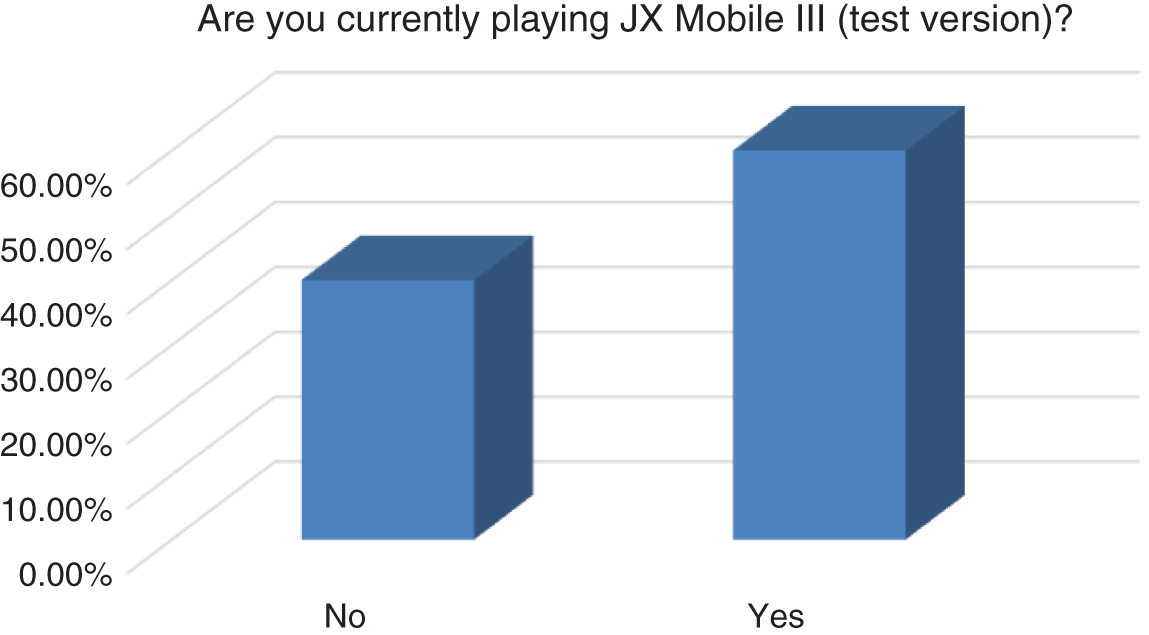
FIGURE 11.4 Are you currently playing JX Mobile III (test version)?
Source: Based on data from Grapedata.
Kingsoft operates four subsidiaries: Seasun for video game development, Cheetah Mobile for mobile internet apps, Kingsoft Clouds for cloud storage platforms, and WPS for office software, including WPS Office. All these business lines determine the earnings of Kingsoft. The launch of JX Mobile III is a major event for Kingsoft because the JX game line is a substantial source of revenue for it. Scheduled for release in late Q4 2019, JX Mobile II was expected to have limited overall contribution to 2019 results, so it was not included in the survey.
Grapedata devised a survey on a carefully selected subset of the gaming population in China. Latest estimates report 3.3 million online JX I and JX III players playing at any given time.1 The total sample of the conducted survey was 700 respondents. Of these, 350 players funneled down to either JX PC III or JX Mobile I players, or players of both. These are the people likely to play JX Mobile III. Respondents who were not already registered on Grapedata's platform were acquired online on diverse gaming platforms, blogs, and social media. The questions of the survey appear in Appendix 11.10.
The distribution of the answers to three of the questions is plotted in Figures 11.4, 11.5, and 11.6.
The results of the survey helped the asset manager raise the Kingsoft 2019 earnings estimate by 14% on higher gaming revenue estimates. Upside risks to this estimate included earlier-than-expected launch of JX Mobile II and JX Mobile III. Downside risks included: (1) weaker-than-expected performance of JX Online III, and (2) stronger competition in the office application and public cloud market – another significant revenue source for Kingsoft. The downside risk (1) above was considered low by the asset manager thanks to the insights from the Grapedata survey.
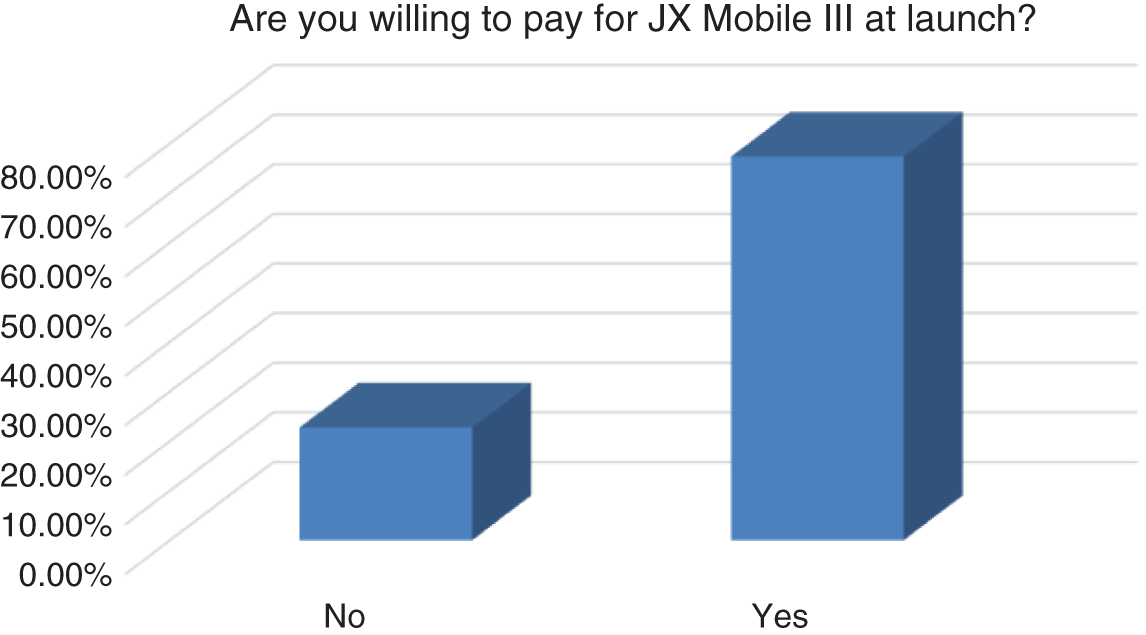
FIGURE 11.5 Are you willing to pay for JX Mobile III at launch?
Source: Based on data from Grapedata.
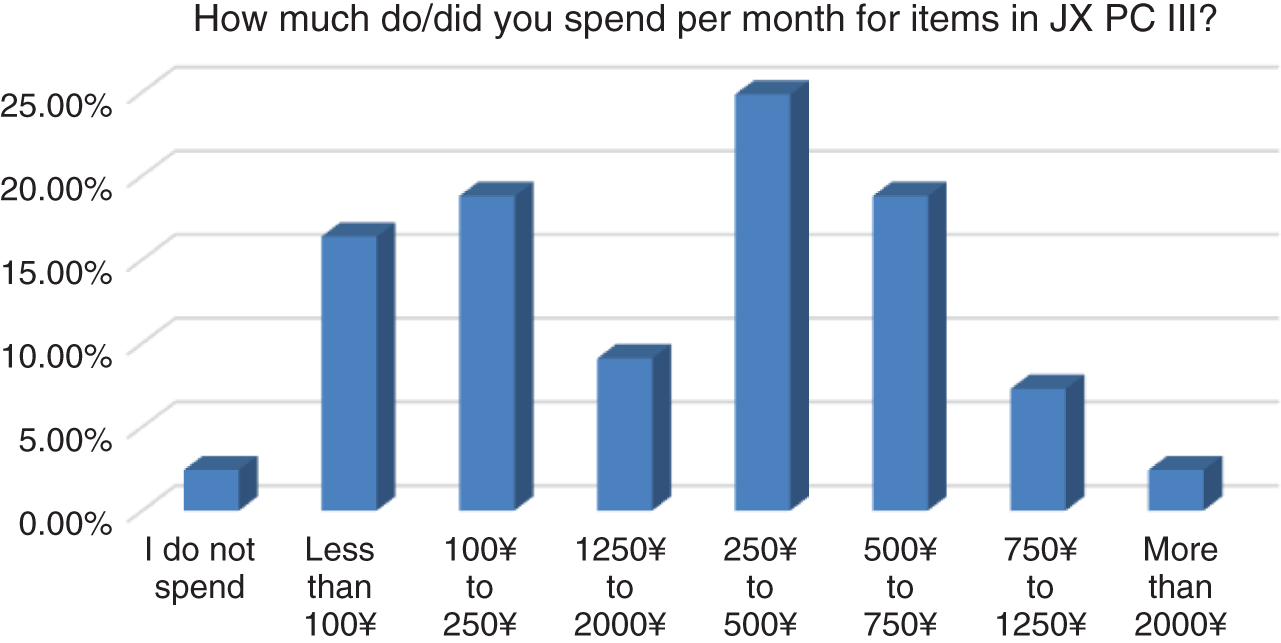
FIGURE 11.6 How much do/did you spend per month for items in JX PC III?
Source: Based on data from Grapedata.
The performance of the Kingsoft share price after the survey (conducted around January 3, 2019) and the performance of the market (Hang Seng index) is plotted in Figure 11.7.
Since the survey was performed, the share price of Kingsoft appreciated around 100%, compared to the market increase of around 20%. An investor would thus have been able to lock into a profit with the aid of some reassurance about the prospects of JX Mobile III from the gaming community before the other market participants. The obvious caveat to this analysis is that this is a single stock over a relatively short time period.
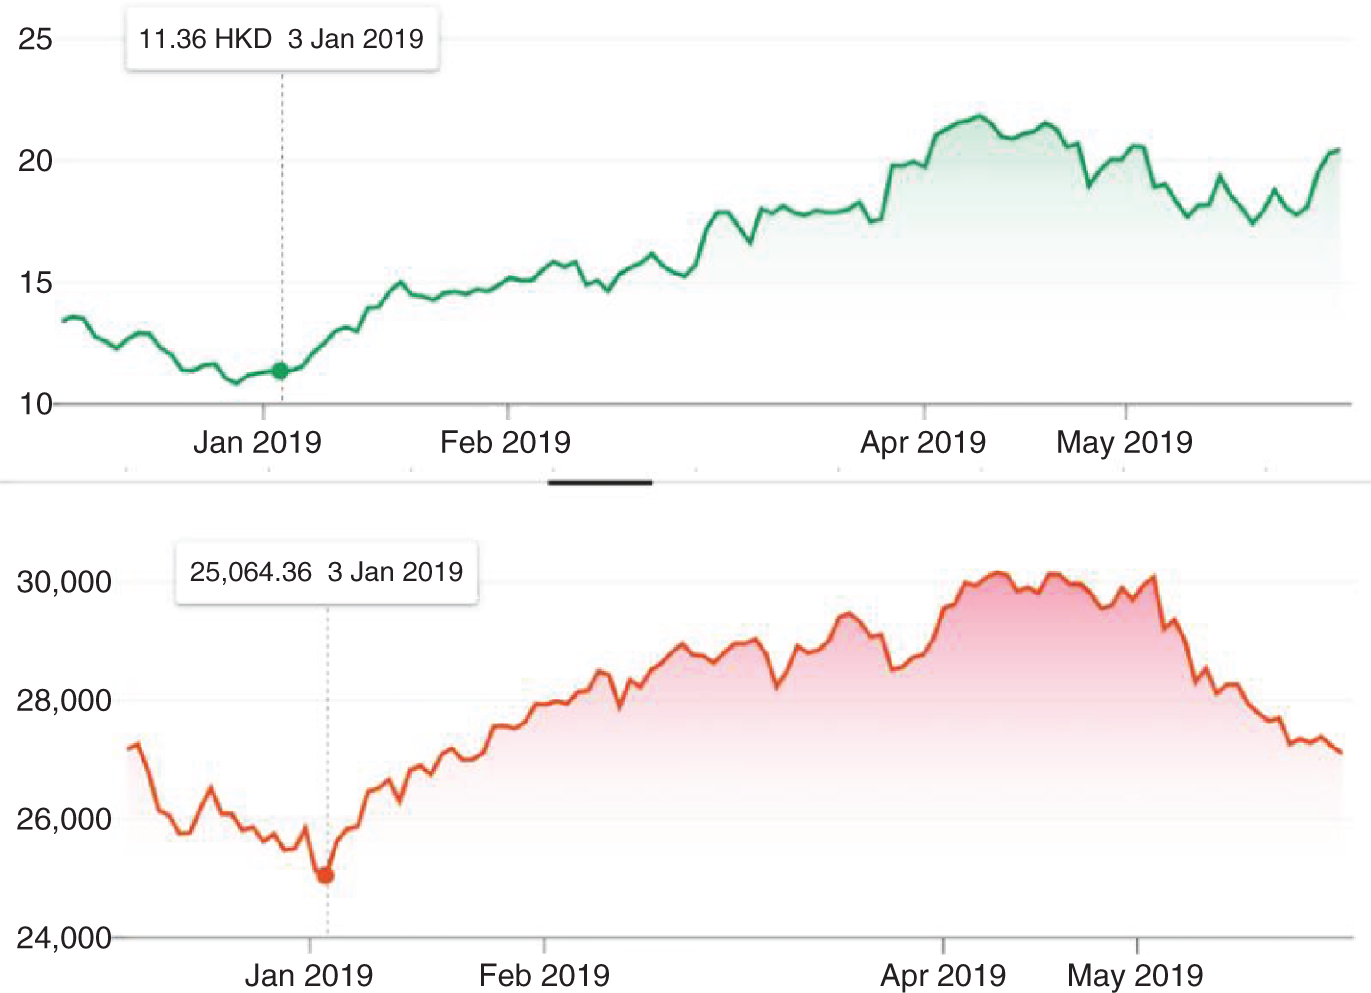
FIGURE 11.7 Performance of the share price of Kingsoft (top) and the Hang Seng index (bottom) after the survey (3/1/2019).
Source: Adapted from Grapedata.
11.5.2. Case Study: Oil and Gas Production (Q&A Survey)
In this case study we will show the use of Q&A survey data to estimate the production of crude oil, natural gas liquids (NGL), and condensates from the OPEC countries before this information is made available by other data providers. The survey was conducted for a commodity trader who is actively involved in the trading of oil products and futures. Grapedata kindly provided us with this survey data.
The OPEC oil supply is one of the driving factors of oil prices. In fact, the OPEC countries provide around 40% of world global oil and OPEC's oil exports represent about 60% of the total petroleum traded internationally. Hence, it is a well-known fact that OPEC's actions around increasing/decreasing oil production targets have influence on oil prices. In particular, indications of changes in crude oil production from Saudi Arabia, OPEC's largest producer, frequently affect oil prices. Other factors that have an influence are the non-OPEC countries' production and the demand for oil. All these are components of a typical commodity trader's balance model.
OPEC countries publish official production figures on the 15th of each month for the previous three months. There is belief among traders that the figures can be understated or overstated for some countries, because governments either consider them to be confidential and do not publish the data, or publish numbers that do seem untrustworthy. Hence, the OPEC Secretariat publishes production data on the basis of estimates produced by “secondary sources.”2
An expert survey can invariably provide insights in this context both as a sanity check for other data sources or as a timely primary source of information. For this purpose, Grapedata has set up a network of respondents (∼200) in the OPEC countries with oil and gas industry knowledge in charge of providing their estimates 15 days before the official date of publication of OPEC. Figure 11.8 shows a plot of the production numbers estimated through the Grapedata methodology. Alongside this are estimates by OPEC, S&P Platts, Wood Mackenzie, and the International Energy Agency (IEA).
The estimates are close. However, there are some differences even between the numbers of well-established data providers, especially in the last months of the sample. The discrepancies in the last few months are due to the situation in Iran, whose exports have become more opaque since the US sanctions on the country's oil sector took effect in November 2018. While most industry experts agreed they had dropped steeply, views on the amounts differed by as much as several hundred thousand barrels per day. Grapedata predicted a drop of lower magnitude than other providers, which positively affected its global supply estimates, as visible in Figure 11.8. Later, in line with Grapedata's estimates, industry experts confirmed that the drop was not indeed as steep as estimated by many data providers.3
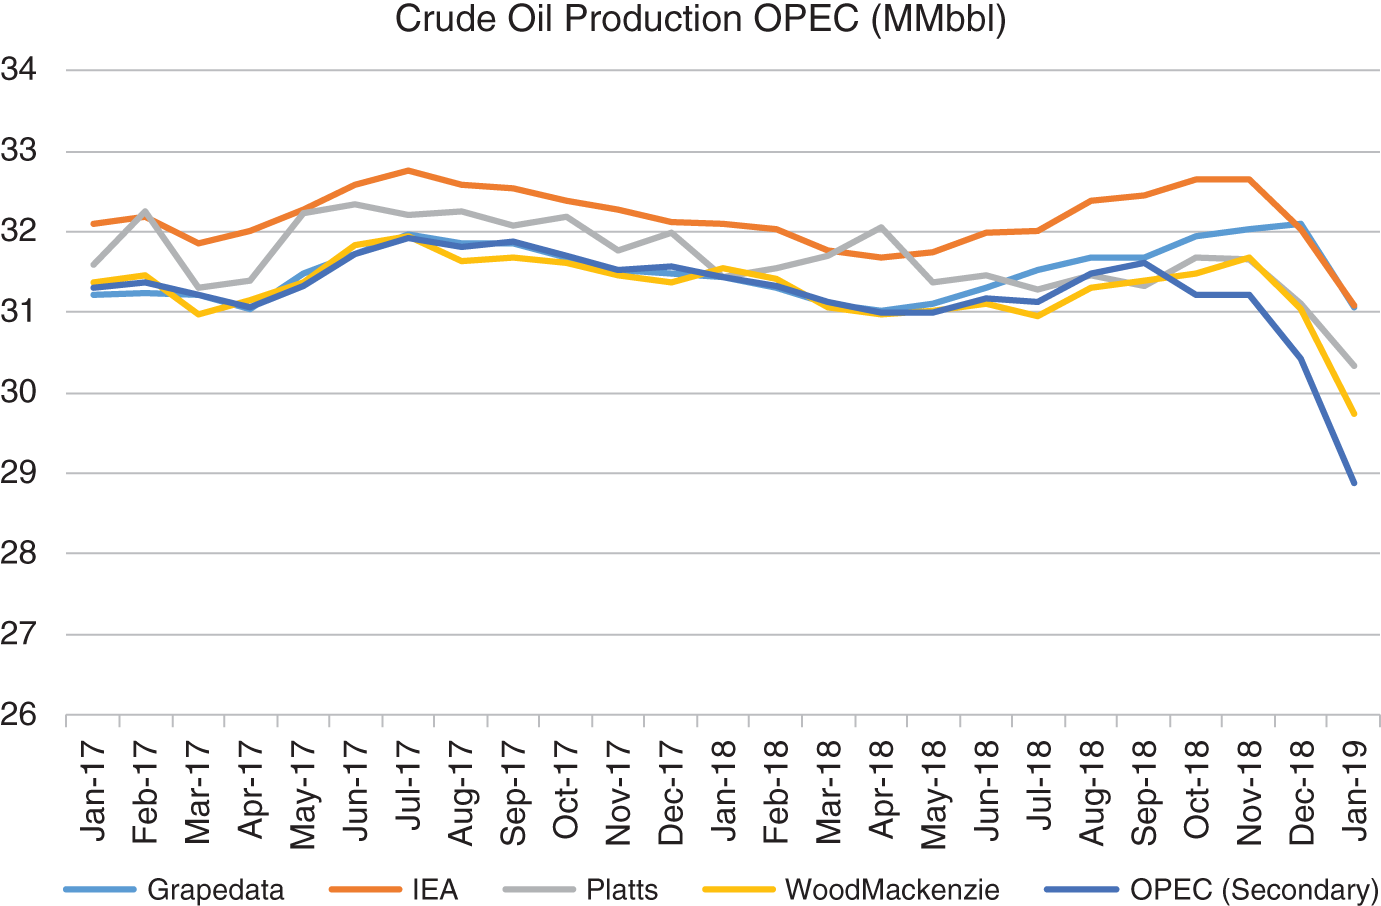
FIGURE 11.8 Crude oil production by OPEC as estimated by several data providers.
Source: Based on data from Grapedata.
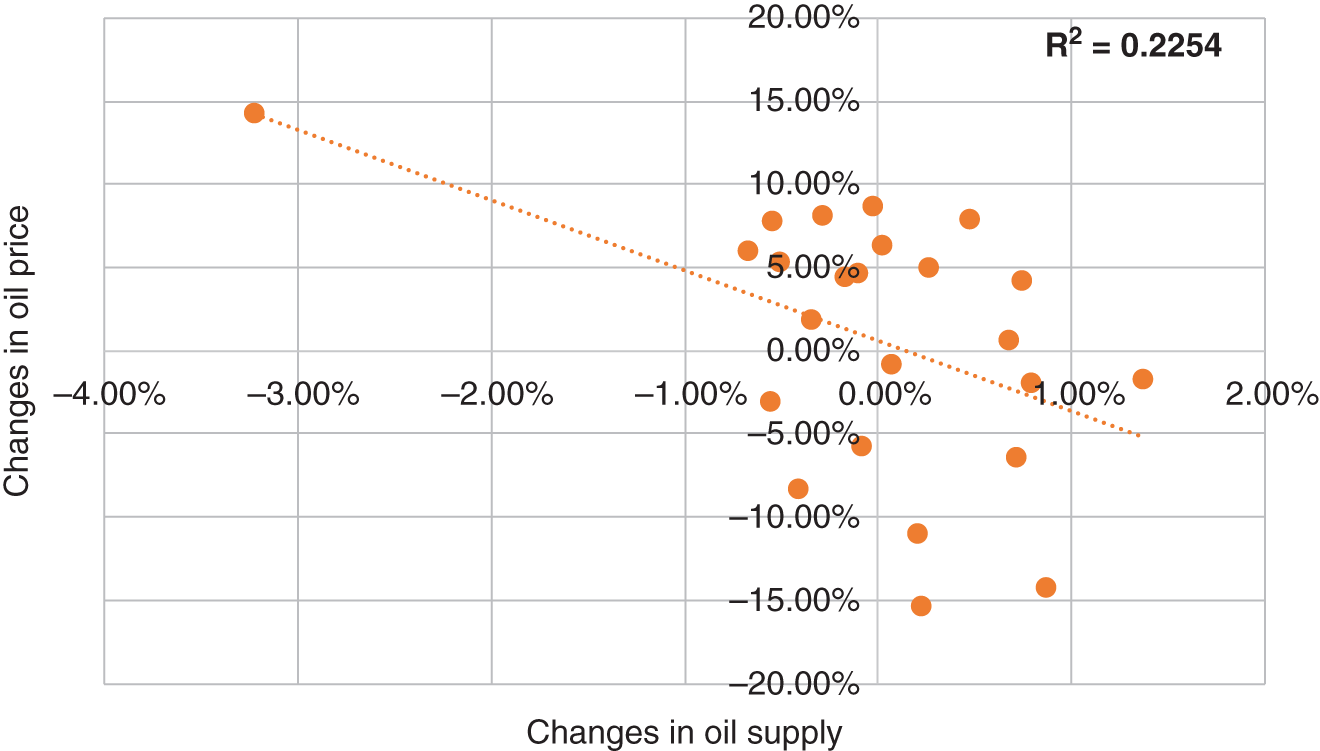
FIGURE 11.9 Monthly changes in oil prices versus changes in OPEC oil supply January 2017–January 2019.
Source: Based on data from Grapedata.
Figure 11.9 is a plot of the correlation between oil price monthly changes and the monthly changes in supply based on Grapedata data. The relationship has the expected sign – negative changes in supply results and positive changes in the oil price. The ![]() is ∼22%, but as mentioned oil supply is only one of the determinants of the oil price. A fully fledged balance model similar to one used by commodity traders must include demand as well. Surveys like the Grapedata's can be a reliable input to such balance models.
is ∼22%, but as mentioned oil supply is only one of the determinants of the oil price. A fully fledged balance model similar to one used by commodity traders must include demand as well. Surveys like the Grapedata's can be a reliable input to such balance models.
11.6. SOME TECHNICAL CONSIDERATIONS ON SURVEYS
Two important decisions must be made before starting a survey. The first one is how to select the sample in terms of size, coverage, and penetration to make it representative for the entire population – if this is required. This could be the case for political surveys or any other surveys where proportions that reflect the general population must be estimated. Of course, this is because the entire population cannot be covered due to costs and time constraints, and hence one has to settle for a smaller set of respondents. If the chosen sample is indeed representative (as Grapedata makes sure through well-established methods), then, by using statistical formulae, one can calculate the margin of error given the sample size. Hence, the client must select the sample size according to the error tolerance they are willing to accept. We note that representativeness might not be required if, for example, scouts are needed to assess the condition of a factory, or any other asset.
A second important decision is how to choose the optimal timing of conducting the survey. One usually wants to do it before an event, if the objective is to estimate the impact of that event (a new product release, earnings report, etc.). But how much in advance must be carefully pondered.4 Too close to the event could be late because information about it might already be priced by the market. Too soon and other events, including systematic ones, could influence the share price to the extent of complete dilution of the information we gathered beforehand through the survey.
11.7. CROWDSOURCING ANALYST ESTIMATES SURVEY
Historically, the way to understand market consensus for specific events, such as earnings releases, has consisted of looking at consensus surveys made by data companies such as Bloomberg or Refinitv. This can cover macro data releases. It can also cover forecasts for traded assets like equities, FX, and fixed income. We have already seen an example earlier of similar surveys of experts for estimating crude oil production by Grapedata. Usually, the “crowd” has been subject matter experts at sell-side investment firms. As noted, these forecasts are compiled by data firms such as Bloomberg and Refinitiv. They are often used as a proxy for the crowd. Refinitiv's I/B/E/S dataset goes back to 1976 (Refinitiv, n.d.) and covers key performance indicators, including estimates of earning expectations, covering 22,000 firms.
Hence, traditionally analyst estimates of metrics like earnings forecasts tend to be over a “crowd” of sell-side contributors. What if we increase that crowd considerably to include many more participants from more diverse backgrounds, not just those analysts working on the sell side? Newer data firms such as Estimize crowdsource these estimates from a wider pool of market participants. Estimize is a platform that sources estimates from a diverse array of individuals for hedge funds, brokers, and independent and amateur analysts. They primarily cover earnings estimates for US stocks and certain macroeconomic data releases, as well as key performance indicators like subscriber numbers for Netflix. Jame et al. (2016) find that Estimize crowdsourced earnings forecasts provide additional information content to I/B/E/S estimates, which is the traditional source of consensus estimates. They note that the value of the crowdsourcing is a function of the crowd size. Drogen and Jha (2013) show how post-earnings drift is more pronounced for earnings surprises that are benchmarked against Estimize's data compared to the traditional Wall Street consensus. They also create a trading strategy that uses this observation, which accrues abnormal returns especially for large-cap stocks. Banker, Khavis, and Park (2018) suggest that the advent of crowdsourced estimates from Estimize has also changed the behavior of analysts contributing to I/B/E/S surveys resulting in earlier and more frequent forecasts. They also tend to issue more forecasts.
11.8. ALPHA CAPTURE DATA
As well as publishing longer-term forecasts for clients for asset prices and for specific events, such as earnings releases, sell-side brokers regularly generate trade recommendations in reports sent to their clients. One way for clients to keep up to date is to read every research report. Given the volume of research reports received by clients, this is likely to be very time consuming. It can be challenging for clients to aggregate these trade recommendations quickly and efficiently. Automating the process is challenging, given that there is not a standard format for research reports. An alpha capture system is a type of software that enables banks to submit trade recommendations in a standard format that are then communicated to the client. This approach was first devised by the hedge fund Marshall Wace (Greene, 2008). These trade recommendations can be aggregated and consumed by buy-side firms to help in their decision-making process. It can also be easier to track the value of these trade recommendations by specific contributors and firms. While alpha capture originally started as a way to standardize equity trade recommendations into a more structured form that is easier to ingest, these datasets are now being used by hedge funds to trade in other asset classes. Today there are a number of proprietary alpha capture platforms developed by individual hedge funds and also platforms from vendors like TIM Group and Bloomberg.
11.9. SUMMARY
We discussed some forms of surveys and crowdsourced datasets in this chapter. We began by making the point that survey data can be seen as an alternative data source. We described survey datasets from the firm Grapedata that are sourced from consumers and subject matter experts through a mobile phone platform. We gave specific examples of how they could be used, starting from an example for a consumer survey in the gaming industry. A second example showed how subject matter experts could be surveyed to help estimate metrics for crude oil production in parallel to OPEC estimates. In the two examples, the survey data provided insights that would not be easily and quickly obtainable by other means.
We talked about crowdsourcing consensus analyst estimates. We showed how crowdsourced estimates from a wider pool of contributed ones compared to the traditional Wall Street consensus. We also discussed alpha capture datasets, which can be seen as standardized and more structured versions of sell-side broker recommendations – something that is gaining momentum in the financial industry. In Chapter 12, we will go into some detail about PMI data, which is also derived from surveys.
11.10. APPENDIX
Questions asked in the Kingsoft survey are as follows:
- Are you male/female?
- What is your age?
- Do you play MMORPG (massively multiplayer online role-playing games)?
- Are you currently/were you a JX3 PC player?
- How much time do/did you spend on JX3PC a day?
- How much do/did you spend per month for items in JX3 PC?
- Are you currently/were you a JX1 mobile player?
- How much time do/did you spend per day on JX1 mobile?
- How much do/did you spend per month for items in JX1 mobile?
- Are you currently playing JXIII mobile (test version)?
- How much time do you spend per day on JX3III mobile (test version)?
- Are you willing to pay for JX III mobile at launch?
- If you won't play JXIII Mobile, which game do you think you will play?
- Please comment on JXIII Mobile.
NOTES
- 1 M. Lu, October 5, 2016, US Video and Computer Game Industry Overview Report, UBC.
- 2 These include S&P Global Platts, Argus Media, Energy Intelligence Group, IHS Markit, the Energy Information Agency (EIA), and the International Energy Agency (IEA).
- 3 https://www.reuters.com/article/us-iran-oil-exports/despite-sanctions-irans-oil-exports-rise-in-early-2019-sources-idUSKCN1Q818X.
- 4 These are decisions that also apply to more “traditional” surveys that have been around for many years in politics and marketing.