3
Stored Grain Pest Identification Using an Unmanned Aerial Vehicle (UAV)-Assisted Pest Detection Model
Kalyan Kumar Jena1,2,3*, Sasmita Mishra2, Sarojananda Mishra2 and Sourav Kumar Bhoi3
1 Utkal University, Bhubaneswar, India
2 Department of Computer Science Engineering and Applications, Indira Gandhi Institute of Technology, Sarang, India
3 Department of Computer Science and Engineering, Parala Maharaja Engineering College, Berhampur, India
Abstract
Detecting pests in stored grain (SG) accurately is a major issue in the current scenario. It is very much essential to monitor the SG in order to take preventive measures to cease the further growth of pests in the SG. This can be done by capturing the images of SG with the help of UAVs, high-definition drones, cameras, sensors, and so on. Many methods have been introduced to detect the pests in the SG. However, no method is fully efficient in each and every situation. In this chapter, a UAV-assisted pest detection model is proposed in order to track the pests in the SG. This proposed model consists of four phases, such as data acquisition, edge detection (ED), feature extraction, and pest identification. In this model, we have only focused on the ED part by analyzing the data (pest in the SG images). Many standard ED (SED) methods, such as Sobel, Prewitt, Roberts, Morphological, Laplacian of Gaussian (LoG), Canny, are used to track the shape, location, and quantity of pests in SG. The implementation of the methods are performed using MATLAB R2015b and evaluated using signal to noise ratio (SNR), peak SNR (PSNR), and processing time (PT).
Keywords: SG, pests, UAV, SED, SNR, PSNR, PT
3.1 Introduction
Grain plays an important role for the survival of human society. It is considered as one of the important basic needs of human society. Human without grain is like bike without fuel. Stored grain (SG) is a major concern in the today’s era. Several reasons are there for the loss of SG. The loss of SG due to pests is one of them. Loss of SG leads to food crisis in a global scale. Everyone has to be alert about this issue, otherwise it leads to a very serious problem to the human society globally. About 5% to 10% and 20% loss of SG by pests are caused in developed countries and developing counties, respectively [1]. So, it is essential to track the shape, location, and quantity of pests in the SG in order to take preventive measures for their growth. The SG pests can be broadly classified as primary SG pests and secondary SG pests [80, 81]. Several primary SG pests are lesser grain borer (LGB), rice weevil (RW), granary weevil (GW), angoumois grain moth (AGM), and so on, and several secondary SG pests are rust red flour beetle (RRFB), confused flour beetle (CFB), saw toothed grain beetle (STGB), flat grain beetle (FGB), warehouse moth (WM), Indian meal moth (IMM), and so on. Pest classification is shown in Figure 3.1.
In this work, a UAV [38, 39]-assisted pest detection model is proposed to monitor the SG pests by capturing the images of SG periodically. If any pest is found in the SG, these images will be sent to the information center (IC) and then these images will be collected from the IC for processing and analysis. The captured images will be processed by the help of standard edge detection (SED) methods, such as Sobel [40–43], Prewitt [44–46], Roberts [47–49], Morphological [54], LoG [50–53], Canny [55–58], and several other image processing approaches [59–79] to track the shape, location, and quantity of pests in the SG [1–37]. The outputs of SED methods are compared and evaluated using signal to noise ratio (SNR), peak SNR (PSNR), and processing time (PT).
The main contributions in this chapter are stated as follows:
- A UAV-assisted pest detection model is proposed to track the shape, location, and quantity of pests in the SG to take preventive measures for the further growth of the pests in the SG.
- The SG images will be captured by the UAVs and transferred to the IC. The captured images will be collected from the IC and then processed by using SED methods, such as Sobel, Prewitt, Roberts, Morphological, LoG, Canny, and other for pest detection.
- MATLAB R2015b is used for the implementation of SED methods, and SNR, PSNR, and PT are taken as performance metrics.
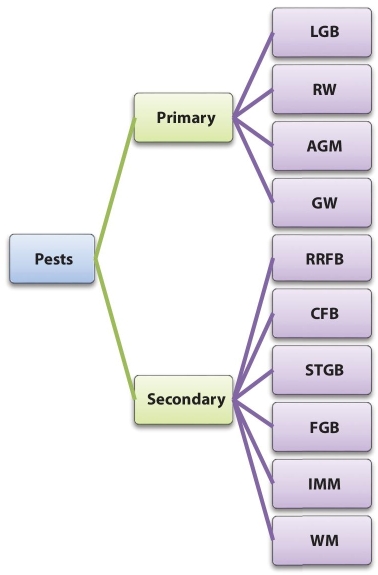
Figure 3.1 Pest classification over SG.
The rest of the chapter is organized as follows: Sections II, III, IV, and V describe the related works, proposed model, results and discussion, and conclusion of the work, respectively.
3.2 Related Work
Several works have proposed by several researchers to identify the pests in the SG [1–37]. In this section, some of the works were discussed. Qin et al. [1] focuses on spectral residual (SR) saliency ED mechanism to detect the pests in SG. It mainly focuses on the image logarithmic spectrum as part of the information of the image. The rest of the spectrum is changed to airspace for obtaining the results (ED). It is based on the processing in frequency domain. Shen et al. [2] proposed a deep neural network-based technique to identify and detect the insects in SG. In this work, faster R-CNN is used to focus the regions of insects in the images as well as to classify the insects in the regions. An advanced inception network can be developed for feature map extraction. Solà et al. [3] proposed a multiplex PCR method to identify and detect the pests, such as Sitotroga cerealella, S. oryzae, Sitophilus granarius, Rhyzopertha dominica, and S. zeamais, which are hidden in grain kernels. This method may be used for decision making (commercial) to satisfy the demands in the current market scenario.
Kaushik and Singhai [4] proposed an integrated and environment monitoring-sensing system for the detection of contamination and insect infestation in SG. This method may monitor the quality of grain. The sensor data may help in the prediction of essential information and provide alerts for taking preventive actions. Liu et al. [6] proposed a deep learning-based pestnet method to detect and classify multiclass pests. The pestnet method focuses on CSA, Convolutional Neural Network (CNN), Region Proposal Network (RPN), Position-Sensitive Score Map (PSSM), Fully Connected (FC), as well as contextual Region of Interest (RoI) mechanisms. The pestnet method can be evaluated by using MPD2018 data set as well as newly referred pest image data set. Priyadarsini et al. [7] focuses on a device (smart) to explore the negative effects on the pest bugs in case of land (harvesting), as well as in the water body PH level. It is mainly focused on the identification of the PH value and the control of pest for better agriculture. In order to repel several types of insects, different ultrasonic waves are produced.
3.3 Proposed Model
The proposed model is mentioned in Figure 3.2. This model is focused on UAV-assisted pest detection model for the detection of pests over the SG. It is very essential to track each and every pest in the SG in order to take preventive measures for further loss of SG. The UAVs or high-definition drones can be used to monitor the SG at regular intervals. The UAVs will capture the SG images at regular intervals and send these images to the IC. The captured images can be taken from the IC for analysis periodically. If any pest is detected, then the captured images will be processed immediately in order to track the position, shape, and quantity of pests. It can be done by using four phases discussed as follows.
- Data Acquisition: According to the proposed model presented in Figure 3.2, the data (SG image) is collected periodically using the help of UAVs. The UAVs periodically take images of SG for pest detection. The data are transferred by the UAV to the IC using the Internet connection from the UAV to the IC.
- Edge detection: After collecting the image the IC process the images for detecting the pests over the SG. It uses the SED method to find the edges in the SG image. This is performed to identify the object (pest) in the SG images. Algorithm 1 presents the ED of collected SG image.
- Feature Extraction: Then the feature of the image is extracted by using a classifier which takes the input (many images transferred by the UAV) and uses a learning algorithm to detect the pest over the SG. The features are then compared to detect many types of pests over the SG.
- Pest Identification: After comparing the features, the pests are identified. Then, the pest information is sent to the SG center using the Internet connection for taking preventive measures for the safety of SG.
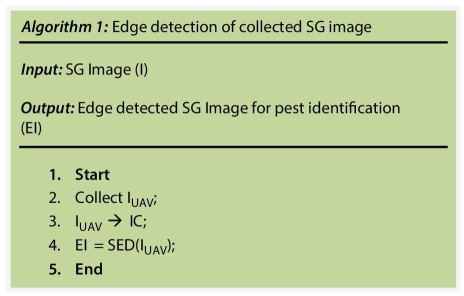
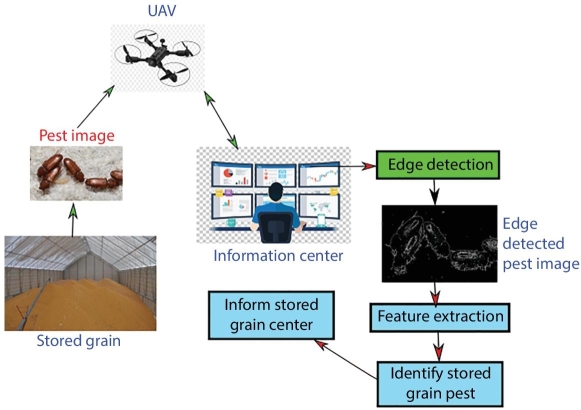
Figure 3.2 Proposed UAV-assisted pest detection model for SG.
3.4 Results and Discussion
In this work, several SG pest images with different sizes, such as RW, LGB, RRFB, CFB, GW, are taken from source images [80, 81] which are mentioned in Figures 3.3 to 3.7. MATLAB R2015b is used for the processing of SG pest images. The SG pest images are processed using several SED methods, such as Sobel, Prewitt, Roberts, Morphological, LoG, Canny methods and evaluated using SNR, PSNR, and PT. The quality of the output image increases if the PSNR or SNR value increases. The method performs faster if it deals with lesser PT.
From the analysis of Figures 3.3 to 3.10 and Tables 3.1 to 3.3, it is concluded that the morphological method detects the pests in a better way as compared with other methods, and it processes the images with less PT. However, the PSNR and SNR values of Canny method is higher as compared with others. From the analysis of RW image as mentioned in Figure 3.3, morphological method detects the RW from image in a better way, and its PT is 0.01 unit. However, Sobel, Prewitt, and Roberts method try to detect the RW. However, the results of these methods are not so good as compared with the morphological method. The LoG and Canny methods are not able to identify the RW. From the analysis of LGB and RRFB images, as mentioned in Figures 3.4 and 3.5, respectively, morphological method detects the LGB and RRFB pests from images in a better way as compared with other methods, and its PT are 0.03 and 0.01 units, respectively. However, Sobel, Prewitt, and Roberts methods try to detect the LGB and RRFB pests, and LoG and Canny methods also try to detect the LGB and RRFB from the images. However, the results of LoG and Canny methods are not so good as compared with Sobel, Prewitt, and Roberts methods.
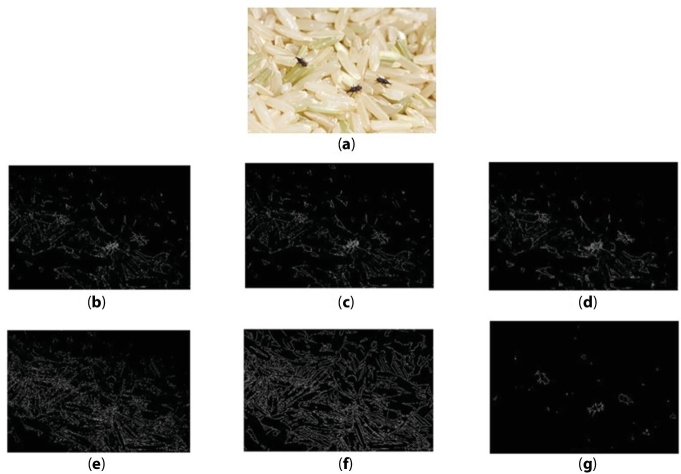
Figure 3.3 Processing of RW (1280 × 853). (a) Original image and results using (b) Sobel, (c) Prewitt, (d) Roberts, (e) LoG, (f) Canny, and (g) morphological methods.
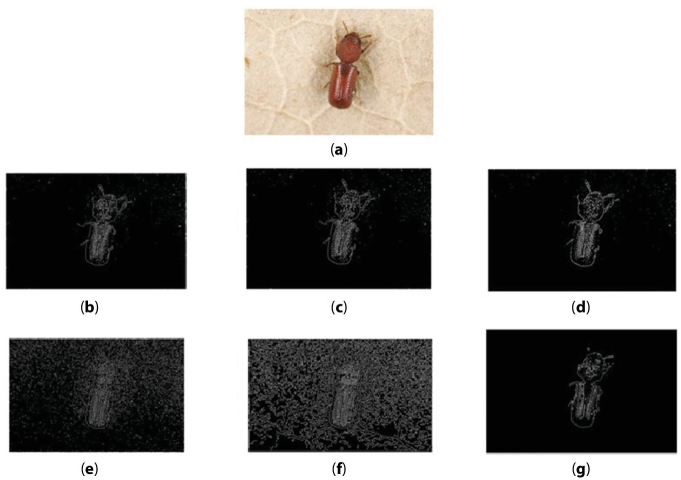
Figure 3.4 Processing of LGB(800 × 534). (a) Original image and results using (b) Sobel, (c) Prewitt, (d) Roberts, (e) LoG, (f) Canny, and (g) morphological methods.
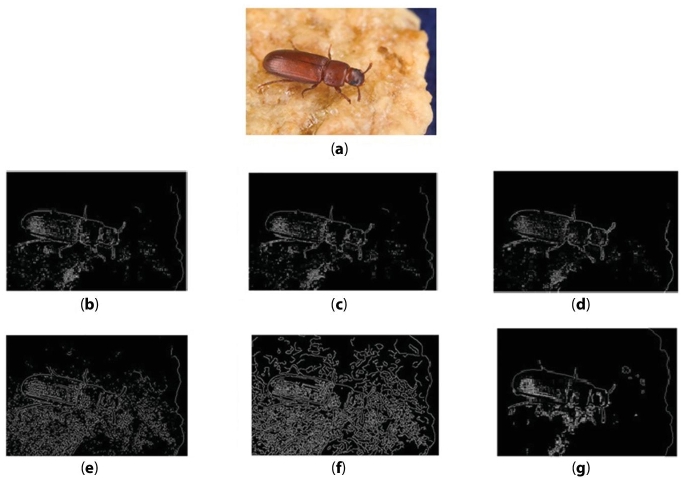
Figure 3.5 Processing of RRFB (640 × 426). (a) Original image and results using (b) Sobel, (c) Prewitt, (d) Roberts, (e) LoG, (f) Canny, and (g) morphological methods.
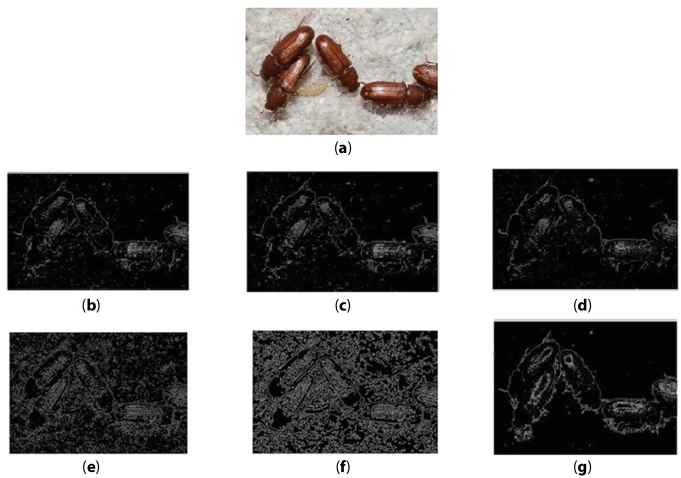
Figure 3.6 Processing of CFB (750 × 511). (a) Original image and results using (b) Sobel, (c) Prewitt, (d) Roberts, (e) LoG, (f) Canny, and (g) morphological methods.
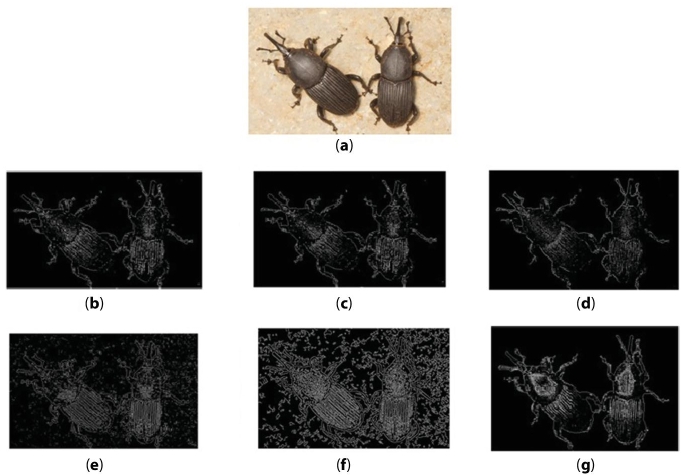
Figure 3.7 Processing of GW (800 × 502). (a) Original image and results using (b) Sobel, (c) Prewitt,(d) Roberts, (e) LoG, (f) Canny, and (g) morphological methods.
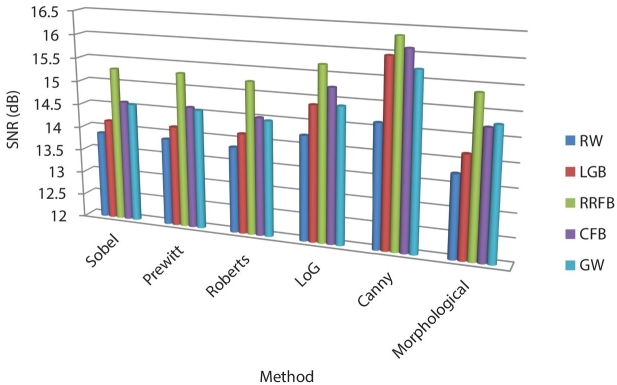
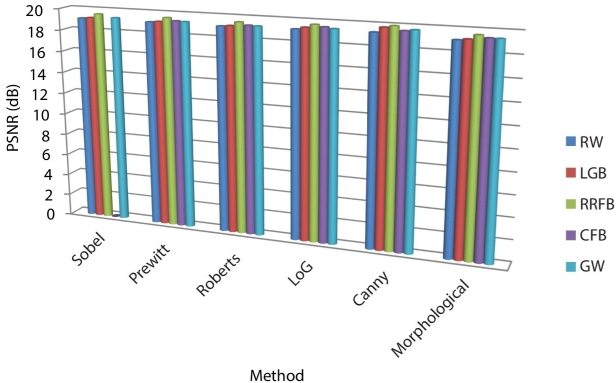
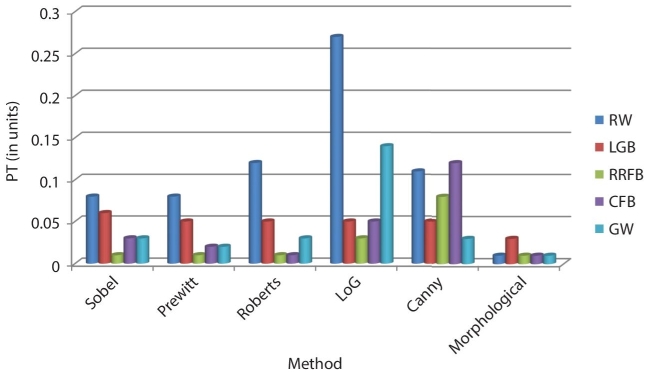
Figure 3.10 PT (in units) representation of several methods.
Table 3.1 Evaluation of methods using SNR(dB) value.
| Method | RW | LGB | RRFB | CFB | GW |
| Sobel | 13.87 | 14.15 | 15.29 | 14.59 | 14.55 |
| Prewitt | 13.87 | 14.15 | 15.30 | 14.60 | 14.55 |
| Roberts | 13.84 | 14.14 | 15.24 | 14.51 | 14.46 |
| LoG | 14.23 | 14.87 | 15.69 | 15.25 | 14.89 |
| Canny | 14.62 | 15.95 | 16.34 | 16.11 | 15.72 |
| Morphological | 13.75 | 14.16 | 15.36 | 14.71 | 14.78 |
| Method | RW | LGB | RRFB | CFB | GW |
| Sobel | 19.09 | 19.18 | 19.55 | 19. 32 | 19.29 |
| Prewitt | 19.09 | 19.18 | 19.57 | 19.32 | 19.29 |
| Roberts | 19.09 | 19.17 | 19.54 | 19.29 | 19.27 |
| LoG | 19.20 | 19.39 | 19.69 | 19.52 | 19.41 |
| Canny | 19.32 | 19.78 | 19.95 | 19.58 | 19.70 |
| Morphological | 19.07 | 19.18 | 19.58 | 19.37 | 19.37 |
Table 3.3 PT (in units) calculation of several methods.
| Method | RW | LGB | RRFB | CFB | GW |
| Sobel | 0.08 | 0.06 | 0.01 | 0.03 | 0.03 |
| Prewitt | 0.08 | 0.05 | 0.01 | 0.02 | 0.02 |
| Roberts | 0.12 | 0.05 | 0.01 | 0.01 | 0.03 |
| LoG | 0.27 | 0.05 | 0.03 | 0.05 | 0.14 |
| Canny | 0.11 | 0.05 | 0.08 | 0.12 | 0.03 |
| Morphological | 0.01 | 0.03 | 0.01 | 0.01 | 0.01 |
Similarly, from the analysis of CFB and GW images, as mentioned in Figures 3.6 and 3.7, respectively, morphological method detects the CFB and GW pests from images in a better way as compared with others, and its PT is 0.01 unit in both cases. However, Sobel, Prewitt, and Roberts methods try to detect the CFB and GW, and LoG and Canny methods also try to detect the CFB and GW pests from the images. However, the results of LoG and Canny methods are not so good as compared with the Sobel, Prewitt, and Roberts methods.
3.5 Conclusion
In this chapter, a UAV-assisted pest detection model is proposed which mainly consists of four phases, such as data acquisition, ED, feature extraction, and pest identification. In this work, we have only focused on the ED part by analyzing the pests in the SG images. The implementation of the SED methods is performed using MATLAB R2015b and evaluated using SNR, PSNR, and PT. From the results, it is observed that morphological ED method detects the edges well with lower PT. In the future, this SED method will be taken in our pest detection model. Then, the edge detected images are given to a classifier for learning to identify the pests accurately. This proposed model will be a better solution for the prevention of SGs.
References
- 1. Qin, Y., Wu, Y., Wang, Q., Yu, S., Method for pests detecting in stored grain based on spectral residual saliency edge detection. Grain Oil Sci. Technol., 2, 33–38, 2019.
- 2. Shen, Y., Zhou, H., Li, J., Jian, F., Jayas, D.S., Detection of stored-grain insects using deep learning. Comput. Electron. Agric., 145, 319–325, 2018.
- 3. Solà, M., Riudavets, J., Agusti, N., Detection and identification of five common internal grain insect pests by multiplex PCR. Food Control, 84, 246–254, 2018.
- 4. Kaushik, R. and Singhai, J., An approach for the development of a sensing system to monitor contamination in stored grain, in: 2019 6th International Conference on Signal Processing and Integrated Networks (SPIN), IEEE, pp. 880–884, 2019.
- 5. Kumari, R., Jayachandran, L.E., Ghosh, A.K., Investigation of diversity and dominance of fungal biota in stored wheat grains from governmental warehouses in West Bengal, India. J. Sci. Food Agric., 99, 7, 3490–3500, 2019.
- 6. Liu, L., Wang, R., Xie, C., Yang, P., Wang, F., Sudirman, S., Liu, W., PestNet: An end-to-end deep learning approach for large-scale multi-class pest detection and classification. IEEE Access, 7, 45301–45312, 2019.
- 7. Priyadarsini, J., Karthick, B.N., Karthick, K., Karthikeyan, B., Mohan, S., Detection of PH value and Pest control for eco-friendly agriculture, in: 2019 5th International Conference on Advanced Computing & Communication Systems (ICACCS), IEEE, pp. 801–804, 2019.
- 8. Glen, N., Korol, O., Andre, L., Robert, F., Tom, G., Extracting pest risk information from risk assessment documents, in: 2019 ACM/IEEE Joint Conference on Digital Libraries (JCDL), IEEE, pp. 368–369, 2019.
- 9. Losey, S.M., Daglish, G.J., Phillips, T.W., Orientation of rusty grain beetles, Cryptolestes ferrugineus (Coleoptera: Laemophloeidae), to semiochemicals in field and laboratory experiments. J. Stored Prod. Res., 84, 101513, 2019.
- 10. Njoroge, A., Affognon, H., Richter, U., Hensel, O., Rohde, B., Chen, D., Mankin, R., Acoustic, Pitfall Trap, and Visual Surveys of Stored Product Insect Pests in Kenyan Warehouses. Insects, 10, 4, 105, 2019.
- 11. Jian, F., Influences of stored product insect movements on integrated pest management decisions. Insects, 10, 4, 100, 2019.
- 12. McCulloch, G.A., Mohankumar, S., Subramanian, S., Rajan, T.S., Rahul, C., Surendran, R., Walter, G.H., Contrasting patterns of phylogeographic structuring in two key beetle pests of stored grain in India and Australia. J. Pest Sci., 92, 3, 1249–1259, 2019.
- 13. Banga, K.S., Kotwaliwale, N., Mohapatra, D., Giri, S.K., Techniques for insect detection in stored food grains: An overview. Food Control, 94, 167–176, 2018.
- 14. Daglish, G.J., Nayak, M.K., Arthur, F.H., Athanassiou, C.G., Insect pest management in stored grain, in: Recent Advances in Stored Product Protection, pp. 45–63, Springer, Berlin, Heidelberg, 2018.
- 15. Athanassiou, C.G. and Rumbos, C.I., Emerging pests in durable stored products, in: Recent Advances in Stored Product Protection, pp. 211–227, Springer, Berlin, Heidelberg, 2018.
- 16. Golden, G., Quinn, E., Shaaya, E., Kostyukovsky, M., Poverenov, E., Coarse and nano emulsions for effective delivery of the natural pest control agent pulegone for stored grain protection. Pest Manage. Sci., 74, 4, 820–827, 2018.
- 17. Eliopoulos, P.A., Potamitis, I., Kontodimas, D.C., Estimation of population density of stored grain pests via bioacoustic detection. Crop Prot., 85, 71–78, 2016.
- 18. Stejskal, V., Hubert, J., Aulicky, R., Kucerova, Z., Overview of present and past and pest-associated risks in stored food and feed products: European perspective. J. Stored Prod. Res., 64, 122–132, 2015.
- 19. Hammond, N.E.B., Hardie, D., Hauser, C.E., Reid, S.A., Can general surveillance detect high priority pests in the Western Australian Grains Industry? Crop Prot., 79, 8–14, 2016.
- 20. Li, Y.Y., Fields, P.G., Pang, B.P., Coghlin, P.C., Floate, K.D., Prevalence and diversity of Wolbachia bacteria infecting insect pests of stored products. J. Stored Prod. Res., 62, 93–100, 2015.
- 21. Santiago, R.M.C., Rabano, S.L., Billones, R.K.D., Calilung, E.J., Sybingco, E., Dadios, E.P., Insect detection and monitoring in stored grains using MFCCs and artificial neural network, in: TENCON 2017-2017 IEEE Region 10 Conference, IEEE, pp. 2542–2547, 2017.
- 22. Zhu, C., Wang, J., Liu, H., Mi, H., Insect identification and counting in stored grain: Image processing approach and application embedded in smart-phones. Mobile Inf. Syst., 2018, 2–5, 2018.
- 23. Tigar, B.J. and Hursthouse, A.S., Using elemental profiling to determine intrinsic markers to track the dispersal of P rostephanus truncatus, a pest of stored grain with alternative natural hosts. Entomol. Experiment. Appl., 160, 1, 83–90, 2016.
- 24. Engl, T., Eberl, N., Gorse, C., Krüger, T., Schmidt, T.H., Plarre, R., Kaltenpoth, M., Ancient symbiosis confers desiccation resistance to stored grain pest beetles. Mol. Ecol., 27, 8, 2095–2108, 2018.
- 25. Neethirajan, S., Karunakaran, C., Jayas, D.S., White, N.D.G., Detection techniques for stored-product insects in grain. Food Control, 18, 2, 157–162, 2007.
- 26. Cox, P.D. and Collins, L.E., Factors affecting the behaviour of beetle pests in stored grain, with particular reference to the development of lures. J. Stored Prod. Res., 38, 2, 95–115, 2002.
- 27. Armitage, D.M., Cogan, P.M., Wilkin, D.R., Integrated pest management in stored grain: Combining surface insecticide treatments with aeration. J. Stored Prod. Res., 30, 4, 1994.
- 28. Yang, Y., Peng, B., Wang, J., A system for detection and recognition of pests in stored-grain based on video analysis, in: International Conference on Computer and Computing Technologies in Agriculture, pp. 119–124303–319, Springer, Berlin, Heidelberg, 2010.
- 29. Herron, G.A., Resistance to grain protectants and phosphine in coleopterous pests of grain stored on farms in New South Wales. Aust. J. Entomol., 29, 3, 183–189, 1990.
- 30. Elmouttie, D., Kiermeier, A., Hamilton, G., Improving detection probabilities for pests in stored grain. Pest Manage. Sci., 66, 12, 1280–1286, 2010.
- 31. Eliopoulos, P.A., Potamitis, I., Kontodimas, D.C., Estimation of population density of stored grain pests via bioacoustic detection. Crop Prot., 85, 71–78, 2016.
- 32. Baker, J.E., Dowell, F.E., Throne, J.E., Detection of parasitized rice weevils in wheat kernels with near-infrared spectroscopy1. Biol. Control, 16, 1, 88–90, 1999.
- 33. Nayak, M.K., Daglish, G.J., Byrne, V.S., Effectiveness of spinosad as a grain protectant against resistant beetle and psocid pests of stored grain in Australia. J. Stored Prod. Res., 41, 4, 455–467, 2005.
- 34. Stefanazzi, N., Stadler, T., Ferrero, A., Composition and toxic, repellent and feeding deterrent activity of essential oils against the stored-grain pests Tribolium castaneum (Coleoptera: Tenebrionidae) and Sitophilus oryzae (Coleoptera: Curculionidae). Pest Manage. Sci., 67, 6, 639–646, 2011.
- 35. Stejskal, V., Aulický, R., Kučerová, Z., Lukáš, J., Method of sampling and laboratory extraction affects interpretation of grain infestation by storage pests. J. Plant Dis. Prot., 115, 3, 129–133, 2008.
- 36. Flinn, P.W., Hagstrum, D.W., Reed, C., Phillips, T.W., United States Department of Agriculture–Agricultural Research Service stored-grain area-wide Integrated Pest Management program. Pest Manage. Sci Formerly Pestic. Sci., 59, 6-7, 614–618, 2003.
- 37. Shah, M.A. and Khan, A.A., Imaging techniques for the detection of stored product pests. Appl. Entomol. Zool., 49, 2, 201–212, 2014.
- 38. Mozaffari, M., Saad, W., Bennis, M., Nam, Y.H., Debbah, M., A tutorial on UAVs for wireless networks: Applications, challenges, and open problems. IEEE Commun. Surv. Tutorials, 21, 2334–2360, 2019.
- 39. Atencia, C.R., Del Ser, J., Camacho, D., Weighted strategies to guide a multi-objective evolutionary algorithm for multi-UAV mission planning. Swarm Evol. Comput., 44, 480–495, 2019.
- 40. Gupta, S. and Mazumdar, S.G., Sobel edge detection algorithm. Int. J. Comput. Sci. Manage.Res., 2, 1578–1583, 2013.
- 41. Chaple, G. and Daruwala, R.D., Design of Sobel operator based image edge detection algorithm on FPGA, in: International Conference on Communication and Signal Processing, IEEE, pp. 788–792, 2014.
- 42. Patel, J., Patwardhan, J., Sankhe, K., Kumbhare, R., Fuzzy inference based edge detection system using Sobel and Laplacian of Gaussian operators, in: Proceedings of the International Conference and Workshop on Emerging Trends in Technology, New York, USA, pp. 694–697, ACM, 2011.
- 43. Gao, W., Xiaoguang, Z., Lei, Y., Huizhong, L., An improved Sobel edge detection, in: 3rd International Conference on Computer Science and Information Technology, vol. 5, IEEE, pp. 67–71, 2010.
- 44. Zhou, R.-G., Han, Y., Yu, C., Feng-Xin, L., Quantum image edge extraction based on improved Prewitt operator. Quantum Inf. Process., 18, 9, 261, 2019.
- 45. Lofroth, M. and Ebubekir, A., Auto-focusing approach on multiple micro objects using the prewitt operator. Int. J. Intell. Rob. Appl., 2, 4, 413–424, 2018.
- 46. Ye, H., Bin, S., Shili, Y., Prewitt edge detection based on BM3D image denoising, in: 2018 IEEE 3rd Advanced Information Technology, Electronic and Automation Control Conference(IAEAC), IEEE, pp.1593–1597, 2018.
- 47. Amer, G., Mahmoud, H., Ahmed, M.A., Edge detection methods, in: 2015 2nd World Symposium on Web Applications and Networking (WSWAN), IEEE, pp.1–7, 2015.
- 48. Srivastava, D., Rashi, K., Shubhi, G., Implementation and statistical comparison of different edge detection techniques, in: Advances in Computer and Computational Sciences, pp. 211–228, Springer, Singapore, 2017.
- 49. Singh, S. and Rakesh, S., Comparison of various edge detection techniques, in: 2015 2nd International Conference on Computing for Sustainable Global Development (INDIACom), IEEE, pp. 393–396, 2015.
- 50. Wan, J., Xiaofu, H., Pengfei, S., An iris image quality assessment method based on Laplacian of Gaussian operation, in: MVA, pp. 248–251, 2007.
- 51. Mohamad, A.S., Nur, S.A.H., Muhammad, N.N., Roszymah, H., Jameela, S., Automated detection of human RBC in diagnosing sickle cell anemia with Laplacian of Gaussian filter, in: 2018 IEEE Conference on Systems, Process and Control (ICSPC), IEEE, pp. 214–217, 2018.
- 52. Saad, O.M., Ahmed, S., Lotfy, S., Mohammed, S.S., Automatic arrival time detection for earthquakes based on Modified Laplacian of Gaussian filter. Comput. Geosci., 113, 43–53, 2018.
- 53. Ghosal, S.K., Jyotsna, K.M., Ram, S., High payload image steganography based on Laplacian of Gaussian (LoG) edge detector. Multimedia Tools Appl., 77, 23, 30403–30418, 2018.
- 54. Yu-Qian, Z., Gui, W.H., Chen, Z.C., Tang, J.T., Li, L.Y., Medical images edge detection based on mathematical morphology, in: Engineering in Medicine and Biology 27th Annual Conference, IEEE, pp. 6492–6495, 2006.
- 55. Wang, M., Jesse, S.J., Yifei, J., Xianfeng, H., Lei, G., Liping, X., The improved canny edge detection algorithm based on an anisotropic and genetic algorithm, in: Chinese Conference on Image and Graphics Technologies, pp. 115–124, Springer, Singapore, 2016.
- 56. Xin, G., Chen, K., Hu, X., An improved Canny edge detection algorithm for color image, in: 10th International Conference on Industrial Informatics, IEEE, pp. 113–117, 2012.
- 57. Othman, Z. and Azizi, A., An adaptive threshold based on multiple resolution levels for canny edge detection, in: International Conference of Reliable Information and Communication Technology, Springer, Cham, pp. 316–323, 2017.
- 58. Shanmugavadivu, P. and Kumar, A., Modified eight-directional canny for robust edge detection, in: International Conference on Contemporary Computing and Informatics, IEEE, pp. 751–756, 2014.
- 59. Nayak, S.R., Mishra, J., Khandual, A., Palai, G., Fractal dimension of RGB color images. Optik, 162, 196–205, 2018.
- 60. Nayak, S.R. and Mishra, J., Analysis of Medical Images Using Fractal Geometry, in: Histopathological Image Analysis in Medical Decision Making, pp. 181–201, IGI Global, 2019.
- 61. Nayak, S.R., Mishra, J., Palai, G., Analysing roughness of surface through fractal dimension: A review. Image Vision Comput., 89, 21–34, 2019.
- 62. Jena, K.K., Mishra, S., Mishra, S.N., Bhoi, S.K., Nayak, S.R., MRI brain tumor image analysis using fuzzy rule based approach. J. Res. Lepidoptera, 50, 98–112, 2019.
- 63. Nayak, S.R. and Mishra, J., A modified triangle box-counting with precision in error fit. J. Inf. Optim. Sci., 39, 113–128, 2018.
- 64. Jena, K.K., Mishra, S., Mishra, S.N., Bhoi, S.K., 2L-ESB: A two level security scheme for edge based image steganography. Int. J. Emerging Technol., 10, 29–38, 2019.
- 65. Nayak, S.R., Mishra, J., Palai, G., An extended DBC approach by using maximum Euclidian distance for fractal dimension of color images. Optik, 166, 110–115, 2018.
- 66. Jena, K.K., Bhoi, S.K., Nayak, M.K., Baral, C.K., Patro, D.M.K., Mohanty, S.S., A smart watering system using IoT. Pramana Res. J., 69, 3, 527–535, 2019.
- 67. Nayak, S.R., Ranganath, A., Mishra, J., Analysing fractal dimension of color images, in: IEEE International Conference on Computational Intelligence and Networks, CINE, pp. 156–159, 2015.
- 68. Jena, K.K., Mishra, S., Mishra, S.N., An edge detection approach for fractal image processing, in: Examining Fractal Image Processing and Analysis, Hershey, Pennsylvania, pp. 1–22, IGI Global, 2019.
- 69. Nayak, S.R., Mishra, J., Padhy, R., A new extended differential box-counting method by adopting unequal partitioning of grid for estimation of fractal dimension of grayscale images, in: Computational Signal Processing and Analysis, pp. 45–57, Springer, Singapore, 2018.
- 70. Das, S.K., Nayak, S.R., Mishra, J., Fractal geometry: The beauty of computer graphics. J. Adv. Res. Dyn. Control Syst., 9, 10, 76–82, 2017.
- 71. Jena, K.K., Mishra, S., Mishra, S.N., An algorithmic approach based on CMS edge detection technique for the processing of digital images, in: Examining Fractal Image Processing and Analysis, Hershey, Pennsylvania, pp. 252–272, IGI Global, 2019.
- 72. Nayak, S.R., Khandual, A., Mishra, J., Ground truth study on fractal dimension of color images of similar texture. J. Text. Inst., 109, 1159–1167, 2018.
- 73. Jena, K.K., Mishra, S., Mishra, S.N., Bhoi, S.K., An entropy based thresholding approach for image edge detection. J. Appl. Sci. Comput., 2, 309–322, 2019.
- 74. Nayak, S.R., Mishra, J., Jena, P.M., Fractal analysis of image sets using differential box counting techniques. Int. J. Inf. Technol., 10, 39–47, 2018.
- 75. Jena, K.K., Bhoi, S.K., Maharana, P.K., Das, P.R., Senapati, P.K., A smart and secure home automation system using IoT. Universal Rev., 8, 3, 125–132, 2019.
- 76. Nayak, S.R., Mishra, J., Palai, G., A modified approach to estimate fractal dimension of gray scale images. Optik, 161, 136-145, 2018.
- 77. Jena, K.K., Nayak, S.R., Mishra, S., Mishra, S.N., Vehicle number plate detection: An edge image based approach, in: 4th Springer International Conference on Advanced Computing and Intelligent Engineering, Advances in Intelligent Systems and Computing, 2019.
- 78. Nayak, S.R., Mishra, J., Padhy, R., An improved algorithm to estimate the fractal dimension of gray scale images, in: International Conference on Signal Processing, Communication, Power and Embedded System, IEEE, pp. 1109–1114, 2016.
- 79. Nayak, S.R., Mishra, J., Jena, P.M., Fractal dimension of grayscale images, in: Progress in Computing, Analytics and Networking, pp. 225–234, Springer, Singapore, 2018.
- 80. https://www.agric.wa.gov.au/pest-insects/insect-pests-stored-grain
- 81. https://www.google.com/search?q=primary+and+secondary+stored+ grain+pests&sxsrf=ACYBGNQvb6AbxvSe5qzHXD9Lo7-TqYwSSw:1575972076386&source=lnms&tbm=isch&sa=X&ved=2ahUKEwihy6e-6armAhUqxjgGHRjuD9AQ_AUoAXoECBIQAw&biw=1600&bih=789
Note
- * Corresponding author: [email protected]