
CHAPTER 3
Framing Part II: Considerations for Working with Data and AI
“I've learned that if you are not failing a lot, you're probably not being as creative as you could be—you aren't stretching your imagination.”
—John Backus
In Chapter 1, ”Climbing the AI Ladder,” we mentioned that “not all data can be considered equal.” Inequality is not just restricted to data. In many ways, the fact that the employees of the organizations we work for all have different jobs implies that we invariably will have different needs—we all don't have the same identical needs. Our unique needs define what data we use and how best we wish to consume that data. This chapter will lay the foundation as to why a modern environment for data analytics and artificial intelligence (AI) should not fixate on a single version of the truth paradigm.
AI can now be considered a necessary proxy for applying human knowledge, and the ripple effect of using AI will mean that the traditional ways that people work are going to be altered. The type of data that you'll need will change too. Beyond big data, specialized data that is far more precise in describing a real-world object (such as a person) or an event (such as a political rally or a business transaction) will be required, and so we will begin to examine how knowledge of ethnography can be blended with big data.
For AI to be of assistance, organizations must encapsulate knowledge in an ontology. An ontology is the result of organizing relationships or axioms for the concepts and features that make up the knowledge base. As such, an ontology may further aid in the removal of bias from outcomes and provide a means for outcomes to be viewed as fair and transparent.
Within the context of our jobs, data must be accessible, accurate, curated, and organized. Data shouldn't be difficult to consume. This sentiment also holds true for machine learning.
Personalizing the Data Experience for Every User
A single data store is not sufficient to provide all of the data needs for an organization. Unless latency can be eliminated for any type of interaction, a single data store is always going to be impractical, unfeasible, and far too complicated to ever be worth considering.
Information must flow through an information architecture in a precise, orderly, and orchestrated sequence (and ultimately, one that is repeatable and predictable). When you're planning for more than one data store, the ability to move data requires a high degree of discipline.
The paramount requirement to truly personalize a user experience (UX) is that information from any data domain be correctly organized. For certain domains like product or financial data, this also entails being appropriately structured.
Any process that involves data content must be integrated into an onboarding and data movement process. Associations must be established between data domains, context, and the user's behavior (these are the user's signals, digital footprints, and electronic body language) so that the user can be properly served with the information that is needed. Having some type of signal for a user's next action can help determine what information is then served. The resulting information may be in the form of lists, specifications, instructions (displayed, audible, or tactile), policies, reference materials, diagrams, images, and so on.
All too often organizations try to build a singular data store to represent a single version of the truth from the perspective of the enterprise. The assumption is that managing a single data store is preferable to managing multiple data stores, and only in a singular data store can organizational truth be adequately managed. The thinking behind this approach is that everybody associated with an organization wants to access information in the same way and with the same representations.
Here's an example: To maintain the truth and consistency, an organization might want all database references to New York City to be recorded as “New York City.” However, the organization's legal department might want to use the legal name of the city, which is “The City of New York.” The organization's travel department might want to use an airport code such as “JFK” or “LGA” in lieu of the destination, New York City. And, the sales department might want to use the post office's preferred name, which is simply “New York.” Other departments might need to use one of the borough names such as “Manhattan,” “Queens,” “The Bronx,” “Brooklyn,” or “Staten Island.” Conversely, the county names might need to be referenced such as “New York,” “Bronx,” “Queens,” “Kings,” and “Richmond.”
A single version of the truth can sometimes be counterproductive to the various specialized needs of each line of business, department, and worker.
For many organizations, the notion of creating a custom, personalized, or hyper-personalized experience for each customer is a desirable business practice. Extreme personalization is to treat each client or customer in a cohort of one. But when looking inwardly, at the employees, personalization can be difficult for IT departments to grapple with. Instead of giving each worker specialized service, IT often opts to steer all workers to use a common, single service. But if hyper-personalization is appropriate for a customer, why not for an employee?
The problem arises because IT has historically viewed an organization as an enterprise. An enterprise is, by its nature, a singularity. IT has often offered the mantra that IT must align to the enterprise…“or else!” When viewing an enterprise or an organization as a whole, the opportunity to support specialized needs can be seen as frictional or counter to serving the perceived needs of the singularity. But this perceived oneness is a false illusion.
To help you understand how specialization provides for efficiency and adaption, we can examine ourselves. As individuals, we are singular and a “one.” However, below the surface, our bodies are made of a number of discrete systems: digestive system, nervous system, circulatory system, etc. Each system carries out a discrete purpose or a set of functions. These subsystems must know how to interoperate. For example, the gut–brain axis is the biochemical interoperability signaling that takes place between the gastrointestinal tract and the central nervous system. Our bodily enterprise, being comprised of specialized functions, allows us to be fast, flexible, and mended when we are broken. We are efficient and adaptive because our bodies are willing to make use of specialization. Analogously, by giving personalizing data for each user in a manner that is conducive to their function, the enterprise will be better equipped to perform. We'll discuss how this can be done in practical terms later.
Context Counts: Choosing the Right Way to Display Data
Enterprises perpetually pursue improvement, whether that's improving response rates from electronic correspondence, customer self-service, social media engagement, or the product experience.
In each of the following scenarios, the means to improve is derived from the ability to provide a relevant piece of information—in the right context, in a timely manner (which may literally be measured in nanoseconds), and in the most visually useful and appropriate form. The information provided may be in the form of a promotion, a special offer, a suggestion for a next-best action, a product or service for a cross-sell or an upsell, or an answer to aid a decision.
Providing relevant information in the right context is an aspect of UX design that must take into account accessibility, usability, and inclusion. Information can be provisioned digitally, visually, audibly, haptically, olfactorily, or kinesthetically.
As shown in Figure 3-1 and the close-up in Figure 3-2, visualization forms from the Mission Control Center for the International Space Station in Houston, Texas, highlight a preference for text-based representations of data.
In Figure 3-1, the command center is set up with a series of large monitor boards on the back wall. The placement of staff workstations is strategic across the command center, with each person's job role illuminated in blue lettering above their station. Each worker is given at least four different monitors with which to work and is assigned to a discrete set of responsibilities. The worker then monitors information relevant to those responsibilities.
The back panel on the left is showing general images of Earth from the Space Station—as such, nothing visually specific. The middle panel is showing the Space Station's projected orbital path around Earth. The rightmost panel is mirroring someone's workstation monitor.
Figure 3-2 is a closeup of the biomedical engineer's (BME) station. In the Mission Control Center, the BME serves as a direct link between the flight crew on the International Space Station and the Crew Health Care Systems' hardware and software and provides round-the-clock healthcare support for the crew.

Figure 3-1: Monitors at Mission Control Center for the International Space Station

Figure 3-2: A closer view
During the crewmembers' waking hours, a medical doctor who specializes in aerospace medicine is seated alongside the BME at the surgeon station. The BME's monitors contain windows of information, which is heavily tilted toward text rather than a visual graphic. In part, this is because explicit values are preferred when dealing with well-being, and text does a better job of representing explicit values.
Color can sometimes enhance explicit values as shown on the left monitor in Figure 3-2. Text highlighted in green would show acceptable values, and text highlighted in red would indicate values that are outside of acceptable norms.
Figure 3-3 shows the monitors in a modern hospital's emergency room. Here too, there is a heavy reliance on the use of text-based information, which often prevails over graphical views of the data. In the case of machine-to-machine interactions, text-based or binary data is also likely to prevail over graphic or visual representations.
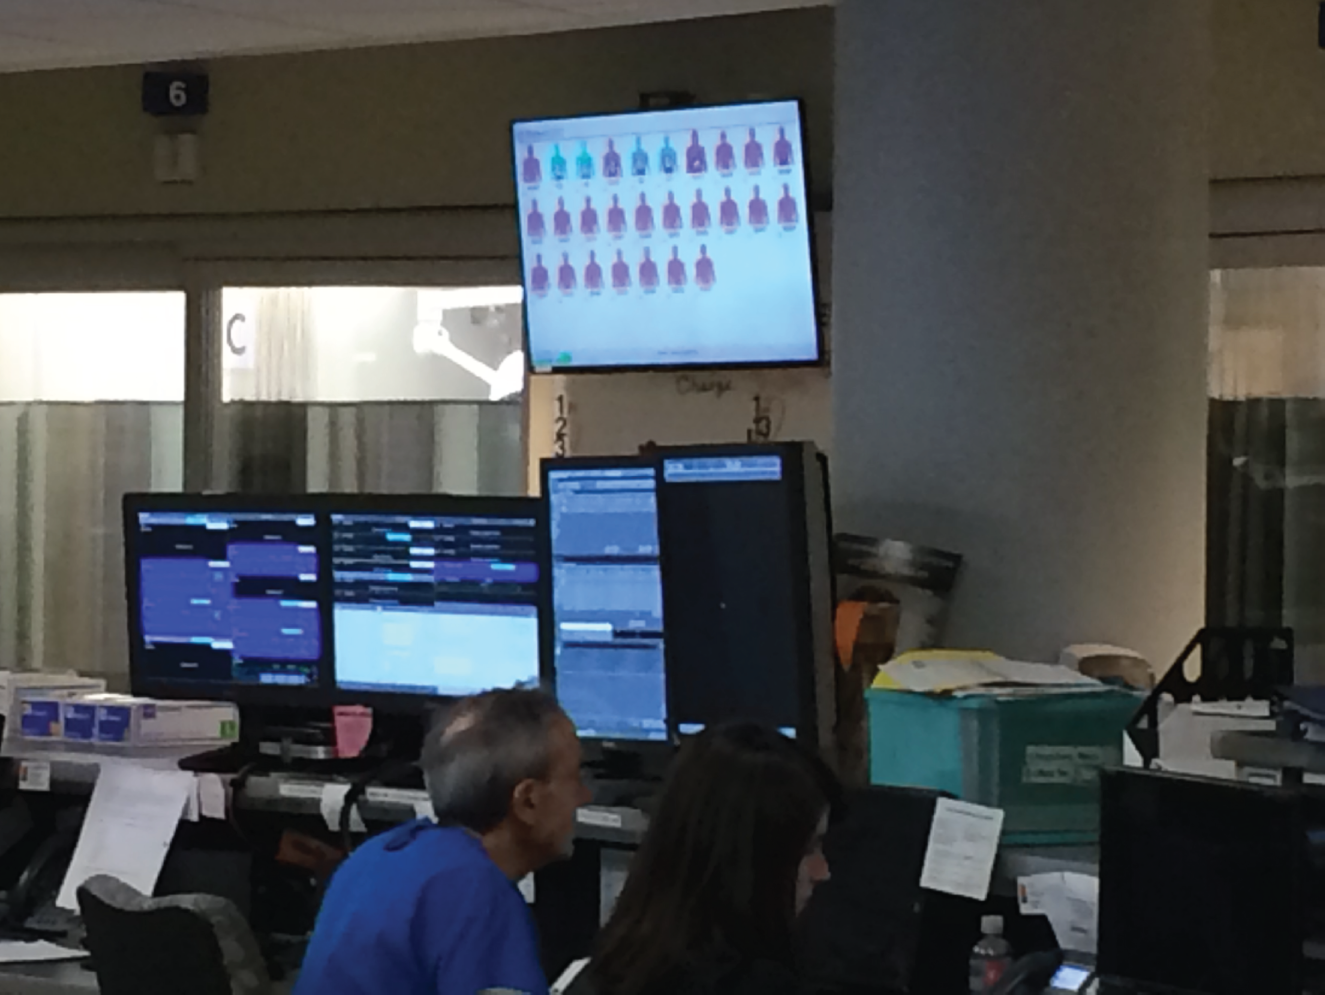
Figure 3-3: Monitors in a hospital emergency room
To illustrate that there are not necessarily any hard and fast rules regarding when and where to use a visualization and when and where to use plain text, an electrocardiogram (EKG) provides an example of a visual that can communicatively work much faster than text.
An EKG is used by doctors to show electrical activity of the heart. Electrodes are placed on the body to detect small electrical changes that are the consequence of the cardiac muscle depolarizing followed by a repolarization during each heartbeat cycle. Changes in a normal EKG pattern—and pattern being the operative word—occur with numerous cardiac abnormalities, including cardiac rhythm disturbances such as atrial fibrillation.
The three main components of an EKG are shown in Figure 3-4. These components are the P wave, which represents the depolarization of the atria; the QRS complex, which represents the depolarization of the ventricles; and the T wave, which represents the repolarization of the ventricles. During each heartbeat, a healthy heart has an orderly depolarization progression.
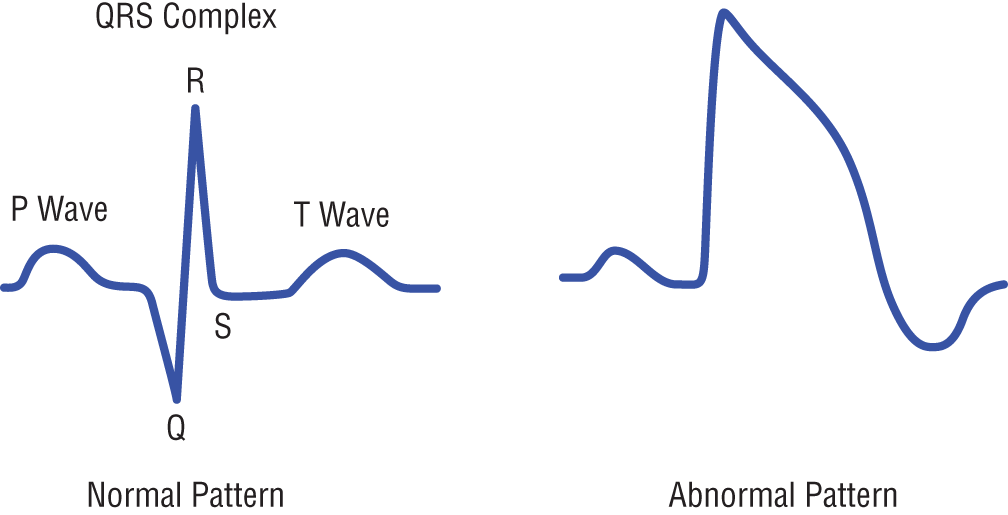
Figure 3-4: An electrocardiogram pattern showing normal and abnormal heartbeats
For the doctor, any pattern shown by the EKG gives way to having to know the exact values for the P wave, the T wave, and the QRS complex. A determination for normalcy is established through pattern detection and not the individual data values. Pattern detection often requires some degree of experience and understanding. However, should the exact values, with decimal precision, be required by the doctor, the text-based values could be leveraged. A normal value for a P wave is a value less than 80 milliseconds and is 160 milliseconds for the T wave. The QRS complex should be between 80 to 100 milliseconds.
A firefighter rushing into a burning building is not likely to make use of visual information even if the information can be relayed on a heads-up display built into the helmet. The firefighter is certainly not going to avert any attention to a handheld smart device or tablet. Studying user behaviors and understanding user motivations in low-stress or high-stress environments provides the necessary context for designing inclusionary experiences and knowing how best to present information that is immediately understandable and actionable. Ultimately, the means to present information to a person or a machine is essentially a signal to respond in some manner.
Data visualization is always going to rely on mixing a meaningful and intelligent blend of both text and graphics. The ratio will depend on the context.
Ethnography: Improving Understanding Through Specialized Data
The ability for an organization to ask any question against any data is no longer a luxury but a necessity. How sufficient or profound the sense of the answer may depend on the underlying information architecture.
Topics such as thick data or its more formal name, ethnography, can be complementary to big data in producing higher levels of insight from deeper levels of information. Big data can generate lots of data points, but through the use of ethnographic techniques, organizations can improve the sense they make of that data.
The phrase that someone's knowledge is “a mile wide and an inch deep” juxtaposes thick data with big data. Big data can have millions of data points for use in AI but represent only a broad sense of knowledge. Thick data can bring a granular level of detail to advanced analytics. In ethnography, the traits associated with the data tend to be more holistic and more fine-grained (detailed) when compared to the data collected through coarser-grained (or big data) techniques. For example, with big data, one might capture weather data across the country based on one-square kilometer grids. The weather data might include ambient temperature, wind speed, wind direction, and humidity captured in five-minute increments. With ethnography, other elements would be added such as the terrain, the use of the land (industrial, farming, city, urban), tidal times if near a body of water, population movements, vehicular movements, etc., which can all serve to further influence the general weather characteristics.
In descriptive statistics, an interquartile range is the measure of statistical dispersion. By looking at where data falls across an interquartile range, an organization can garner sufficient information to determine whether a data point lies within the norm or is an outlier. The ability to leverage discriminant functions over the data can lead to the use of multiple AI models. These models can be specifically trained to address the characteristics or the special nuances of a designated cohort or classification. Being able to apply the right model to the right situation promotes sustainable viability and relevancy. Especially when addressing outliers, adding thick data/ethnography techniques might help improve pattern detection with AI models.
Data Governance and Data Quality
A potential misconception surrounding data lakes that are built from big data sources is that because the ingestion side of the environment is regarded as schema-less (meaning, that the data is written without the necessity to have a predefined structure), no structure is actually required.
As applicable across all forms of analytics, including machine learning and pattern identification, having properly prepared data increases the utility of the data in terms of the results that can be presented for insight or decision-making. Properly preparing data often involves addressing some form of structure.
The Value of Decomposing Data
There might be instances when a machine learning method proves to be more useful when it is used on a decomposed or split attribute as part of feature engineering. In AI, feature engineering is an essential process in using the domain knowledge associated with data to create data points that can make machine learning algorithms more effective.
Consider a timestamp. A timestamp can be represented by its constituent parts, date and time, both of which can also be further decomposed. The date can be split into a year, a month, and a day, while the time can be further split into hours, minutes, and seconds. There could be a business need, for instance, where only the hour is relevant to a machine learning model. Additionally, other features can be derived or engineered from a date such as the day of the week or the proximity to a solstice.
Providing Structure Through Data Governance
Data governance is an essential element in organizing data, providing mechanisms to perform the necessary oversight to ensure that the data is appropriately used to assist in making certain types of decisions. Metrics are used to monitor the effectiveness of those decisions, and data quality helps ensure that those decisions are based on the best possible answers.
Figure 3-5 illustrates how data governance can be applied, proactively or reactively, by an organization. Proactive data governance seeks to prevent issues from arising, while reactive data governance addresses issues that have already risen.
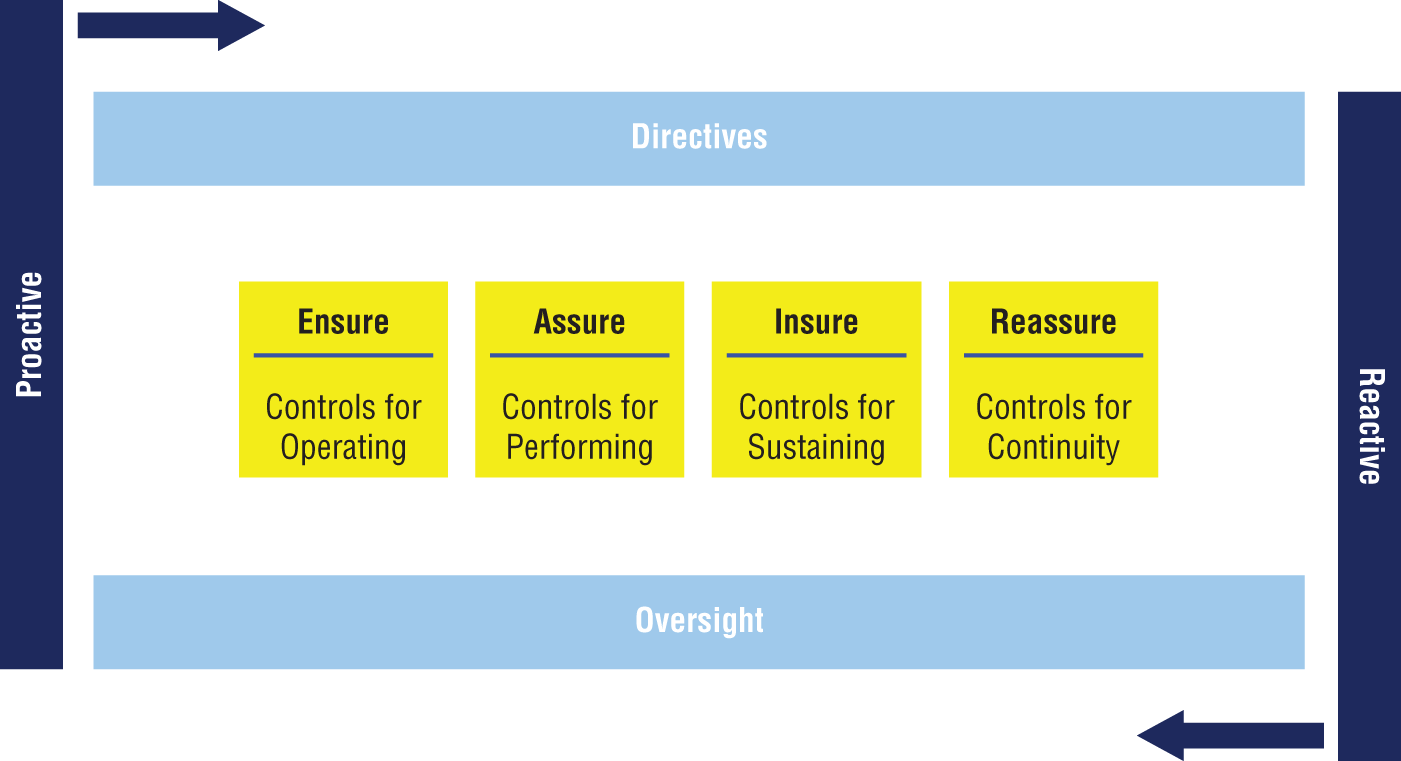
Figure 3-5: Data governance
Directives are used to provide guidance for others to follow when producing or consuming data, while oversight provides the means to observe people and the associated outcomes related to the data that they are producing and consuming.
Ensure, assure, insure, and reassure create an orchestrated flow in the production of data and comprise the practice of data governance.
- Ensure: Various governance controls associated with the creation of standards and guidelines for data and AI
- Assure: Governance controls associated with the creation of data values
- Insure: Governance controls required to sustain governance for AI in an operational mode
- Reassure: Governance controls to provide the continuity and transparency to demonstrate that the use of AI is functioning as intended and fairly
Through data governance, activities such as data quality and data curation are established as part of an organizational set of disciplines and practices.
Curating Data for Training
Data quality should be considered part of the preparation when curating training data. Curation is a process that involves the ability to subset data based on some type of subject-matter bias, and, often, the more highly curated the better. Curating depends on being able to identify the most appropriate data sources, business use cases, and objectives. Curated data can be culled from the following sources:
- Content and data relationships from call center recordings
- Answers to questions from chat logs
- Correlating maintenance data with streaming sensor data
- Use cases and user problems from search logs
- Customer purchase history to look for similarities in buyers and predict responses to offers
- Surfacing buyer segments from email response metrics
- Attributes and attribute values from product catalogs and data sheets
- Procedures, tool lists, and product associations from public references
- Product associations can be mined from transcribed audio tracks from YouTube video content
- Correlating offers and dynamic content to website behavior patterns
- Extracting knowledge and user-intent signals from sentiment analysis, user-generated content, and social graph data
Additional Considerations for Creating Value
AI and cognitive computing require data to be managed in much the same way as data that is used for business intelligence (BI) and other analytical systems, by applying practices from a data governance initiative. Executive sponsorship, charters, roles and responsibilities, decision-making protocols, escalation processes, defined agendas, and linkages to specific business objectives and processes apply equally to all forms of data and analytics.
But, as discussed earlier, data is inert. Data is not self-aware and is not self-organizing. Data, by itself, cannot recognize value. Data requires applications and other processes to ascertain and derive value. Moreover, data must be used if the data is to provide any value at all. Data that sits unused on a spinning disk or is stagnant on a flash drive is just an expense.
The better structured/tagged, the better organized, the better curated, and the better governed the data, the more utility the data will afford to the organization.
Using advanced analytics and AI is to affect a process outcome through accessing the enterprise's data. AI and cognitive computing programs must be aligned to enterprise metrics. Data and data quality are necessary to aiding process effectiveness and achieving the enterprise's business imperatives. Advancing advanced analytics requires capturing and curating data through a pragmatic information architecture.
Ontologies: A Means for Encapsulating Knowledge
Applying techniques from information engineering to information architecture provides the opportunity to plan and incorporate the right type of information organization and schema design.
For AI, knowledge is often leveraged by means of an ontology. An ontology can consist of a number of elements including taxonomies, controlled vocabularies, thesaurus structures, and all of the relationships between terms and concepts.
An ontology represents a domain of knowledge, and the organization's ability to access and retrieve answers in specific contexts is ultimately made possible through information architecture. Therefore, an information architecture plays a strong role in shaping analytical outcomes. Ontologies can be specialized, such as in the ability to support an autonomous driving car, or more generalized, for broader uses in artificial general intelligence (AGI).
Ontologies capture commonsense knowledge and relationships for objects, processes, materials, actions, events, and so on. An ontology forms a foundation for computer reasoning, even if the answer to a question is not explicitly contained within the organization's body of knowledge or corpus.
As nonexplicit answers can be inferred from the facts, terms, and relationships expressed within an ontology, this makes the use of an ontology a vehicle to provide additional business value. In a practical sense, the ability to infer—as an analytical capability—can make a system more user-friendly and forgiving, such as when a user makes a request using phrase variations or when encountering foreign use cases.
An ontology can express the following:
- Entity types: An entity type could be a person, an organization, a bank account, a meeting, a terrorist attack.
- Relationships: These are types between entity types (for example, a person can own a bank account, a person can be a member of an organization, or a person can be the parent of another person).
- Properties of entity types: A person typically has a first name; an organization has an establishment date.
- Hierarchies between entity types: Every cat is a mammal; a tomato is a fruit.
- Logical entities definitions: An orphan is a person where both parents are deceased.
- Logical relationships definitions: If Adam is a parent to Brenda, and Brenda is a parent to Charlie, then Adam is a grandparent to Charlie; in jest, if Michael is a parent to Nigel, Olive is a parent to Penelope, and Michael marries Penelope, Nigel is his own grandfather.
- Assertions: If Deborah is the parent to Edward, then Edward cannot be the parent to Deborah.
Ontology-based information extraction is a form of uncovering facts from the use of an ontology to drive outcomes. By harnessing the knowledge and the rules embedded within an ontology, many complex extraction problems can be solved. Figure 3-6 shows how a basic ontology model can be used to understand contextual facts.
A jaguar can also be a lot of different things, such as a type of car, a ping-pong team, an animal, and so on, as shown in Figure 3-7. A guitar model known as a Jaguar could be inferred from the use of other facts and terms uncovered in natural language processing such as: “The signature jaguar used by Johnny Marr features a taller tremolo arm as well as a four-position slider pickup selector. The modifications were implemented to reflect several of the changes found on other vintage models… .”
The inference to a guitar can conclude that the description is not that of a wild animal or an automobile, etc., but is in fact that of a guitar by the use of the words “tremolo arm,” “pickup selector,” and the awareness that Johnny Marr is known as a guitarist.
Through encapsulating knowledge using techniques as ontologies to assist with AI, organizations can begin to reason on various hypotheses.
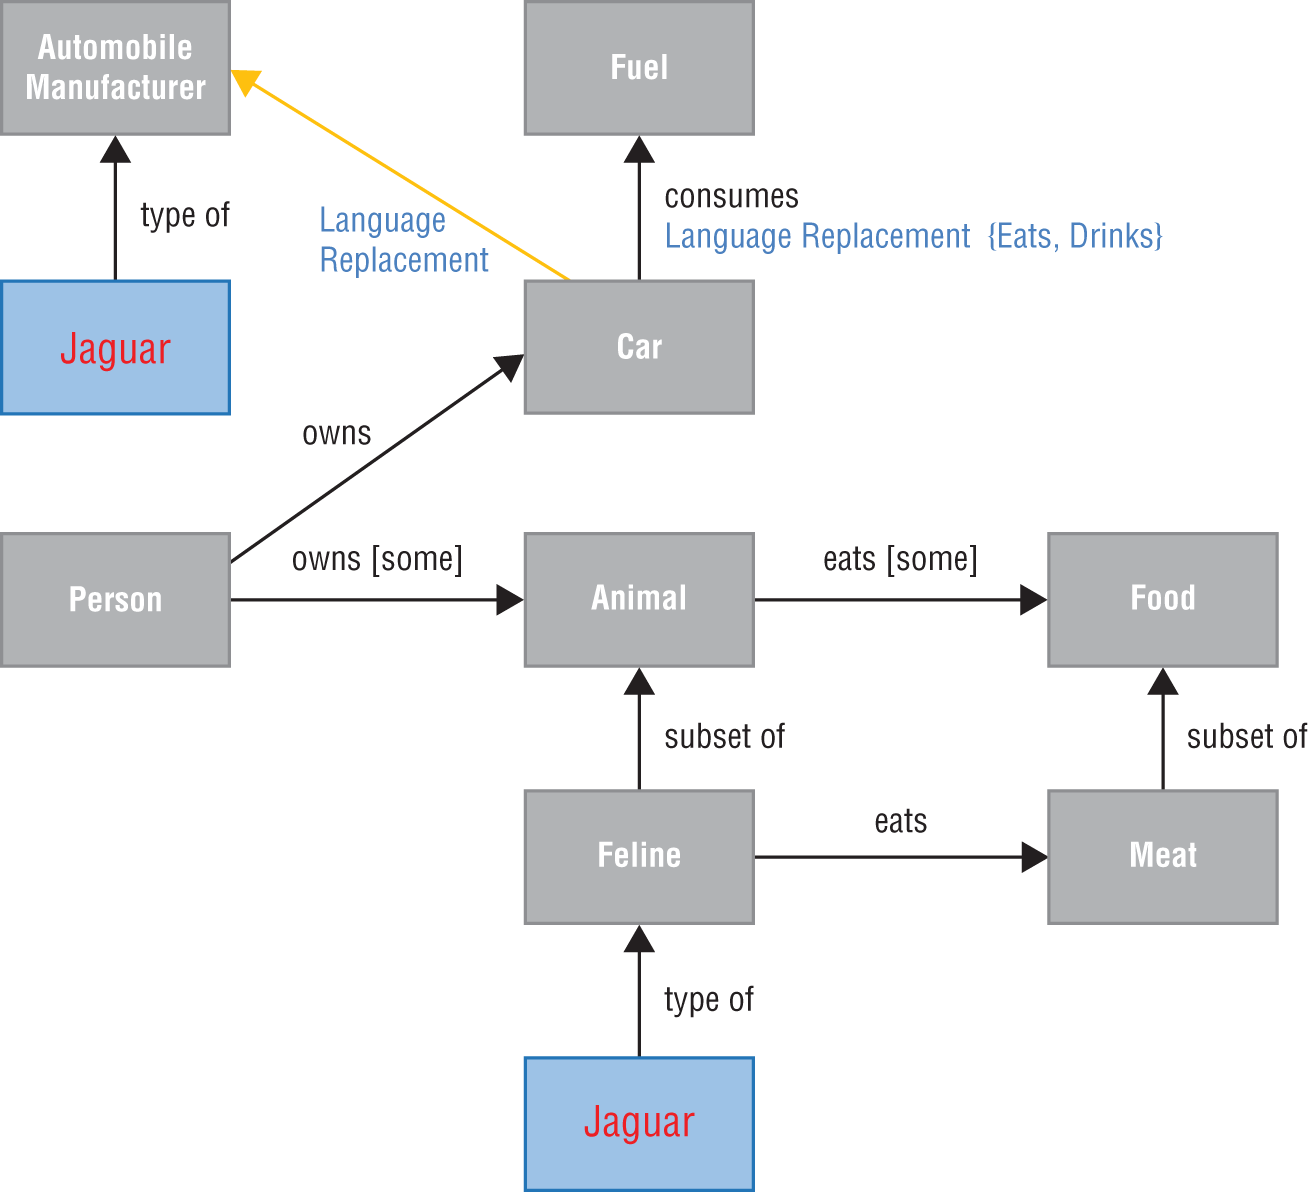
Figure 3-6: An ontological model

Figure 3-7: Inference
Fairness, Trust, and Transparency in AI Outcomes
Machine learning algorithms that parse data, extract patterns, learn, and make predictions and decisions based on gleaned insights are readily applied for use in common applications for search engines, facial recognition, and digital assistants. But despite good intentions, unfairness (often called out as bias) can creep into machine learning and AI.
The more data that is fed into a machine learning algorithm, the smarter it gets, assuming that the data has an appropriate level of quality and that the data is not inherently skewed. If the data is biased in some manner—either through the level of data quality or the choices made to avoid incorporating specific types of data—negative outcomes result.
In 2016, AI was used as a means to judge a beauty contest. More than 6,000 women from more than 100 countries submitted their photographs. AI was promoted as being able to relieve mankind from the social biases that human judges are believed to exert. The deep-learning algorithm selected 44 winners from all of the entrants. Only one of the winners had dark-colored skin. Although there were not any explicit algorithms to favor lighter-skinned women, the limited variety of training data (people of color were vastly underrepresented) was sufficient to establish that level of bias by AI.
Erasing bias from insight is key to creating impartial machine learning algorithms. AI requires a body of knowledge: the corpus of the business and the basis for the organizational universe of discourse. The body of knowledge ultimately contains all of the clues that AI uses for processing and subsequently for interpretation and inferencing. To properly train a predictive model, historical data must meet broad and high-quality standards. While many organizations have created data quality programs with varying degrees of success, organizations will be forced into stepping up their game and also addressing the breadth and representation of their data if they are to maximize their investments in AI.
Fairness, a linguistic antonym to bias, can be a form of corrective bias in its own right. Fairness can help ensure that specific data is included or excluded from analysis. Fairness can ensure that a study, for example, on prostate health or ovarian cysts, will be limited to the appropriate cohort groups, so as not to distort any observations or insights.
Other examples that warrant biased data to achieve fairness in outcomes include AI initiatives that support child welfare and safety, whereby the study of data is limited to juveniles. A gaming vendor that provides cloud gaming capabilities should also understand when a juvenile is playing to avoid inappropriate interactive offers. A financial services company wanting to upsell clients should train models on clients that already use existing services and products. An airline wanting to adequately manage the availability of space in overhead bins as passengers board an aircraft may want to train its models exclusively on the types of baggage brought into the main cabin versus all of the passenger luggage that is loaded onto the plane.
Achieving fairness may also require capturing a deeper level of knowledge in specific areas. For example, Figures 3-8 and 3-9 show the blood test results from a hospitalized patient. The routine blood work results failed to detect any anomaly in the patient's body. Further discrete tests were subsequently required to go deeper into finding or understanding a probable cause for suffering. Bias can therefore result from an insufficient knowledge base from which to draw conclusions, observations, or patterns.
Because certain AI algorithms can learn from the data received, the algorithms can be heavily influenced. An extreme example of the influence data can have upon AI is Microsoft's 2016 chatbot known as Tay. Tay lasted only 16 hours before its plug was pulled. During its short time on Earth, Tay turned homophobic and used Nazi references.
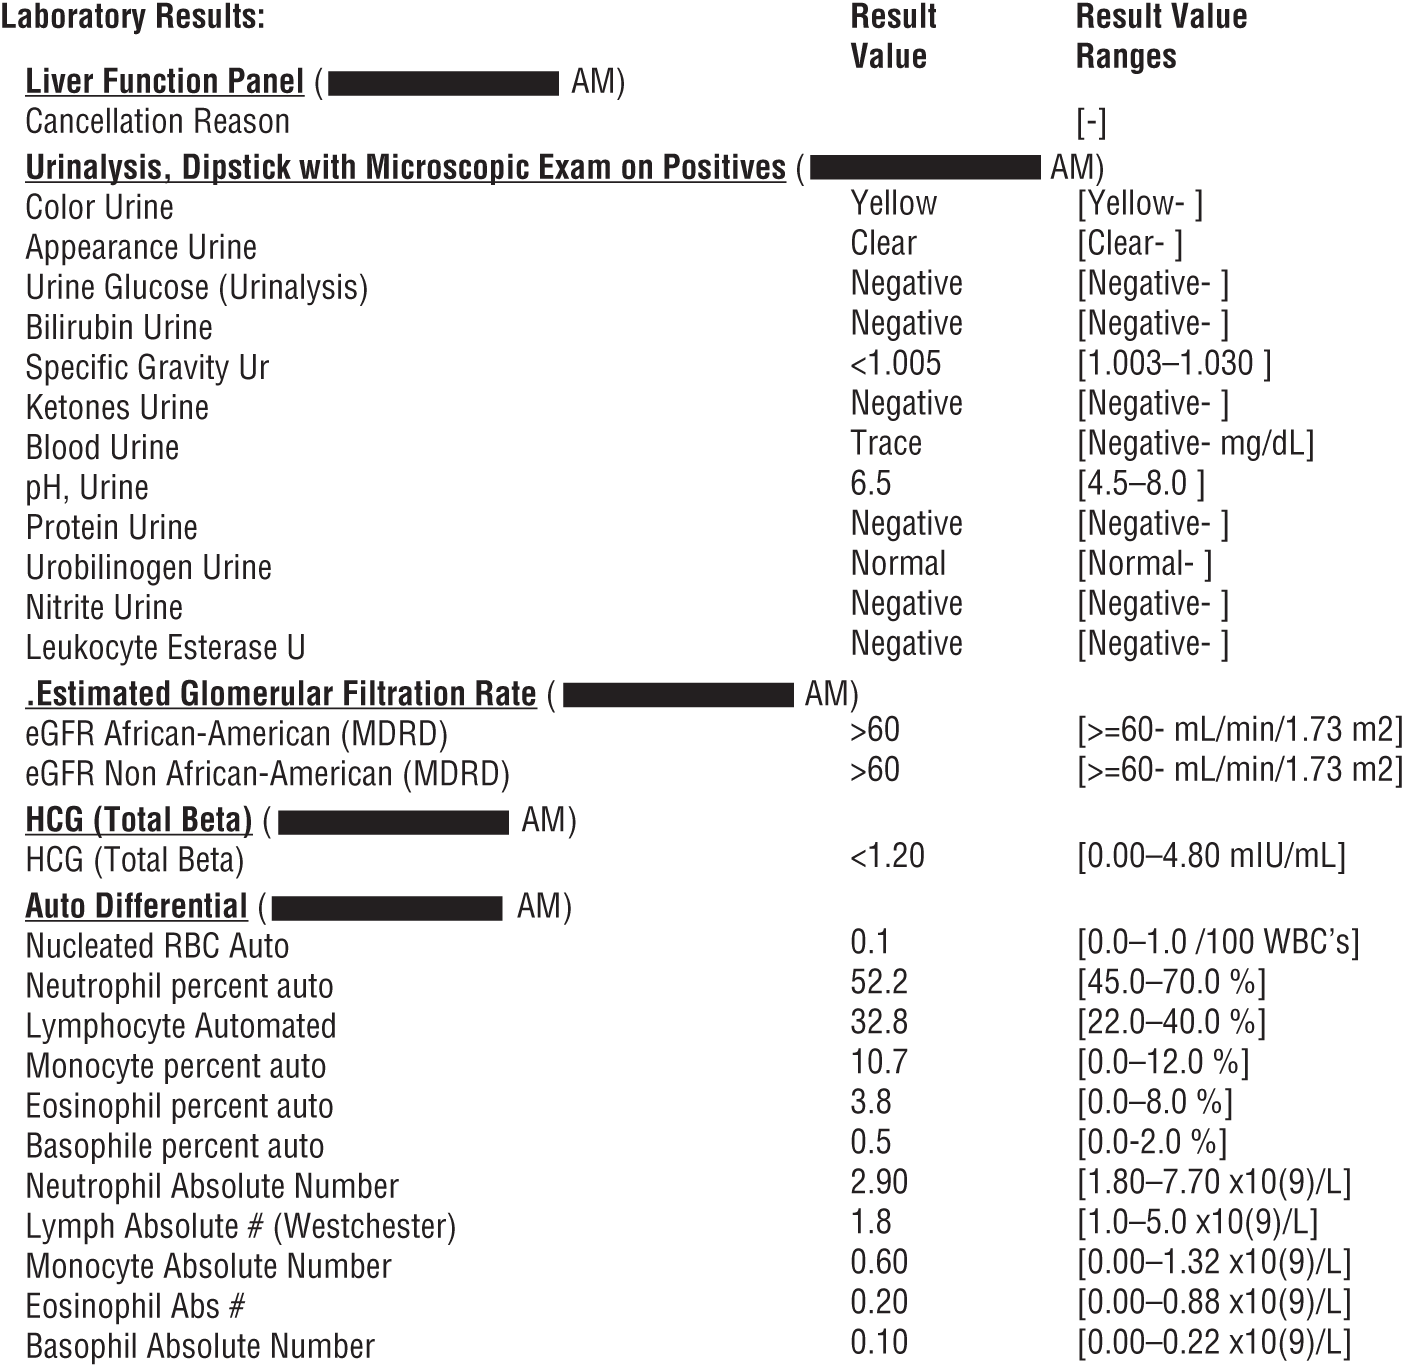
Figure 3-8: Blood test results showing normalcy, part A
Organizations must find ways to fine-tune AI so that any defects can be addressed almost immediately after they are identified. AI without the aid of transparency creates a “black box,” implying a need to operate in a mode of blind trust. In contrast, AI with transparency can be a white box, critical to understanding causation. We'll explore trust a bit deeper in a few pages.

Figure 3-9: Blood test results showing normalcy, part B
Accessible, Accurate, Curated, and Organized
When using machine learning or AI, behaviors such as signals, digital footprints, and electronic body language from a user's current and past interactions can be evaluated and interpreted. By successfully evaluating the user's behaviors, the options with the highest probability of impact can be delivered.
Such behaviors can include a multitude of various data points. The data points may include prior purchases, real-time click-stream data, support center interactions, consumed content, preferences, buying characteristics, demographics, firmographics (which are to businesses and organizations what demographics are to people), social media information, and any other behavioral traits that can be captured by marketing automation and integration technologies.
Results from search queries can be tuned—such that they may even be dissimilar from one interaction to the next—to accommodate nuances between different users based on factors that span precision and generalization. For example, a search engine, in many ways, is nothing more than a recommendation engine.
The signal is the search phrase, and the recommendations form the result set. The more that is known about the user, the more the recommendation (or personalization) can be tailored to that user. This is an example of how ethnography can be leveraged and applied.
If the recommendation from a search is related to a business domain such as product or finance—and regardless of how tailored the result set—there is a fundamental precondition that the data associated with the domain be accessible, accurate, curated, and organized.
The precondition is part of the necessity to establish and maintain an information architecture. Figure 3-10 shows that between the access methods to data (APIs, SQL, or NoSQL) and the users themselves lies the information (the data). At a minimum, the data needs to be:
- Accessible: The data is located in a place and within a medium that makes the data available to a user community for on-demand use.
- Accurate: Here, accuracy is multidimensional and includes a reflection of the exactness in digital form from something in the real world. If the data is supposed to be a person's name, the accuracy of the data should reflect the actual name along with the full and complete spelling. Accuracy also reflects the data's timeliness for consumption.
- Curated: For an intended use, the data provided is of meaning and utility. An aspect of curation is to be able to establish an appropriate subset of data. The subset is created from the total amount of information that is accessible to the enterprise. The curated data (the subset) should be useful to a user so that irrelevant data is not accidently consumed and inadvertently used in a decision or action. Curation also infers that the data is properly annotated and described.
- Organized: Each data point does not occur in isolation. Organization ensures that all relationships across the data are navigable and stored in a technology that makes certain types of navigation easier to perform.
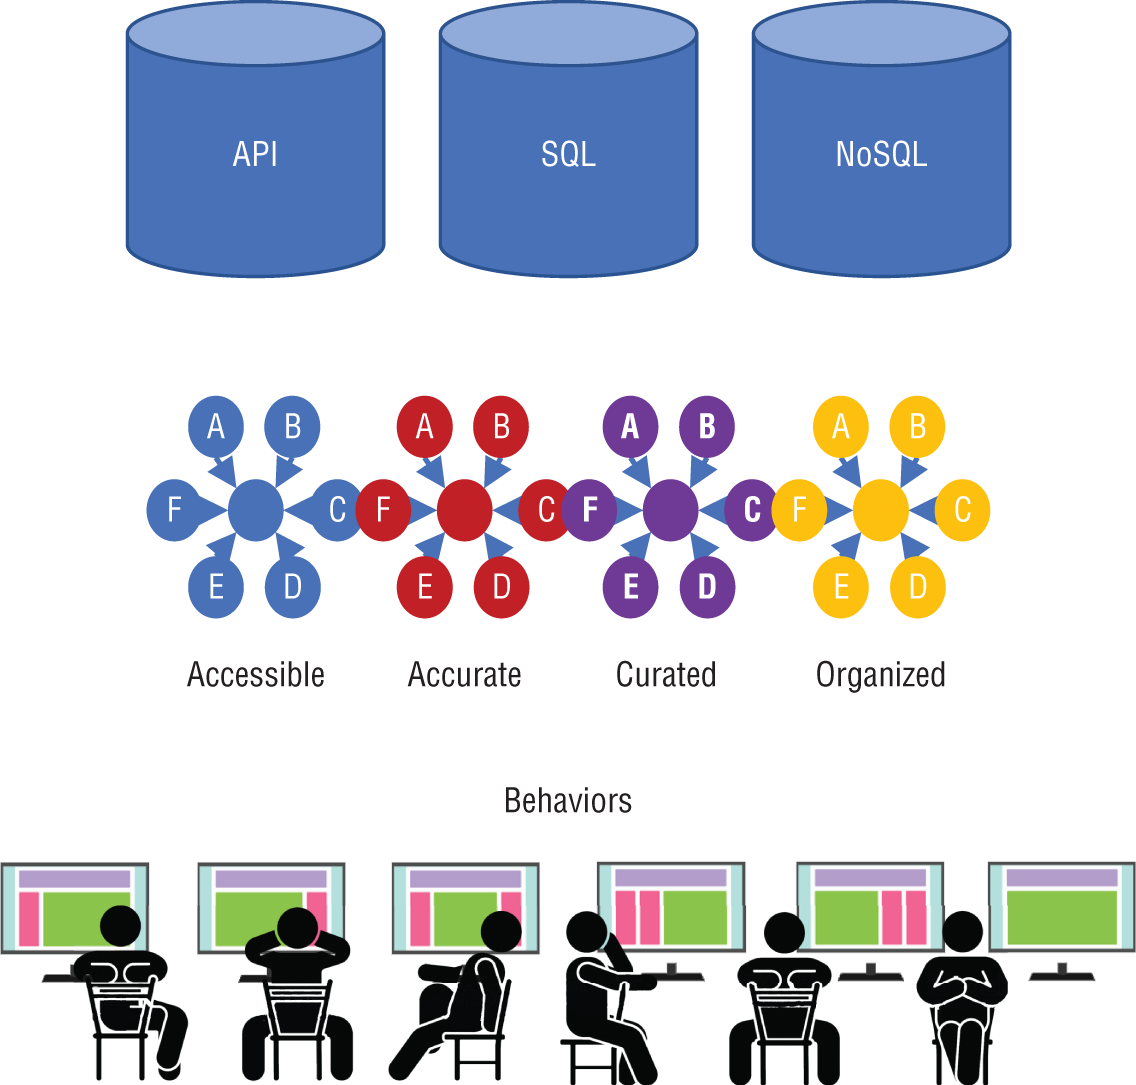
Figure 3-10: Recognizing preconditions
When data is made accessible, accurate, curated, and organized to a business user, the user is better enabled to carry out their job functions with greater effect.
Summary
This chapter covered some of the driving factors that are required for an information architecture to be effective for use with AI. Considerations must be taken into account for the data that goes into a model as well as the data that comes out. These considerations result in both human and machine implications where each human has unique needs as well as each machine having unique needs too.
As all users are not created equal, they don't consistently have the same needs and the same demands. In fact, most people have a specialized function within an organization and may prefer to interact with data using different paradigms: text-based, graphical, with haptic technology, etc. In all cases, the most efficient means to harness information will be contextual to the consumer. Assuming that all user needs are equivalent can be a mistake. To support a cadre of needs, specialized data stores for users and AI should be considered. In fact, hyper-personalized experiences should not exclusively be reserved for customers.
The use of ontologies can help with making AI effective, but building an ontology also benefits from an appropriate information architecture. A well-formed information architecture built on the specialized needs of an organization is likely to provide for completeness of information to users even when questions are asked in a multitude of ways.
Data quality and metadata are imperatives to be realized through an information architecture and to allow for AI to realize its potential to be a transformative tool. Data is inert and is not self-organizing. Data cannot realize any inherent value. These things must come from the information architecture.
In the next chapter, we'll review and critique the environments that have been traditionally built to handle analytics.