Chapter 4
Politics
“You may have all the money, Raymond … but I have all the men with guns.”
— Frank Underwood, vice president of the United States of America in House of Cards
In Expert Political Judgment, Philip Tetlock calls on over two decades of psychology research to argue that those who professionalize “commenting or offering advice on political and economic trends” are no better at making predictions than anyone else.1
His conclusion leaves me with mixed feelings.2
Tetlock's book is encouraging because it means laypeople don't need insights from smoke-filled rooms to make actionable forecasts. Due to experts' forecast inaccuracy, everyone else has high odds of making a comparable prediction. Which means everyone – “experts” included – can improve their predictions by reading my book.
His book is discouraging to me – a forecaster – because it suggests that clients may also be wasting their time with this particular expert!
Yet I find solace in Tetlock's conclusion: the worst forecasters are those who “know one big thing,” who base their forecasts on a singular approach or theory.3 Instead of seeking the right answer, they seek time- and theory-saving ones.
For Tetlock, the high scorers are those who “know many small things (tricks of their trade), are skeptical of grand schemes, see explanation and prediction not as deductive exercises but rather as exercises in flexible ‘ad hocery' that require stitching together diverse sources of information.”4
If accurate forecasts via “ad hocery” is what you want, you came to the right place. There is plenty of it coming up! This book is about to shower you with it!
This book is light on theory and absolutely incapable of the parsimony practiced by those who apply only one theory to seek the truth. Sure, in Chapter 2 I reference plenty of theory: Marx, Machiavelli, social psychologists, and the CIA's intelligence analysis manual. These all form the scaffolding of the constraint framework. But were they really required knowledge to put the framework into practice?
In Chapter 2, I walked through how these theories helped me construct the framework. But now that it is operational, the foundational pillars it rests on matter less. The working framework I detail in this and following chapters encourages the forecaster to maintain discipline; to focus on the observable, material phenomena; and to focus on constraints rather than preferences. Individual preferences are the unreliable narrators of forecasting: misleading and unpredictable. Because they are not observable, they can only be inferred from behavior. And even then, analysts are liable to make the fundamental attribution error and mistake constraint-led behavior for a preference realized.5
As I describe the constraint categories, Tetlock would – I hope – be proud of me. The next five chapters are eclectic in their approach. I favor no single theory or discipline. My “bag of tricks” is very large and holds a variety of social science disciplines.
I first apply Tetlock's suggested “ad hocery” to political constraints. Not all constraints are created equal, and power is the most important constraint – a lesson learned from years of applying the framework. Power is more important than wealth, the economy, markets, geopolitics, demographics, etc. It also dominates individual policymaker preferences, particularly as they cannot pursue their intentions without political capital.
“You May Have All the Money, Raymond …”
One of the best scenes in House of Cards takes place when Frank Underwood, the fictional vice president of the United States, squares off against billionaire tycoon Raymond Tusk. Frank wins, Tusk loses. But as they sit across from one another, Frank utters a gutting takedown:
“You may have all the money, Raymond … but I have all the men with guns.”
Politics is the study of power: a force that compels others to do something they would prefer not to do. Yes, money is an important factor in power, but it is not the only one. The Soviet Union did not need wealth to threaten the US with nuclear annihilation. Power, or political capital, is not just about economics.
Political power is difficult to quantify or – most relevant for investors – compare across economies. It is simpler to compare countries' material power.6 Ambiguity in political capital makes it more difficult to assess, for example, who has greater ability to enact policies: President Trump or President Macron.
For investors, this hard-to-quantify factor matters. Policymakers with ample political capital can expend it on unpopular policies, such as structural reforms. Though painful, these policies tend to have a positive impact on the economy, domestic assets, and the country's currency over the long run. China's one-party system affords it an abundance of such capital, which I examine later in the chapter.
A currency trader in emerging markets needs to be sensitive to such power flexes, as one of few indicators of long-term currency performance is comparative productivity levels. A key factor influencing those levels is whether policymakers pursue productivity-enhancing policies.
It helps to think of structural reforms – or any controversial or unpopular policy – in terms of a “J curve” (Figure 4.1). Whenever politicians pursue such policies, they drain their political capital, writ large. In doing so, they enter the “danger zone”: a moment of truth when the populace may reject the policy. A good example is the 2019 Argentinian election. President Macri thought he had enough political capital to pursue painful reforms, but he could not get out of the danger zone and failed to get reelected.
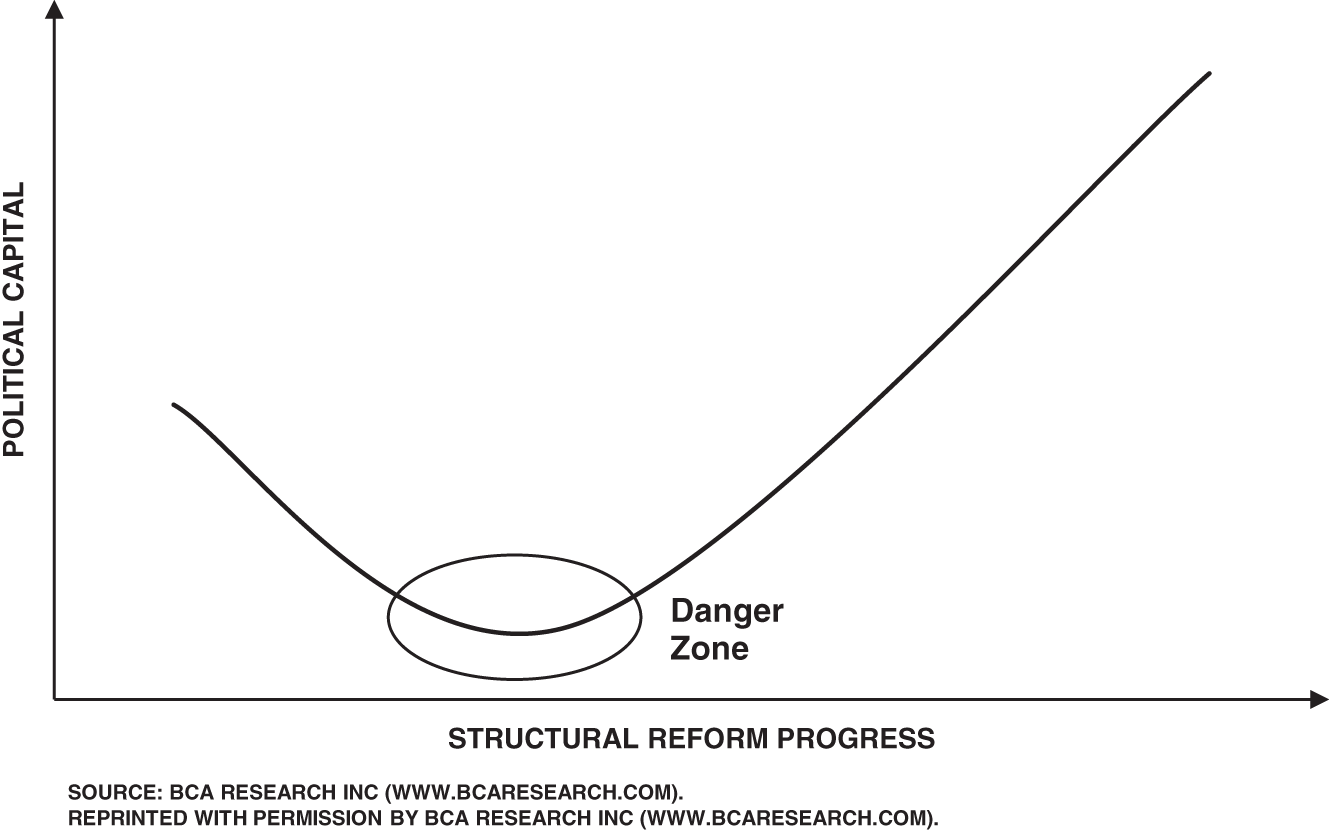
Figure 4.1 The J curve of structural reform.
If investors could gauge the stock of political capital – predict not just when policymakers will wield it but how well-received those decisions will be – they could make actionable calls on where to invest or do business. Can President Macron overcome protests in France in 2020 the way that President Jacques Chirac could not in 1995?7
There is no widely accepted way to measure political capital. Some political scientists have tried to construct a leadership capital index, but it is difficult to operationalize, back test, and apply to market-relevant policies.8
A parsimonious political capital index would have to work across time, place, and political system. Absent this magical one-stop-shop indicator, I use an ad-hoc approach that works just fine. Multiple factors help me gauge political capital:
- Popularity: Policymakers who enjoy public support have political capital in the bank. Even authoritarian and semiauthoritarian states care about popularity: Saudi Arabia – with 50% of the population under 30 – and China – with over 50% of the population in the middle-class income group – are trying to reform. For those regimes, public support is all the more important because a loss of credibility can result in direr consequences than a lost election or lucrative retirement on the speaking circuit.9 President Vladimir Putin made a huge effort to regain political capital in 2014, when the tensions in Ukraine led to a surge in support for his government (Figure 4.2). His 2014 campaign was a (successful) attempt to correct his decades-low popularity.
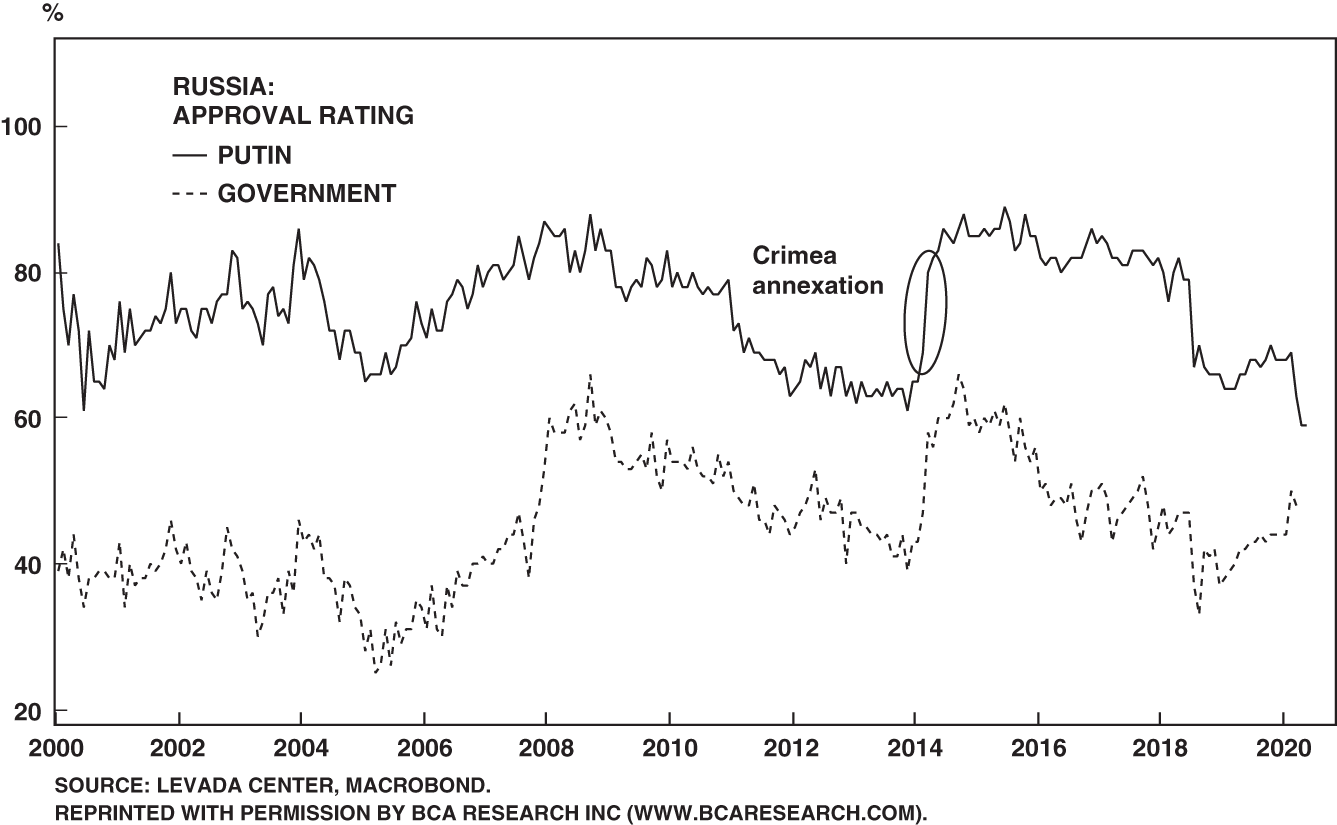
Figure 4.2 President Putin's political capital surged after Crimean annexation.
- Time in power: If leaders are not vigilant, their time spent in power can drag down their popularity. The longer they are the ones to beat, the more opportunity for the public to beat them with social media, votes, protests, or more physical means. Those in it for the long haul can lose credibility and thus political capital. Accordingly, they become risk averse as elections near and as their “mileage” stacks up. In contrast, leaders who have just ascended to power – democratically or otherwise – have the most capital to burn thanks to the “honeymoon period.” This fleeting moment of wedded bliss is the time to pursue unpalatable policies.10 The duration, timing, and power of the honeymoon period vary depending on a government's leadership structure. In a presidential system, where contradictory voices may have equal sway, the president's starter capital depends on legislative math. In a parliamentary system, the head of government often commands the majority in a legislature. For a leader who ascends to power in a coup d'état, the best time to strike is while the opposition is cowed.11
- Legislative math: In democracies, room to maneuver depends on the legislative math. If the head of government does not command a legislative majority, to pass laws at all, she must curry favor with coalition partners and (in a minority government) the opposition.
- Economic context: A good economic crisis may help spur reforms, but it is difficult to see the incumbent ever benefiting.12 In the Argentina example of Chapter 3, the incumbent, President Macri, did not benefit from the economic crisis in Argentina. However, the newly elected President Jair Bolsonaro in neighboring Brazil managed to push through pension reform, in part thanks to the deep recession that began under his discredited predecessors. Similarly, Spanish Prime Minister Mariano Rajoy pushed through aggressive supply-side reforms in the early 2010s thanks to the economic crisis that preceded his election in late 2011. Strong economic tailwinds are beneficial for incumbent political capital, but a crisis can also be positive for new leadership that steps in. When it comes to the economy, the public is a fair-weather friend to whomever is in office at the time.
- Special interest group support: In wielding political capital, powerful special interest groups have a collective action advantage over the broader population. They can eliminate the free-rider problem and bring greater resources to bear.13 As a result, they make for costly opponents of policies not in their best interest. Policymakers who take on difficult reforms or policy need to expend ample political capital to defeat any opposing interest groups.
- Global momentum: Political movements often spread through osmosis, or a “regional contingency factor.”14 During the Third Wave of democratization in the late twentieth century, many countries became democracies. In Latin America, there was a regional pattern to its spread. The reality of global momentum means leaders who pursue globally trending policies will have an easier battle to wage.
… But Boris Has All the Rhetoric
Boris Johnson's conundrum from Chapter 3 reveals some of these political constraints in action. Johnson became the UK prime minister on July 24, 2019. He inherited a shaky coalition with the DUP and a withdrawal agreement that twisted London into a logistical pretzel – urban gymnastics carried out so the coalition could accommodate the small Northern Ireland party. Johnson also faced a surging Brexit Party, which threatened to scuttle the Tories' hold on the center-right electorate.
Johnson's use of tough rhetoric solved the challenge on his right flank. It signaled to hard-core Brexit supporters that he was the right man for the job, and eventually brought them back into the Conservative Party fold. Nonetheless, forecasters only accounted for the first move in the domino effect: Johnson's “I'd rather die in a ditch” rhetoric. As a result of their poorly researched predictions, odds of a no-deal Brexit rose drastically in the betting markets.
How should forecasters have reacted to the 10 Downing Street rhetoric?
An analysis that factored in political constraints would have urged the analyst to ignore Johnson's rhetoric when determining the likelihood of a no-deal Brexit. He could not accomplish his stated preferred outcome due to multiple political constraints:
- Popularity: The public did not support a no-deal Brexit outcome. In fact, some polls suggested that “Bregret” was setting in, with a rising share of the electorate opposing Brexit altogether (Figure 4.3). In August 2019, only 38% of the public saw the no-deal Brexit outcome as “good” or “acceptable.”15
- Time in power: For a caretaker prime minister, it would have been folly to immediately force an unpopular large-scale policy. Tory voters elected Johnson out of a pool of 160,000 members of the Conservative Party – median age: 120 years young.16 His party did not want to move anything too quickly, let alone policy. Unlike a head of government with a fresh mandate, Johnson inherited an already shaky one from Theresa May. As a result, he inherited the time disadvantage of a party that has held power for a while and a disadvantage of a shaky coalition.
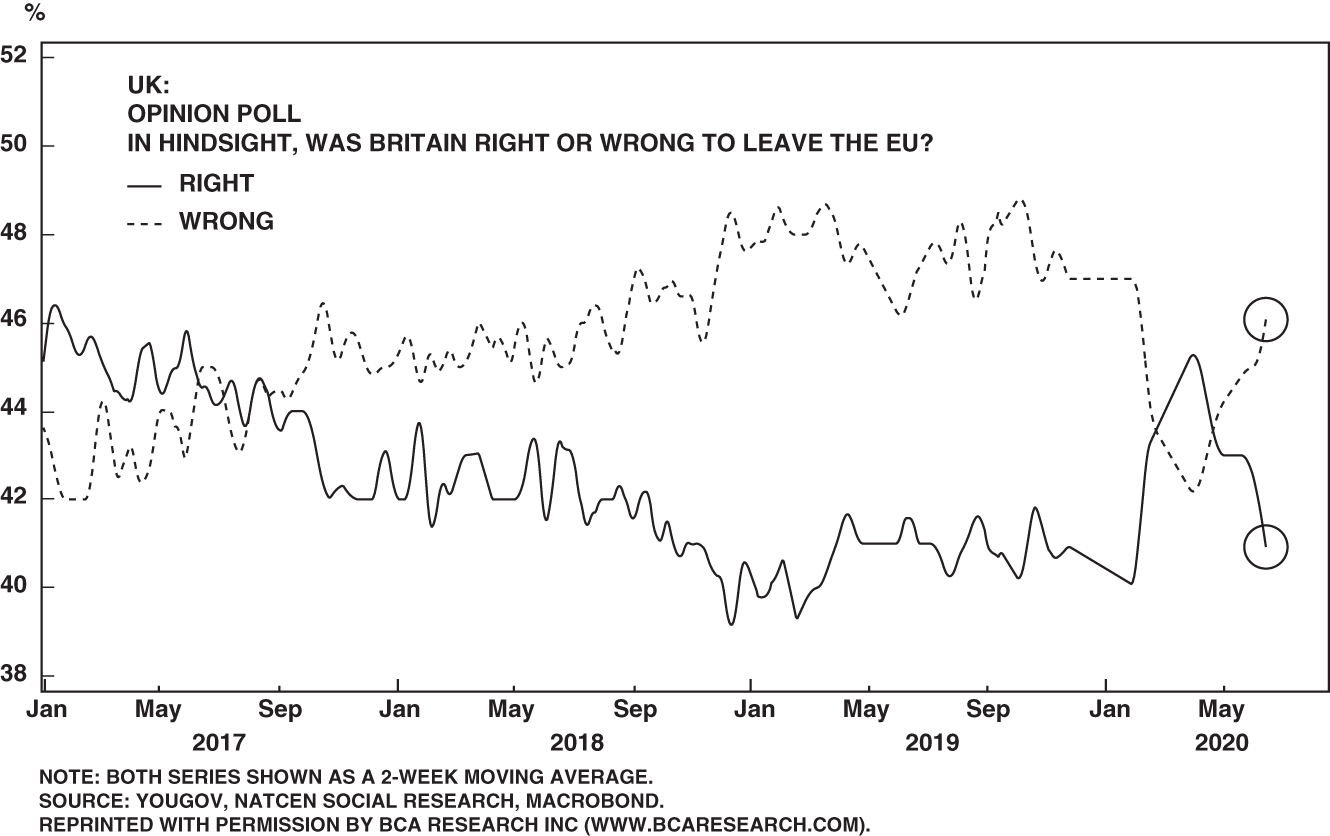
Figure 4.3 “Bregret” was a constraint.
- Economic context: While the economy itself was stable in mid-2019, the British pound had been trading in concert with Brexit negotiations all year. The public had become receptive to the government's own fearmongering related to a no-deal Brexit contingency. The frustrated public would have blamed any negative economic impact squarely on the rookie Johnson administration.
- Legislative math: Legislative majority was the “clincher,” the fulcrum constraint.17 By August 2019, Tories had lost their majority. They were running the country with a minority coalition government – the weakest option in a parliamentary democracy. Out of a peak majority of 327 MPs following the 2017 election (317 Tory, 10 DUP), Johnson was down to just 298 MPs in a 650-seat house.18
Fortunately for Johnson, two political constraints most likely did not limit his actions:
- Special interest group support: Businesses had been vociferous opponents of a no-deal Brexit. Then again, they had opposed Brexit itself, and thus it is not clear to what extent this leaning was relevant to Johnson.
- Global momentum: To the surprise of the British press, no other EU country seriously contemplated exit following the 2016 referendum. Only across the Atlantic pond did it find support in the Trump administration. Would the Trump administration have supported a no-deal Brexit? Probably. Overall, it is not clear whether global momentum had any impact on domestic politics. This factor was a wash.
Johnson faced four main constraints to a no-deal Brexit, some that he himself created by expelling Tory rebels from the party. His no-deal rhetoric therefore makes the most sense in the context of Tory party politics because it presents a plausible rationale for why Johnson might say one thing (no-deal) and do another (soft diplomacy). Political constraints to no-deal Brexit were overwhelming, no matter the preference of Johnson's administration.
Investors should have gone long the pound in the summer of 2019. The return from August 1 to the end of the year was 9%, a significant move for a liquid currency market. Constraints were overwhelming, material, and persistent. No-deal probability was under 10%, most likely much lower.
The ad-hoc method I applied to the Johnson scenario measures political capital in the short term and allows investors to forecast policies over the course of a policymaker's term but not beyond.
There is also a way to measure political constraints in a longer time frame, and it relies on the median voter theorem.
Introducing the Median Voter Theorem
In late 2015, I encountered cognitive dissonance in the financial industry. The Brexit referendum was around the corner, and then-candidate Donald Trump led the polls in the Republican Party primary race. But most of my clients wanted to talk about the 2017 French and Dutch elections. In London, one hedge fund manager flipped through my chart pack and tossed it aside. It was filled with data suggesting that Brexit and Trump odds were higher than the consensus. The manager said, “We have telephone polls that suggest Brexit is highly unlikely. What else ya got?”19
By the end of 2015, Clinton's initial gargantuan polling advantage over Trump had shrunk to the “margin of error,” as had the “Remain” lead over the “Leave” vote for the referendum. Still, investors were too complacent about the two upcoming plebiscites in the US and UK.20
Investors were “traveling with events.” News coverage directed their journey, and it kept up a barrage of the outdated Eurosceptic narrative – while ignoring the populist revolt brewing in the two English-speaking countries.
My alarmist view instead relied on the median voter theorem (MVT).
Developed in the 1950s, MVT is one of the few codified theories of political science.21 It posits that to win an election or stay in power, parties and politicians approximate the policy choices of the median voter. Empirical work since the 1950s has both confirmed and challenged the theory. As such, its proponents in academia have fallen off. But for investing, I find it extremely useful as an approximation of the harder-to-quantify political capital and thus political constraints. Or, at the very least, it puts me on the right path to finding it.
Analysis using MVT requires three main assumptions:
- Voters' preferences are “single-peaked,” meaning voters prefer one policy outcome over all other potential outcomes. This is a tough one. It is not clear that this is true at all.
- Preferences are considered over a single policy dimension. For example, a voter either supports gun legislation or not, or wants a greater or smaller role for the state in the economy. And in each election, the median voter makes a decision on this single policy dimension. It is also difficult to ascertain the validity of this assumption.
- Politicians want to attain, or retain, political capital above everything else, including consistent policy and positive societal outcomes – perhaps the toughest assumption to make of all three.22
As with any theory, the danger of MVT lies in how its application may simplify reality beyond recognition. It posits that, to win and maintain power, policymakers should follow a three-step process:
- Identify the central issue of the day.
- Ascertain the median voter's position on that issue.
- Asymptotically approach the median voter's position, outflanking opponents in the process.
President Trump successfully identified the central issue of the 2016 election: globalization versus economic nationalism. He next ascertained where the American voter stood between those extremes. To the shock of most pundits, the American median voter was far less supportive of globalization (free trade and immigration) than assumed.23 Finally, Trump catered correctly to the median voter's position and won as a result.
Trump's campaign rhetoric against globalization was largely in line with Pat Buchanan's, who challenged the incumbent, George H.W. Bush, in the 1992 Republican primary. Buchanan's loss indicates that the US median voter was shifting toward globalization in 1992. Bill Clinton won the election as a pro-globalization Democrat (albeit with his own brand of populism). Another way to think of the median voter is as the political zeitgeist of the nation. The mild-mannered Buchanan had no chance in 1992, but 24 years later, the uncouth gameshow host did.
Median voter theory is such a powerful tool for predicting outcomes because it forces all policymakers to shift to the median position, lest they become irrelevant political outliers.
Figure 4.4 illustrates the concept. The first panel depicts the precept of the MVT, using the left-right economic dimension as the most salient topic of a particular election (the assumed single dimension). Candidates from the left and the right move to the middle to capture the median voter in a scenario where the median voter is a centrist. In this scenario, the median voter supports a perfect balance between laissez-faire and dirigiste economic models.
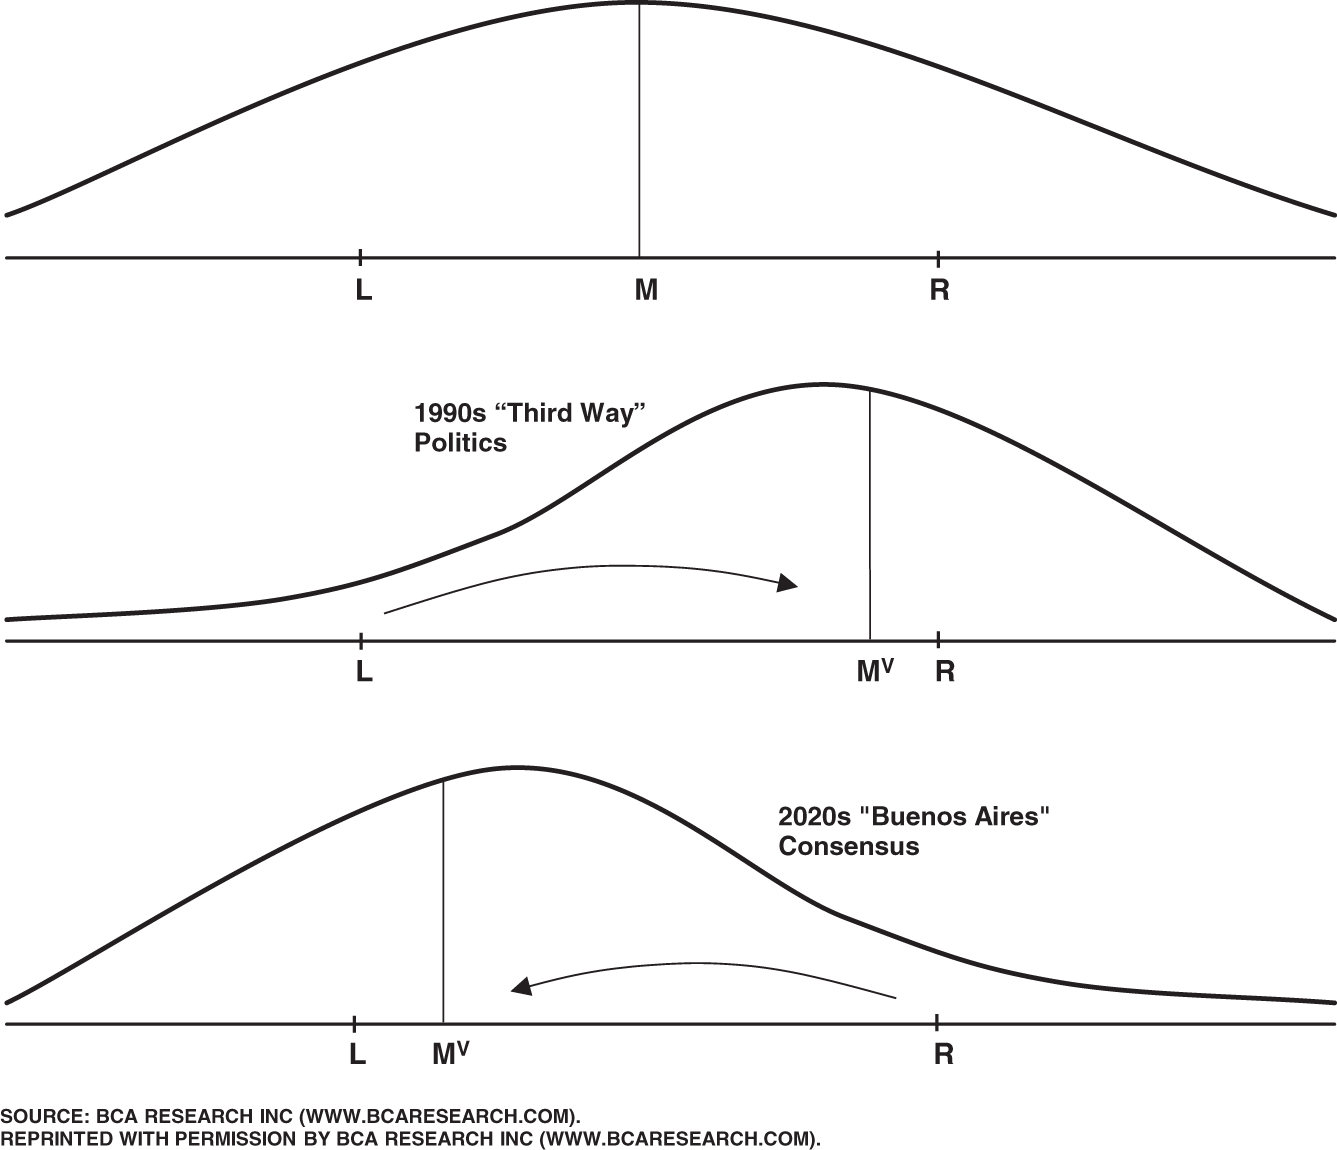
Figure 4.4 Median voter theorem in action.
The second panel shows what likely enabled supply-side policies in the 1990s: the median voter moved right.
Across the political spectrum, left-leaning parties adopted center-right economic policies throughout the late 1980s and 1990s: Bill Clinton's US Democratic Party, Tony Blair's UK Labour Party, Gerhard Schröder's German Social Democratic Party, Paul Keating's Australian Labor Party, Jean Chrétien's Canadian Liberal Party, and Romano Prodi's Italian Democratic Party all traveled right, adopting a more laissez-faire economic outlook. This was referred to as “Third Way” politics.
Even in the emerging markets, a move toward laissez-faire economics and orthodox fiscal and monetary policy followed the ideological consensus of the 1990s; India's economy liberalized in 1991, and Deng Xiaoping's 1992 “Southern Tour” solidified China's pro-market reforms.
The median voter, and policymakers' appeals to her, played a role in the changes listed above. The median voter is a more powerful indicator of market behavior than the individual policymaker's preference. So to forecast policy, focus on the median voter, not the policymaker. If the median voter is shifting her preferences, it means that all parties, not just those in power, will respond and shift toward the median voter.
In 2015, I cautioned my clients that the most radical adherents to the laissez-faire economic model – the US and the UK – were the most at risk of a populist takeover. The US and UK median voter had moved away from laissez-faire capitalism toward something else. In Europe, the median voter was static, if not moving marginally toward the laissez-faire model. Unlike my peers in the financial industry, I did not fret about the French and Dutch elections. But my MVT-grounded analysis predicted that Brexit and the US election were much more likely to be market catalysts.
Predicting the Long-term: Welcome to the Buenos Aires Consensus!
In the 2020 global context of low growth and deflation – and a severe recession thanks to the COVID-19 pandemic – the pendulum of economic policy is swinging to the left. It is surprising to some that the US and the UK have been on the forefront of this global momentum. The deterioration of the middle class combined with the end of the Debt Supercycle has shifted voters to the left in both economies.24 And wherever the voters go, policymakers soon follow.
Even the ostensibly “right-wing” Donald Trump and Boris Johnson.
What tenets of laissez-faire does Donald Trump practice? Fiscal prudence? Free trade? Noninterference in free markets? An independent central bank? I can ask the same questions of the post–David Cameron Tories and receive similarly negative answers, though to a lesser extent.
Policymakers' divergence from traditional conservative party rhetoric suggested that a paradigm shift was afoot, and the fulcrum constraint of the median voter was steering it.25
Another sign of the median voter's leftward influence is the opposition's behavior; the left-wing parties in both countries are not moving to the center to outflank Trump and Johnson. They are betting that the 2020 median voter is much more left of center. They are predicting that the median voter is amenable to experimentation with long-lost demand-driven policies. Enter Bernie Sanders, Elizabeth Warren, and Jeremy Corbyn … from stage left.
Even Joe Biden, who presents himself as a centrist on the campaign trail, is only centrist relative to self-described socialists. But he is running on a tax increase for high-income households and for businesses and on capital gains and dividends. He has also proposed a plan to encourage unionization of the labor force and to include labor protections and environmental standards into all new trade deals (basically a politically correct version of Trump's nationalist protectionism). It is not exactly “democratic socialism,” but it's a bold campaign strategy of tax raises and proworker policies. Eight years ago, pundits would have called it socialism.
The American and British median voter spoke loudly in 2016. As of 2020 in these countries, populist economic policies that diverge from laissez-faire orthodoxy are the median voter's preferred policy setting.26 Pro-market policies are therefore unlikely to emerge from either country. To put it into terms most investors will understand: I am not holding my breath for Paul Ryan to return to politics.27
When historians canonize 2020 decades later, I predict they will blame the erosion of laissez-faire on COVID-19. But by the time the COVID-19 crisis hit, the zeitgeist had already turned. Policymakers and voters were already primed for unorthodoxy. The legislative efficiency of the US fiscal and monetary responses to the pandemic only surprised those without a framework to describe the median voter's economic policy position.
The monetary and fiscal response is diametrically different from the 2008–2009 experience.
In 2009, American legislators took nearly five months to pass fiscal stimulus. The size of the American Recovery and Reinvestment Act (ARRA) was 5.4% of the 2009 GDP. It passed the Senate with only three votes by the opposition party – the Republicans. In the House, not a single Republican voted for the bill. In total, 214 Republicans in Congress voted against the bill.
Lack of bipartisanship in 2009 is not merely a piece of political trivia. If you were an investor following the policy response in 2009, the strict party-line vote on ARRA was a crucial piece of information. It suggested that no future stimulus bills would be forthcoming, given the level of rancor that ARRA produced.
Eleven years later, with the median American now openly contemplating policies that would have been deemed “socialist” in the past, the zeitgeist is dramatically different. The Coronavirus Aid, Relief, and Economic Security Act (CARES Act) started off as a $1 trillion Republican proposal on March 18 and doubled in size a week later. It was conceived, passed, and doubled in size faster than anyone thought possible.
Not only is the size of CARES more than double that of ARRA – 11.2% of 2019 GDP – but it was passed with no votes in opposition. The Senate passed the bill with a 96–0 majority. The House passed it with a voice vote; in the process, the sole dissenter – Representative Thomas Massie of Kentucky – endured a modern version of tar-and-feathering from all corners, including President Trump.
In the short-term, confounding policy variables obscure voter median preferences. Governing coalitions, gerrymandered electoral results, and policy prerogatives of individual parties all mask the long-term influence of the median voter. President Trump, for example, won his election by appealing to the long-term median voter preference. He ran on an anti-trade, anti-establishment platform. However, his only substantive legislative accomplishment by February 2020 was a pro-corporate, conservative tax cut. And the cut did not align with median voter preferences.
The tax cut, passed in December 2017, proved to be a disastrous electoral pitch for the GOP in the November 2018 midterm elections, just as MVT would have predicted. Republican congressional candidates running for re-election ditched the tax cut talking point in 2018 as they faced angry constituents across the country. The aforementioned Paul Ryan saw the writing on the wall and quit while he was ahead.
The episode illustrates how MVT allows for policy to deviate from the median voter in the short term, but not in the long term. The American voter is on a journey of a major ideological pendulum swing. But it is unclear whether this switch will spur global momentum in the same direction. The US continues to stand out negatively on measures of income inequality and social mobility (Figure 4.5) as well as on measures of “middle class as percent of population” (Figure 4.6).
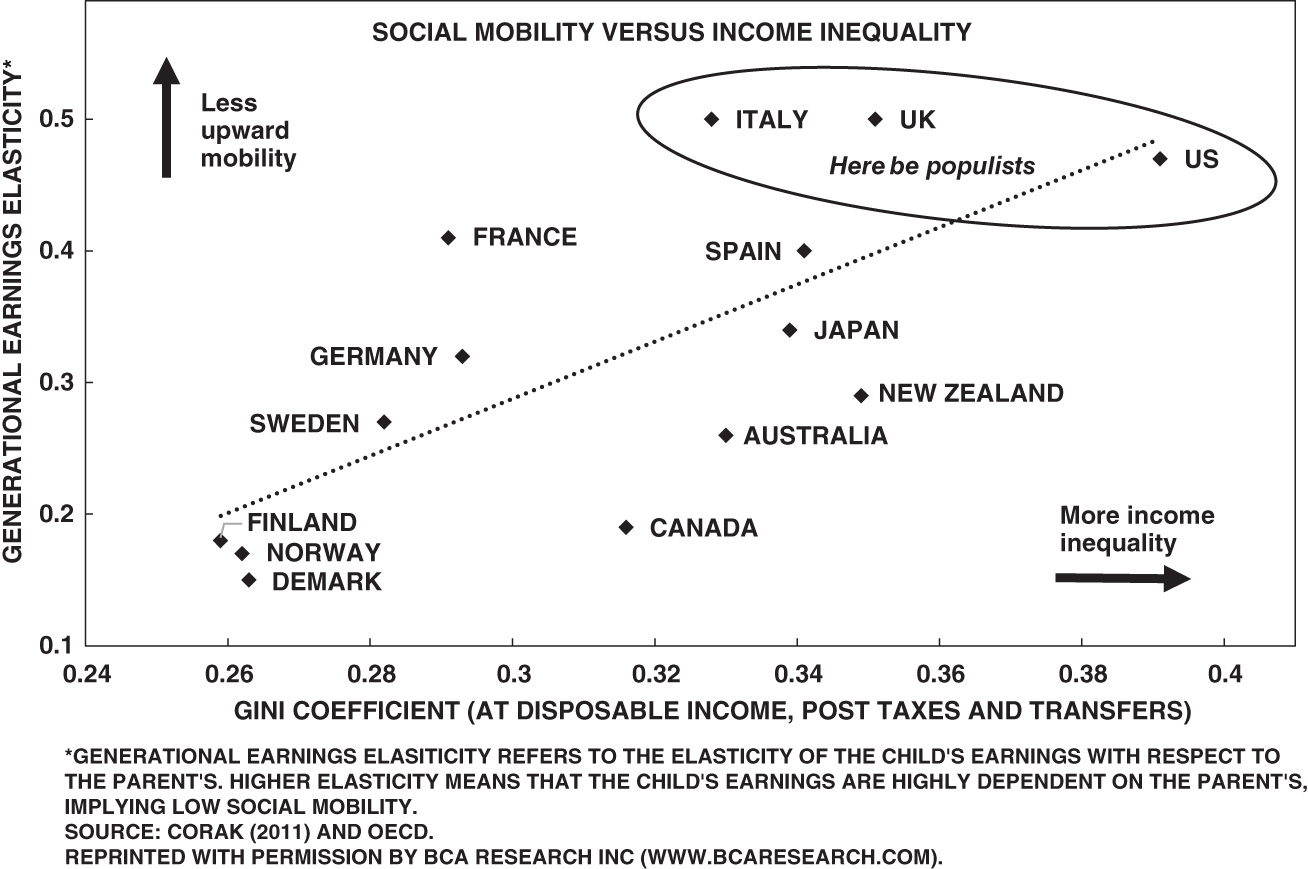
Figure 4.5 The US is an outlier in measures of inequality and social mobility.

Figure 4.6 The US is an outlier in measures of the middle class.
For investors, these metrics mean that even if the US sees a return of President Trump for a second term, the era when Americans embrace laissez-faire policies relative to the rest of the world is over. President Trump's 2016 election, Bernie Sanders' and Elizabeth Warren's candidacies, and a bevy of policies pursued by the Trump administration all indicate that policymakers respond to the median voter. And the US median voter demands dirigiste, left-leaning, demand-driven policies across the ideological divide. Sure, Republicans and Democrats will continue to fight over noneconomic, deliberately polarized issues such as abortion, gun control, climate change, Russia, racial inequality, and President Trump's conduct. But their adoption of unorthodox fiscal and monetary policies is bipartisan, as their response to the COVID-19 calamity attests.
As I write in Q1 2020, there is also the question of how policymakers will respond to the COVID-19-induced recession. I predict the left-moving median voter will be the fulcrum constraint limiting policymakers' response options. Even with nearly 15% of GDP committed to various stimulative measures, I believe that investors should err on the side of expecting greater government intervention in the economy, broadly defined – not just regarding the COVID-19 pandemic, but also in other future contexts.
(And as I sit here in late June, making final edits to this manuscript, the markets are again fretting over whether the CARES Act will be extended with new stimulus. It shows me that investors have still not realized the dramatic change in the reaction function of policymakers. The median voter has spoken. There is no political opposition to further stimulus. As such, I would expect an additional $1.5-$3 trillion in stimulus – both replenishing the expiring provisions of the CARES Act and a potential infrastructure bill – by the end of 2020, taking the US budget deficit to as high as 30% of GDP.)
Even if the COVID-19 recession is sharp but brief, as I have expected it to be from its beginning, policymakers will fight to the last man and respond like it is 2008. President Trump was elected in 2016 with unemployment at 4.7%, a fairly low figure, and American voters chose a TV gameshow host as a president because they were still angry about income inequality, globalization, and an anemic economic recovery. Neither Trump nor his opponents will wait around to see who the American public elects in 2024. Instead, they will try to get ahead by introducing a steady stream of ever more unorthodox policies to stimulate the economy.
I have dubbed this move away from laissez-faire policies of the Washington Consensus the Buenos Aires Consensus. The Washington Consensus is merely a catchall term for the policies that have defined the 1980-2010s era. The “Washington” in the term stands for Washington DC, the city where the two institutions most responsible for propagating its policy recommendations – the World Bank and the IMF – are headquartered. The consensus was defined by a set of policies that sought to remove democracy from economic policy. Independent central banking, counter-cyclical fiscal policy, laissez-faire regulatory framework… all of these policies have a singular point in common: they remove the role of elected officials from economic policy.
Now, don't take me wrong. I say this in as normatively neutral way as I can. You wouldn't fly an airplane democratically, so why would you operate a central bank or fiscal policy with input from voters? Nonetheless, in the most enthusiastic adherents to the Washington Consensus – the US and the UK – the political pendulum is swinging back toward populism. Democracy is finding its way back into economic policy.
So why Buenos Aires? What does Argentina have to do with this populist backlash? Nothing other than that it has been beset with decades of populist policymaking. And after its latest plunge back into populism following the 2019 election, what better city to replace Washington for our new catchall term than Buenos Aires?
The downside of the populist “growth above all else” mentality that the Buenos Aires Consensus represents is that the US is likely to move further to the left on almost all economic dimensions. The net actions of American policymakers reflect the economic preference of the American median voter. If post-2016 policy shifts continue into 2020 and beyond, the US could be the first mover to spur global momentum away from laissez-faire policies (Figure 4.7) – a transition away from the Washington Consensus toward a Buenos Aires Consensus. Such a shift would impact a wide swath of policies.
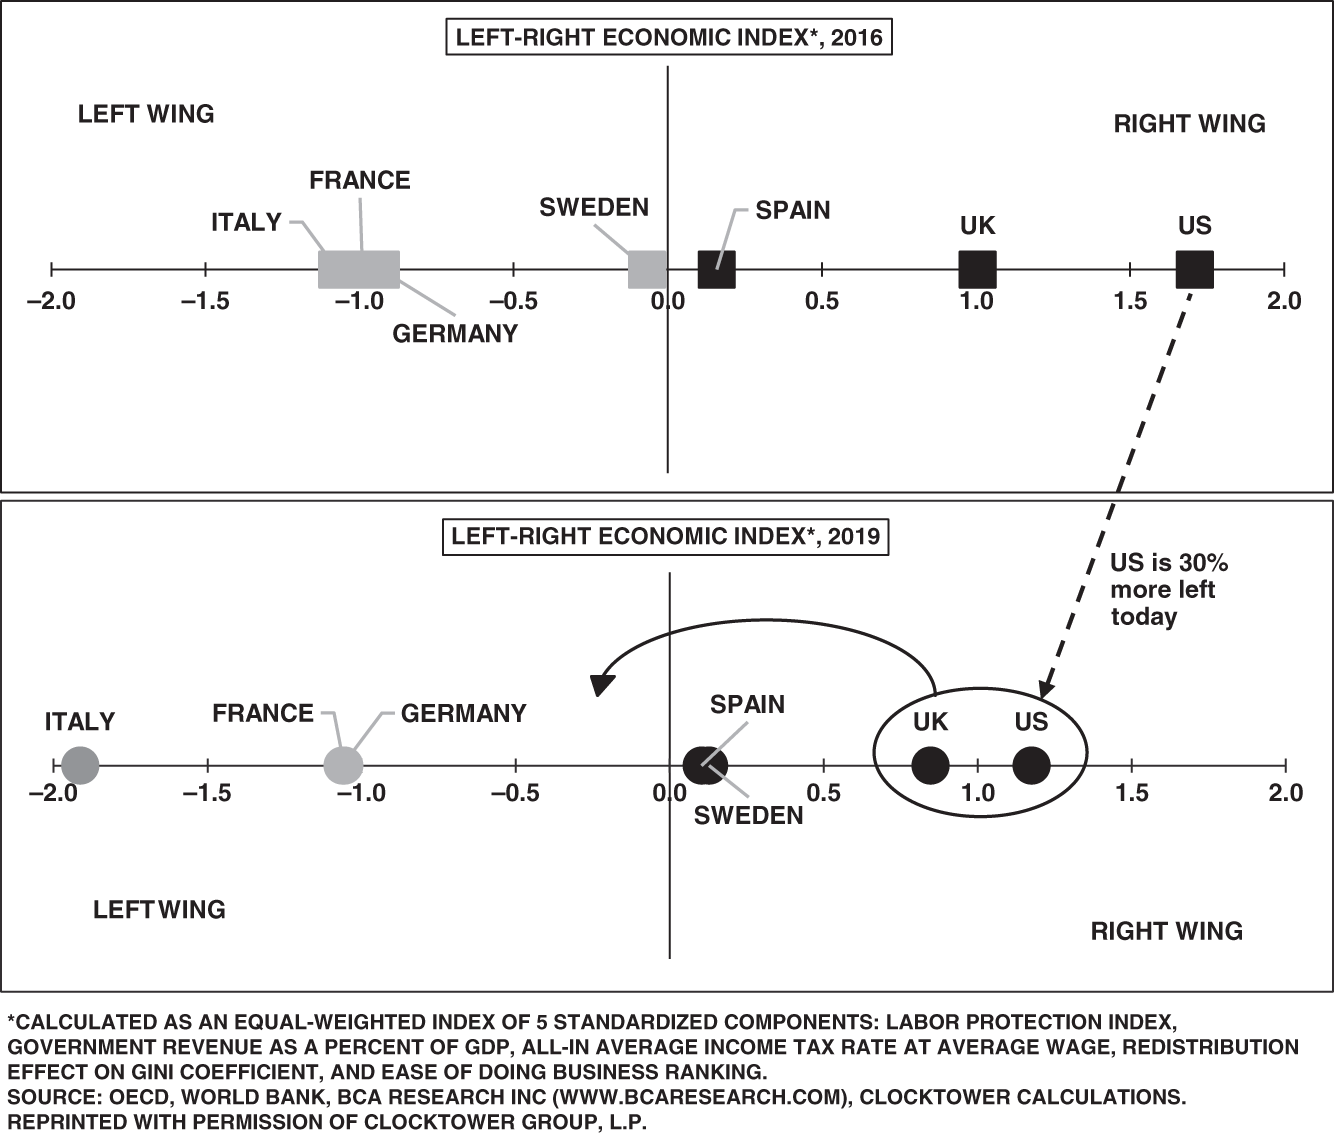
Figure 4.7 The coming Buenos Aires Consensus.
Over the next decade, I would expect more unorthodox fiscal and monetary policy, an increase in antitrust cases, further fiscal easing, selective regulatory pressures, and higher taxes on both capital gains and high-income taxpayers. If you're fretting about the extraordinary fiscal cliff coming up in 2021, don't. Policymakers will assuage it with even more fiscal stimulus.
The transition from the Washington to Buenos Aires Consensus will dominate markets over the next decade. This transition is more relevant than the US-China geopolitical rivalry, risks to European integration, and technological change. All assets will be influenced by the deluge of fiscal and monetary policy.
Such a leftward move will sound the death knell for the US equity market's cyclical outperformance relative to the rest of the world. With US profit margins and valuations at historical highs, long-term investors should probably begin underweighting US assets on a multiyear horizon. The dollar has probably peaked in 2020 with a long-term decline ahead. This will especially be the case if the COVID-19 recession ends up being brutal but brief, as investors are starting to realize is the case. Once the recession is over, the immense amount of stimulus sloshing around the US economy will likely flee to other equity markets as investors seek returns in economies that are not printing their way to growth. While I would remain bullish on US equities in absolute terms, I'd use the “churn” of 2020 to reposition to European, Japanese, and EM equities on a decade-long strategic asset allocation.
The above paragraph would be my forecast and advice to investors no matter who wins the 2020 election. The median voter is the price maker in the political marketplace; in the long-term, politicians are mere price takers.
MVT in a Vote-less Nation: Does China Have a Median Voter?
The MVT is a great framework with which to gauge the long-term trajectory of policies. But is it limited to democracies?
It depends. In assessing the policies of North Korean ruler Kim Jong-un, MVT is useless. However, it makes strange sense for a nondemocratically elected leader to pay attention to the preference of his median … citizen.
The collapse of the Soviet Union in 1991 jarred Chinese policymakers; if the Soviet Union could fall apart, so could China. And officials knew if this thought had occurred to them, it had also occurred to the Chinese median citizen.
China circa 1991 had only partly adopted pro-market reforms and opening up – it withdrew back into its communist shell after Tiananmen Square. The precarious situation drove the Chinese Communist Party (CCP) to rethink its approach to domestic governance, ideology, economic development, and foreign policy. While there were initially many different voices within the party, the neoconservative faction eventually won out.
Party members published their views in the China Youth Daily, a newspaper associated with the China Communist Youth League – a CCP ruling faction. Titled “Strategic Choices and Practical Responses After the Collapse of the Soviet Union,” the manifesto identified the party's biggest threat as its own self-ignorance.28 The paper argued that the CCP's failure to properly transform from a revolutionary party to a ruling one led to such disasters as the Great Leap Forward and the Cultural Revolution. In light of the disintegration of the USSR, the most urgent task was to carry out gradual, constructive reforms to ensure social stability and higher economic productivity.
Several years later, the CCP General Secretary Jiang Zemin summarized the party's secondhand historical experience with his theory of “the Three Represents:”
- The party should represent the advanced productive forces in society.
- The party should represent advanced modern culture.
- The party should represent the interests of the vast majority of the people [emphasis added].29
The Three Represents are an attempt to asymptotically approach the position of the Chinese median citizen with the intention of avoiding the fate of the Soviet Union.
As Figure 4.8 depicts, China's 2018 GDP growth relative to its level of wealth leaves it vulnerable to falling into the dreaded middle-income trap.30 Most Latin American countries whose growth rates slowed in the 1970s did not last as authoritarian regimes. Neither did the Soviet Union, whose GDP-per-capita growth stalled in the 1970s. Informed by the history of these countries and their experiences, CCP leadership understands that if China falls into the middle-income trap, it will likely meet the same fate. So officials are executing preventative measures.
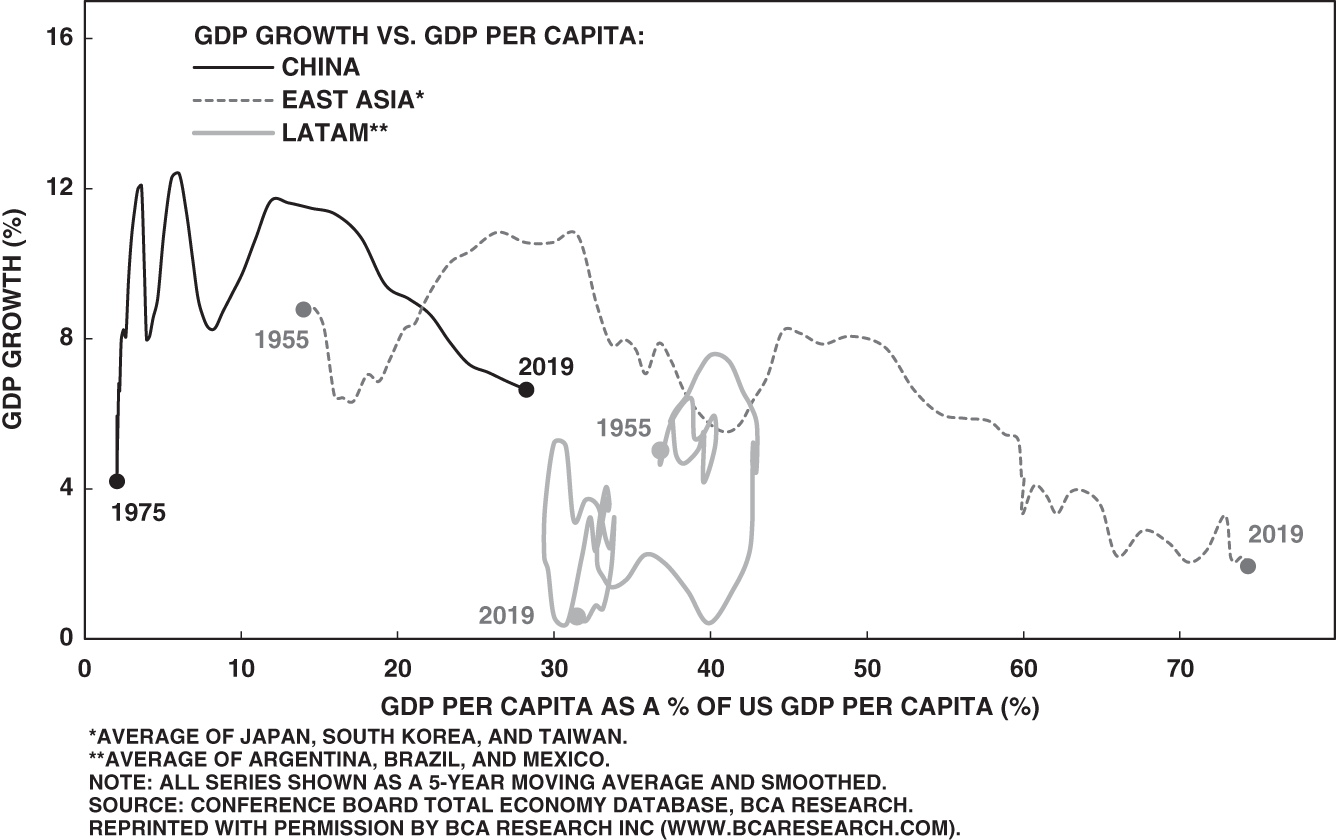
Figure 4.8 The dreaded middle-income trap.
Since 2017, Chinese policymakers have undertaken a set of painful structural reforms. At a time when the developed world is moving toward the Buenos Aires Consensus – a fancy way of saying populism – Beijing has enacted financial and macroprudential reforms that constrain growth. It is cracking down on both provinces' ability to raise independent sources of revenue and shadow banking, which greased the wheels of profligacy. Even China's response to the COVID-19 pandemic has been conservative compared to the orgy of stimulus coming out of Europe and the US.
These reforms suggest that China's policymakers believe the best way to safeguard continued growth – especially in the face of China's demographic disadvantages – is to boost productivity. To do so, China streamlined capital allocation, ensuring that private enterprises take priority over unproductive state-owned enterprises in terms of access to capital.
Whether this effort survives beyond 2020 is a litmus test of policymakers' understanding of their constraints – that the Chinese median citizen can hold their political capital hostage and would prefer not to be hung out to dry during a global recession. To retain power, policymakers will eventually have to abandon painful reforms to stimulate in the face of the COVID-19 pandemic. However, at the time of writing, they have remained stubbornly committed to ensuring that real estate prices do not rise.
Why? Beijing is once again taking advantage of its abundance of short-term political capital for long-term gain. Although real estate stimulus is the most efficient way to jumpstart the economy, if Xi Jinping permitted real estate prices to rise in middle-class-laden coastal cities, it would create a longer-term political risk. The prices could lead a large, vocal populace to form opposition against the one-party government. The entire scenario may devolve into protests akin to those in Hong Kong.31 Policymakers in China continue to emphasize Xi's mantra that “housing is for living, not speculation,” potentially to the detriment of a fast recovery.
Concern over the median citizen's view also drove the Xi administration to enact sweeping anticorruption policies, curb pollution with draconian measures, and change the one-child policy and Hukou residency registration system.32
These measures indicate that Chinese leaders understand China's precarious position. The Chinese middle class makes up such a large portion of the population, and it is only growing. As of 2017, the middle class made up over 50% of the population (Figure 4.9), with wealth levels already above those of South Korea and Taiwan when they transitioned away from authoritarian rule (Figure 4.10). Because votes and polling are not options, the closest representation of the Chinese median citizen is popular middle-class support.
This popular support is a reliable predictor of China's future policies, so forecasters can treat it as a key constraint when forecasting Chinese government behavior. If policymakers were completely unconstrained by the middle class, they would simply stimulate the economy at every turn. They would have had little motivation or pressure to enact the 2017–2020 self-imposed slowdown.
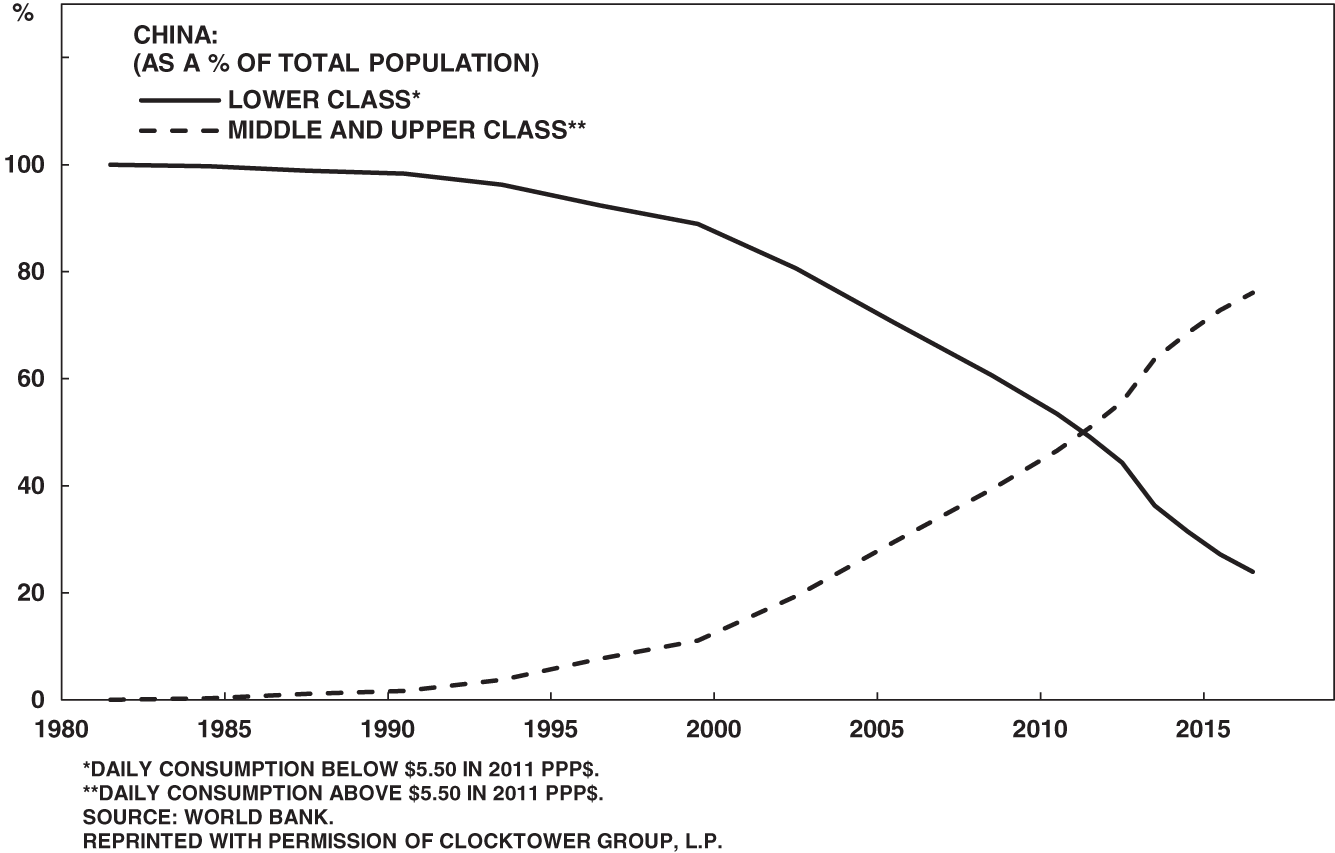
Figure 4.9 China is at a critical middle-class threshold.
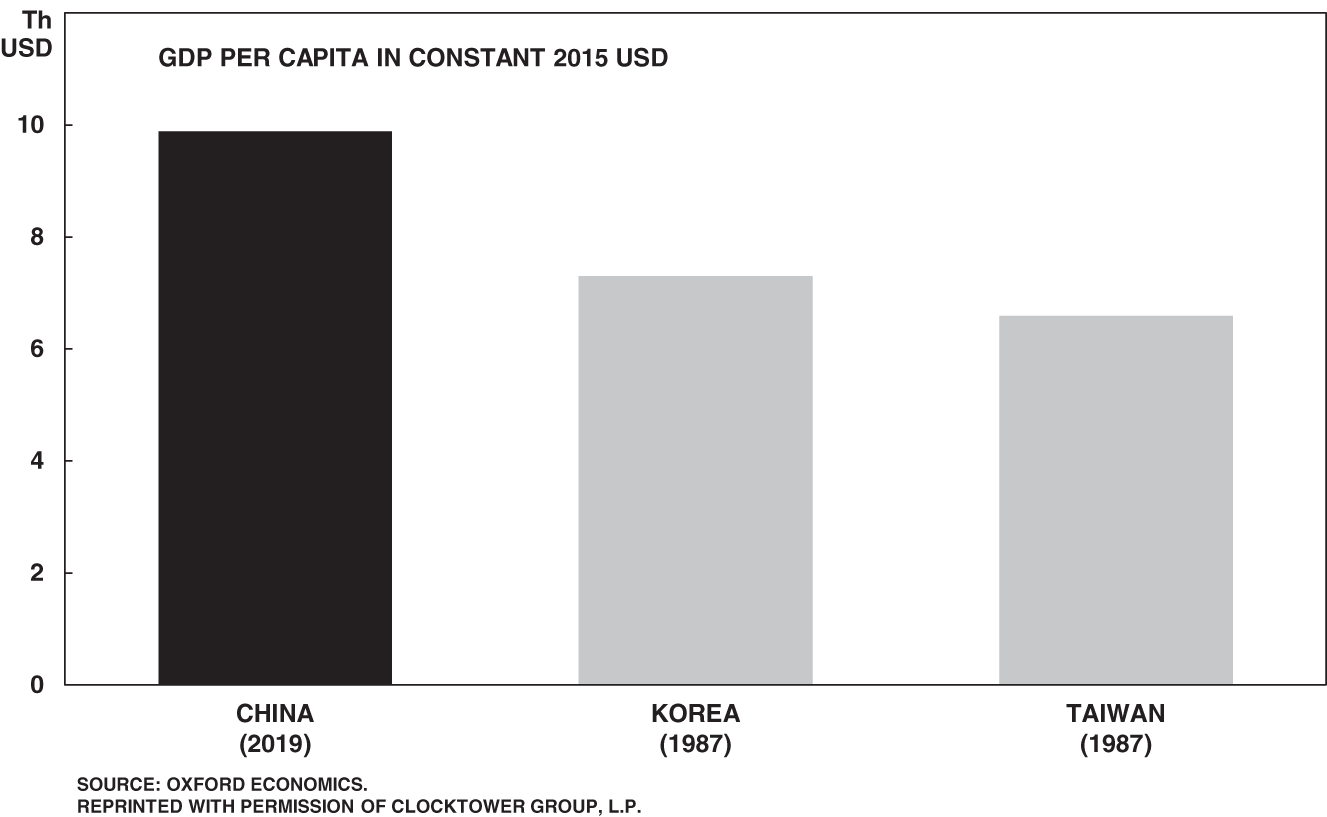
Figure 4.10 Chinese coastal provinces are already ripe for democracy.
There is one tenet of the MVT that does not apply to China: short-term competition. It is a good self-preservation measure for Chinese policymakers to respond to their “voters,” but they need not worry that an opposing party will outmaneuver them. Beijing has to satisfy its citizens' demands for clean air and honest officials, but there is no political alternative waiting in the wings who will offer even cleaner air and even more honesty.
The absence of short-term competition provides Chinese leaders with the luxury of time to enact policies that are sometimes painful at first but that have long-term rewards; they are less subject to the “time-in-power” constraint.
But China's resilience only lasts up to a point. If the entire system collapses, all bets are off. As long as the CCP is in charge, it can tinker with painful policies more easily than an ineffective democracy can – though its path to policy reform is much more difficult than that of an effective democracy.
Wealth levels matter in the creation of an effective democracy. If I measure the effectiveness of democracy using Freedom House scores, where 1 represents the most effective democracy and 7 the least, there is a noticeable relationship between wealth levels and the quality of democracy (Figure 4.11).
But Figure 4.11 is not a positive for China. The chart does not presume causality. With a GDP per capita of just under $10,000 – and with many of its large, coastal provinces well beyond that – China appears to be right below the level where most effective democracies find themselves. This suggests that there are soon to be bottom-up pressures for greater political representation, particularly if policymakers lose credibility due to an economic, financial, or pandemic crisis.

Figure 4.11 Wealth supports effective democracy.
For Chinese policymakers, the 2020s are critical. China is undergoing structural reforms to further liberalize its economy. But it is, at the same time, consolidating more power in Beijing at the expense of the provinces. While to the global West, political centralization and economic liberalization are unpalatable – and even illogical – this combination is familiar to academia. Samuel Huntington's 1968 Political Order in Changing Societies warns against too-rapid political liberalization amid economic and social modernity because it could lead to collapse.
Given their nondemocratic structure, Chinese policymakers have more leeway when it comes to the political constraints of popularity and time in power, but not much. The days of the Cultural Revolution and the Great Leap Forward are gone. The rhetoric remains, but CCP leadership is far more wedded to the demands of its citizenry than Western commentators depict.
The greatest threat to Beijing's continued rule is that the more it centralizes power, the more it will lose a convenient scapegoat for policy mistakes: the provinces. The central government has blamed economic mismanagement, corruption, pollution, and even the COVID-19 response on provincial officials. As the central government increases its share of Chinese power, it will no longer be able to “pass the buck” to provincial officials.
If China's burgeoning and demanding middle class is a political constraint as of 2020, how will Beijing prioritize its competition with the US? An analysis using the constraint framework predicts an unexciting and out-of-consensus view. Just as post-1980s NBA fights are no longer quite as exciting … because they no longer occur … China's middle class will force China away from geopolitical excitement. It will retreat inward and back off from its competition with the US.
Evidence from throughout 2019 and 2020 indicates the middle class is already holding Beijing back from engaging the US aggressively. China stayed its hand during the Hong Kong protests, refusing to crack down harshly on the student protests. Beijing nominally kept its hands clean by allowing local law enforcement to deal with the unrest. Abroad, Beijing signaled a retreat from competition with the US when it agreed to the Phase One deal – a capitulation, considering the terms allow the White House to keep most of the tariffs on Chinese exports. Since President Trump came to power, China has also avoided confrontations with the US military in the South China Sea. Incidents continued to happen, but on the margin and with lower frequency than under President Obama.
China's actions suggest President Trump hit China where it hurts: wealth generation, particularly among the middle class. And Beijing relented because keeping its middle class happy takes precedence over world domination. The Three Represents are still in place, but none have anything to do with Maoism or making China a global hegemon.
Of course, China wants to dominate East Asia and expand its global influence. But delivering economic growth to its middle class is the main priority because it is Beijing's constraint to action on any scale. Anything that impedes Beijing's ability to provide for the middle class – including a bid to challenge the US as a global hegemon – comes second.
The constraints that the Chinese median citizen places on policymaker actions means there is a limit to how far China will push against the US. As long as economic growth, productivity growth, and escaping the middle-income trap remain the central goals in Beijing, there will be limits to Chinese expansionism.
Ironically, that also means that the greatest risk to global order and peace is American miscalculation of Chinese intentions, not actual Chinese aggression. My constraint-based framework suggests that Beijing is far more constrained than US policymakers seem to think. Chinese leaders are worried about their growth trajectory and the sustainability of a move up the value curve. If the US pushes Beijing too hard on trade and the economy, it will threaten the primary directive for China: escaping the middle-income trap. And that is when Beijing would have to respond with aggression.
Political Constraints: Takeaway
Political constraints are correlated with who has the most power, so they are the starting point for geopolitical forecasting. It is the least glamorous but also the most restrictive – and hence telling – constraint. To determine a situation's political constraints, a forecaster need not analyze bond yields and credit default swap (CDS) prices, make an order-of-battle comparison of two hostile militaries, or study history and geopolitics. It is domestic politics that determines the policymakers' maneuvering room, whether in an international or interparty conflict.
The concepts of political capital and the median voter help extract the motivating political constraints behind domestic policies. Political capital is difficult to measure, as it relies on an ad-hoc approach. Rather than a grand theory, it is contextual, and the careful forecaster applies it case by case. Its lack of uniformity in measure means it falls short in comparative study – for the time being. I hope in the near future, someone can offer a back-tested, actionable, political capital index that works across time and space.
In contrast to political capital, the MVT is more quantifiable, and therefore a more comfortable concept for those in finance to work with. In many contexts, the median voter's preference serves as a useful, more manageable proxy for political capital. It tells analysts to focus on the median voter when contemplating long-term policy trajectories of a country.
The median voter is the price maker in the political marketplace. Politicians are price takers.
Notes
- 1 Philip Tetlock, Expert Political Judgment (Princeton, NJ: Princeton University Press, 2005), 239.
- 2 Tetlock's book is a must-read for anyone who deals with forecasts for a living. I do have one critique: instead of studying professional political forecasters – those who work in the private sector making bets on geopolitical events for a living – he picked 284 media personalities, think tankers, journalists, and academics. I have never read a piece of news, op-ed, academic study, or think-tank analysis expecting to find a good forecast. His sample is skewed. Not to mention that his favorite whipping boy – The McLaughlin Group – is a debate show meant for entertainment (and unfamiliar to anyone under the age of 75). I don't doubt Tetlock's conclusions, but I wish he would not use the term “expert” so liberally.
- 3 Tetlock, Expert Political Judgment, 73.
- 4 Ibid.
- 5 Chapter 2 memory refresh: the fundamental attribution error is “a mistake analysts make when they attribute real-world outcomes to characteristics, personality, and moods of individual actors.”
- 6 In Chapter 9, I elaborate on why such a one-dimensional comparison is dangerous.
- 7 Yes.
- 8 Mark Bennister et al., “Leadership Capital: Measuring the Dynamics of Leadership,” SSRN Electric Journal, December 15, 2013, https://papers.ssrn.com/sol3/papers.cfm?abstract_id=2510241.
- 9 One advantage democracy has over more centralized governments is its tendency toward bloodless transitions of power.
- 10 A 2019 IMF study showed that “reforms undertaken earlier in an incumbent's term do not affect election prospects.”
Gabriele Ciminelli et al., The Political Costs of Reforms: Fear or Reality? (Washington, DC: International Monetary Fund, 2019).
- 11 And in jail … or worse.
- 12 “Making Reform Happen: Structural Priorities in Times of Crisis,” OECD, May 2010, https://community.oecd.org/docs/DOC-18533.
- 13 Mancur Olson, The Logic of Collective Action: Public Goods and the Theory of Groups (Cambridge, MA: Harvard University Press, 1965).
- 14 Samuel P. Huntington, The Third Wave: Democratization in the Late Twentieth Century (Norman: University of Oklahoma Press, 1991).
- 15 Matthew Smith, “By 48% to 35% Britons Would Rather Have No Deal and No Corbyn,” YouGov, August 17, 2019, https://yougov.co.uk/topics/politics/articles-reports/2019/08/17/48-35-britons-would-rather-have-no-deal-and-no-cor.
- 16 Approximately.
- 17 When a constraint is so powerful that it bends all other factors to it, I refer to it as a “fulcrum.” It is the one constraint that forecasters should keep an eye on because if it changes at all, the entire analysis may have to pivot. It is, in Heuer's terminology, the most diagnostic of all variables.
- 18 The Tory majority collapsed because Johnson himself moved to “remove the whip” – essentially expel – 21 “rebel” Tories for voting in favor of a bill that sought further delay to the then–Article 50 deadline.
- 19 Full disclosure: I did not correctly forecast either Brexit or Trump. However, I assigned both events higher-than-consensus probabilities, which is all investors need to know to generate geopolitical alpha. In a November 1, 2016 analysis for BCA Research (available upon request) I assigned Donald Trump ∼40% odds of winning the election. This was higher than 29% that Nate Silver's (excellent) FiveThirtyEight gave Trump, 15% that the New York Time's Upshot assigned, 7% of the Princeton Election Consortium, or – wait for it – 2% that the HuffPost thought were Trump's odds. See Chapter 11 for more on the crucial concept of geopolitical alpha that gives this book its title.
- 20 Granted, investors had good reason to direct their attention toward the Netherlands – not so much France. The populist Party for Freedom (PVV) in the Dutch election had a large lead, but the election was over a year away, and the European migration crisis was unsustainable. Ultimately, the theory that the migration crisis was giving the PVV strong tailwinds proved correct. Once the migration crisis abated, so did PVV support. Further south, French populist Marine Le Pen was polling terribly. Forecasts massively overstated her election odds. The call to go long euro ahead of the 2017 French election was one of the most fitting examples of geopolitical alpha I've ever experienced in my career. It is described in detail in Chapter 11.
- 21 Don't tell any poli-sci friends, but it was actually economist Harold Hotelling who first posited the MVT in his 1929 article “Stability in Competition.” His passing comment in an article otherwise focused on business decision-making remains prescient almost a century later.
Harold Hotelling, “Stability in Competition,” Economic Journal 39 (1929): 41–57.
For an account of subsequent treatments of the concept in political science, see Duncan Black, “On the Rationale of Group Decision-making,” Journal of Political Economy 56 (1948): 23–34; and Anthony Downs, An Economic Theory of Democracy (New York: Harper Collins, 1957).
- 22 Just kidding!
- 23 The Leave campaign in the UK confirmed the same realization: at the time of the referendum, the median voter was far less supportive of EU membership than previously thought.
- 24 For decades, the Debt Supercycle allowed households to supplement their stagnant real incomes with credit until its end in 2010.
- 25 As to why the median voter moved away from traditional right-wing policy: perhaps laissez-faire policies are not optimal in this brave new world of secular stagnation, deflation, and a COVID-19-induced recession. Although, I think that the shift in the median voter preferences is at heart a generational conflict. In 2020, the median voter is, for the first time in US history, a Millennial. From here on out, the median voter is only going to get more left-leaning on economic policy given the painful economic context that has defined Millennial, and especially Gen-Z, adult experiences.
- 26 For those still skeptical that these parties' policies diverge from laissez-faire economics, consider a traditional conservative's lament of Trump's ascendance: “When your raison d'être stops being How can we hold to the principles of limited government and economic freedom? and becomes How can we hold on to this majority for one more cycle? then you've become the very last thing that you're supposed to be against.”
Jeff Flake, Conscience of a Conservative: A Rejection of Destructive Politics and a Return to Principle (Random House, 2017), 13.
- 27 Ryan is the architect of Trump's corporate tax cuts and the former Speaker of the House of Representatives. My unsolicited advice to Speaker Ryan would be to wait for the demand-driven policies to overshoot their mark – as all pendulum swings eventually do – and then come in as the savior. It will take 10 to 15 years, but it is the only way.
- 28 Department of Thought and Theory, “China's Realistic Response and Strategic Choices after the Great Changes of the Soviet Union,” China Youth Daily, July 31, 2006, http://m.wyzxwk.com/content.php?classid=13&id=7392.
- 29 Jason Buhi, “Foreign Policy and the Chinese Constitutions During the Hu Jintao Administration,” Boston College International and Comparative Law Review 37, no. 2 (Spring 2014): 253, http://ezproxy.lapl.org/login?url=https://search-proquest-com.ezproxy.lapl.org/docview/1663666068?accountid=6749.
- 30 Development Research Center of the State Council, the People's Republic of China, China 2030: Building a Modern, Harmonious, and Creative Society (Washington, DC: World Bank, 2013), https://www.worldbank.org/content/dam/Worldbank/document/China-2030-complete.pdf
- 31 The high real estate prices priced out Millennials and Gen Z Hong Kongers from home ownership, fueling protesters' anger and unrest.
Alexandra Stevenson and Jin Wu, “Tiny Apartments and Punishing Work Hours: The Economic Roots of Hong Kong's Protests,” New York Times, July 22, 2019, https://www.nytimes.com/interactive/2019/07/22/world/asia/hong-kong-housing-inequality.html.
- 32 To reduce pollution, policymakers shut down entire factories in the worst-affected cities. Such drastic measures may appeal to the median citizen, but their mercilessness on newly jobless individuals means these types of actions are only possible in a one-party system.