
CHAPTER 2
Private Capital Markets
A fundamental premise of this handbook is that there is a difference between the deals, transactions, and financings in the middle market and those in the large‐company, traditional‐corporate‐finance public market. As indicated in the Preface, the focus of this book is the middle market, primarily composed of private businesses. Chapter 1 described the middle market landscape—the definitions, scope, economic impact, and general characteristics of middle market companies. The purpose of this chapter is to set the stage for the balance of the discussion in this handbook by describing how these companies interact with the financial services, particularly with respect to M&A, by providing an overview and perspective of middle market and private capital market activity.
A capital market is a market for securities (debt or equity) where businesses can raise long‐term funds. Since the 1970s, public capital markets—by which we mean companies that trade on a public exchange and have a float of more than $500 million—have received much of the attention from academics in the literature and press. For many years it was assumed that insights and ideas about public markets could be applied in the private markets, but in recent years this assumption has been challenged by research studies showing that the two are different in many meaningful ways and across the whole spectrum of financing activities and capital transactions.1
At a macro level, middle market mergers and acquisitions (M&A) activity is currently driven by the aging population of business owners, significant availability of private capital, and the need of publicly traded companies for revenue, earnings growth, innovation, and talent. As a backdrop in general, M&A is influenced by capital availability, liquidity, trends in the economy and industries, and motives of the players, which vary in each market and for each transaction. Whether one is a buyer, seller, M&A advisor, investor, or lender in the middle market, it is important to understand the market differences and dynamics.
A number of factors differentiate the public and private markets:
- Risk and return are unique to each market.
- Liquidity within each market is different.
- Motives of private owners are different from those of professionalmanagers.
- Underlying capital market theories that explain the behavior of players in each market are different.
- Private companies are priced at a point in time, while public companies are continuously priced in the stock market.
- Public markets allow ready access to capital, whereas private capital can be more difficult to arrange.
- Public shareholders can diversify their holdings, whereas shareholders of closely held businesses have few opportunities to create liquidity or to reallocate their ownership in a private company.
- There is little “retail” market for shares in private companies; transactions usually involve buying or selling large stakes or the entire company.
- Private markets are inefficient, whereas public markets are fairly efficient.
- Market mechanisms have differing effects on each market.
- Costs of capital are substantially different for each market.
- The expected holding period for investors is different.
- The role of institutional investors is different.
- The transaction costs of buying versus selling a business are different.
The differences between public and private capital markets are important because acquisition pricing and behavior vary by market, or more specifically, by market segment. Further, much of what is taught in traditional corporate finance is not easily applied, and is not appropriate to apply, to the private capital markets and to many middle market deals. Last, a clearer understanding of market behaviors, drivers, processes, and dynamics will enable those on all sides of a transaction to put greater focus on creating value and meeting the strategic objectives of owners and shareholders.
SEGMENTED MARKETS
The private markets contain numerous marketplaces. For example, there are different submarkets for raising debt and equity and for transferring business interests. Markets are also segmented by company size and by ownership type. This handbook consistently uses the collective term markets to describe activity within the private capital markets, rather than attempting to describe particular submarkets with a confusing array of terminology. While there are no definitive size boundaries, as we discussed in Chapter 1, Figure 2.1 depicts market segmentation by size of business.2
Small businesses with annual sales of less than $5 million are at the bottom of the ladder. There are more than 5 million small businesses in the United States and together this group generates approximately 15% of the U.S. private‐sector gross domestic product (GDP). These businesses generally are handled by the business banking group of community or smaller regional banks and are almost always owner managed. These businesses have limited access to the private capital markets beyond bank loans, assistance from the Small Business Administration (SBA), and business brokers. Capital access improves as the business moves into the upper segments.
The entire middle market generates roughly 40% of the U.S. private‐sector GDP. The lower‐middle market segment includes companies with annual sales of $5 million to $150 million. The lower‐middle market is the main province of the private capital markets as described in this book. These companies generally have good relationships with local or regional banks, or with regional leaders of national commercial banks. They may deal with investment banks when a transaction happens or use business brokers, but many times they engage with middle market M&A advisors. Companies in this segment have a number of unique characteristics:
- There is owner management.
- Owners have virtually unlimited liability and personally guarantee the debt.
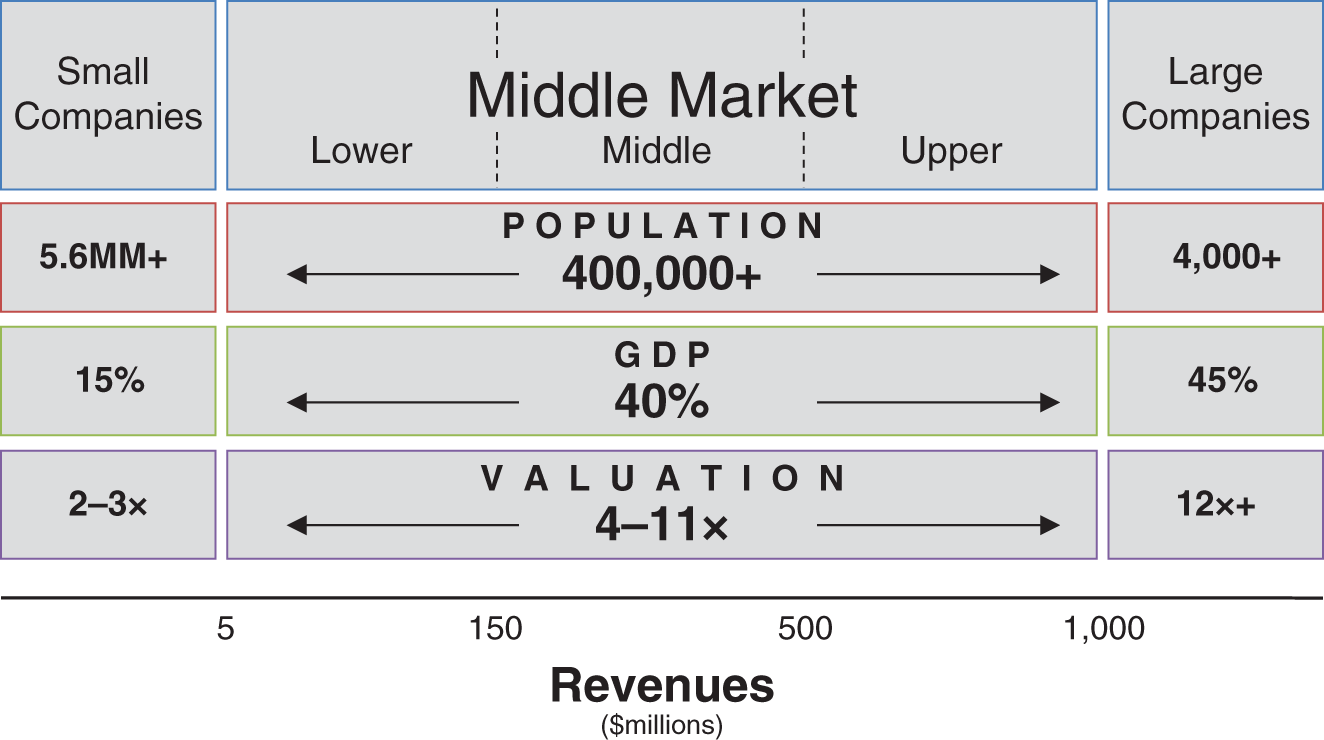
FIGURE 2.1 Segmented Capital Markets
- Owners typically have most of their personal wealth tied to the business.
- A vast majority of these businesses will not transfer to the next generation of the same family.
- Access to capital varies greatly, is situation dependent, and is difficult to prescribe.
- The enterprise value (EV) of the company can vary widely from year to year.
- As a practical matter, lower‐middle market companies are more likely to be sellers and much less likely to be acquirers in an M&A transaction.
The middle‐middle market includes companies with annual sales of $150 million to $500 million. They are serviced by regional investment banks and draw the attention of the bank's top lenders—their corporate bankers. Generally, capital market access and efficiency improve at this level as the sophistication and robustness of the business increase. Companies with sales over $150 million begin to have access to nearly all capital market alternatives in some form, though selectively and usually at a higher price than larger companies pay.
The upper‐middle market is comprised of companies with sales of between $500 million and $1 billion. These companies have access to most of the capital market alternatives available to the largest public companies. This group of companies attracts the secondary attention of the largest Wall Street investment banking firms; the largest regional bankers also take notice. In this tier, capital is accessible and priced to reflect the riskiness of the borrower. Some of these companies are publicly held, but they are increasingly likely to be in private hands, part of a trend that has seen the overall number of U.S. public companies decline from a peak of more than 8,000 in 1996 to below 3,500 today.
The large‐company market, which is almost entirely composed of public companies, is estimated to generate about 35% of the U.S. private‐sector GDP. Large companies have the complete arsenal of capital alternatives at their disposal. Many use discounted‐cash‐flow techniques to make capital decisions because they can fund projects at their marginal cost of capital. Those that are private have most of the financial capabilities of public companies. Wall Street bankers focus primarily on these companies. This segment of the market is where the finance theory, research, and rules of traditional capital markets were developed and typically applied.
Each market segment yields information and liquidity, which form the basis for particular investor return expectations manifested by acquisition multiples paid for companies within it. Acquisition multiples based on EBITDA (earnings before interest, taxes, depreciation, and amortization) represent capital structure decisions. The reciprocal of EBITDA multiples yields an expected return on total capital. For instance, equity investors traditionally require 30 to 40% compounded returns from small businesses, 20 to 30% from investments in the middle market, and 10 to 20% from investments in large companies, which implies lower acquisition multiples in the middle market than in the large‐company market.3 Some funds define their targets in terms of the difference between private‐market investment returns and those attainable in the public markets—for example, aiming for a return 2.5 times greater than they could get in public markets.
Markets segment by investor return expectations because players within a segment view valuation parochially. The relationship between investor return expectations and valuation is straightforward: Greater perceived risk requires greater returns to compensate for the risk. Using a capital market–determined discount rate is another way of looking at this risk/return relationship. The discount rate then is the expected rate of return required to attract capital to an investment, taking into account the rate of return available from other investments of comparable risk. Risk is the largest determinant of return expectations, but not the only one. A surfeit of capital (such as we see at this writing) may drive investors to accept lower expected returns; also, the possibility of greater reward may increase multiples regardless of the risk of an investment.
Calculating the reciprocal of a selling multiple is a shorthand method for determining the capitalization rate or, once we account for assumed long‐term growth, the discount rate. EBITDA acquisition multiples for the lower‐middle market typically fall between 4 and 10 times. Expressed as a reciprocal, this roughly corresponds to a 10 to 25% capitalization rate, or assuming a long‐term EBITDA growth rate of 2%, a discount rate (investor return expectation) of 12 to 27%. Return expectations can be expressed as discount rates and can be tested. Assume a buyer uses a capital structure in an acquisition with 30% equity, carrying a 30% return expectation, and 70% debt, which costs 9%. The discount rate implied in this capital structure is about 15%, within the return range cited above. Thus, as Figure 2.1 implies, there is a correlation between investor return expectations and pricing. Although much of Figure 2.1 is definitional, support for these findings can be found in several private company transactional databases.4
Since a number of factors form boundaries in the capital markets, appraisers must correctly identify the segment within which the subject will be viewed. Characteristics need to be weighed in their totality. For example, some companies have annual sales of $3 million, but meet other criteria that may allow them to be viewed as lower‐middle market entities. On the contrary, companies with sales over $5 million may be viewed by the markets as small businesses if they don't have certain characteristics. An incorrect assessment will lead to improper valuation. Table 2.1 provides criteria appraisers can use to define the segment within which their subject should be viewed.5
Some criteria warrant further explanation. Owners significantly influence the segment in which their company will be viewed. For instance, if an owner decides to personally manage every aspect of the business and desires to achieve only a good lifestyle from the business, the market will probably view it as a small business. Conversely, owners who strive to create company value and build a functional organization with professional management may induce the markets to view the company as a lower‐middle market entity.
TABLE 2.1 Defining Characteristics by Segment
| Characteristic | Small Market | Lower Middle Market | Middle Middle Market |
|---|---|---|---|
| Revenue size | < $5 million | $5–$150 million | $150–$500 million |
| EBITDA size | <$500,000 | $500,000–$15 million | $15–$50 million |
| Ownership profile | Owner‐managed | Owner‐managed or professionally managed | Professionally managed |
| Owner or manager capital motives | To manage cash in the business, not the balance sheet | To manage the business, not the balance sheet | To manage the net assets on the balance sheet |
| Ownership goal | Lifestyle | Lifestyle—entity wealth creation | Entity wealth creation |
| Role of key manager | Leads the organization and all functions | Leads the organization and may act as a functional lead | Leads the organization with a fully developed management team |
| Market orientation | Service | Service—market maker | Market maker—service |
| Capital Access | |||
| Debt | Business banking | Commercial banking | Corporate banking |
| Equity | Personal/family | Personal/private equity | Private equity |
| Intermediation | Business brokers | M&A advisors and select local investment bankers | Regional/national investment bankers |
Market players also help decide how a subject will be viewed, and a company may be placed in a segment as much by the nature of its advisors as by the size of its revenues. For example, business bankers and business brokers work with small businesses; M&A advisors, commercial bankers, and private investment bankers work with lower‐middle market businesses.
Once again, market segmentation matters in M&A because it affects how a company is viewed by the capital markets, which in turn determines several critical issues: how that company will be valued, capital access and costs, transfer options or exit alternatives, and which professionals are likely to engage and support the business. Therefore, one element of a strategy to maximize a company's value is for management to get the company viewed in a more advantageous segment based on their objectives.
HOW MARKET PLAYERS VIEW RISK
Markets, like individual firms, have a cost of capital that reflects the return expectations of capital providers in that market. But how do capital providers determine risk and return within a market? How do owners and managers view it? The answers to these questions depend on the type of capital, market segment, and other factors, including the overarching goals of individual market participants.
Capital Providers
Capital providers use what may be thought of as credit boxes, which depict the criteria necessary for them to agree to invest the specific capital. Many institutional capital providers use portfolio theory to diversify risk while optimizing return. Portfolio theory is built on the premise that the risk inherent in a group of assets is different from the inherent risk of that asset in isolation: One loan standing by itself is riskier than a portfolio of 100 loans to companies with similar financial characteristics. It is unlikely that even investments in a class, like senior middle market debt, will experience returns that co‐vary. Credit boxes help capital providers filter asset quality and set return expectations. Loans or investments that meet the terms of the credit box should promise risk‐adjusted returns that meet a provider's goals.
Providers also use other devices to manage portfolio risk and return. Techniques such as advance rates and loan terms enable providers to hedge risks. They manage risk with interest rate matching and hedges, and diversify investments across geography and industries. Negative loan covenants are a major risk/return management tool; by setting behavioral boundaries around the borrower, capital providers are better able to manage portfolios. Providers constantly monitor their portfolios, feeding back information through their credit boxes to adjust the characteristics of assets in their portfolios.
Debt providers' use of loan covenants further segments capital markets. For example, the range of senior debt multiples and the ratio of senior debt to EBITDA are different for each segment. Small market debt providers usually will not lend more than two times EBITDA; middle market lending usually occurs in the three‐to‐five‐times range; finally, middle‐middle and large‐company lenders often lend beyond five times EBITDA.
Markets are further segmented by the ability to accommodate perceived risk differences. In the middle market there is a distinct difference between the portfolio risk experienced by equity providers and that of debt providers. Equity risk is generally greater, due to its legal structure, and it is likely to be a larger portion of a smaller portfolio, further increasing risk. Debt tends to be less risky, due to its substantial bundle of legal rights, and it is usually a smaller portion of a larger investment portfolio, diminishing the impact of risk. Middle market equity investors generally spread their risk among relatively few investments contained in a given fund or portfolio; while this strategy is inherently more risky because it is not as diversified, it allows equity investors to focus on an investment theme or platform mandate and to maximize the return of that portfolio. In contrast, debt investors spread the risk among a larger pool of investments in the portfolio. Mezzanine investors can assemble blended portfolios with an entirely different risk profile since they tend to make relatively smaller investments in a greater number of companies. Moreover, the debt portion of their investments diminishes mezzanine investors' risk, while the equity portion improves their return.
Lenders' and investors' portfolios define the limits of their expected returns, and managing these limits creates market fluctuations. Similarly, owners manage a balance sheet with a blend of equity and debt. In other words, owners manage a portfolio of equity and debt in order to maximize utilization of capital and control exposure to risk. The day‐to‐day operation of these portfolios of investments working through market mechanisms defines the market at any point in time.
Owners' and Managers' Views of Risk/Return
Owners and managers often view risk differently than investors do. For one thing, a business owner generally has a portfolio of one company to absorb all equity risk, and may be personally liable for debt. The owner's view of an acceptable return may be more idiosyncratic and less “rational” in an economic sense: One owner might be comfortable with a below‐market return for a so‐called lifestyle company; another might have an entrepreneurial mindset and seek life‐changing exponential returns.
Appraisal attempts to estimate the balance between risk and return. Overall, risk and return balance by market segment. Behavior of parties in the markets reinforces this premise. For instance, when a large public company, whose stock may be trading at 30 times earnings, acquires a lower‐middle market company, why does the larger company pay only 4 to 7 times earnings, and not 20? Paying any multiple less than 30 should be accretive, thus adding value to the shareholders. The reason is that the larger company views investments in the lower‐middle market as riskier, and therefore chooses to pay less to balance risk and return—a price that might be acceptable to one seller but not to another.
Here is the key insight: Risk and return are viewed and defined differently by owners and managers in each market. At a minimum, both risk and return are comprised of financial, behavioral, and psychological elements. Financial risk/return indicates that the monetary results of an action must compensate for the risk of taking the action. Behavioral risk/return describes the fact that actions occur within a set of social or familial expectations. For example, loss of face in a community may be viewed as a behavioral risk. Psychological risk/return is personal to the decision maker and accounts for an individual's or an institution's emotional investment in a course of action.
Owners of small companies view risk/return more from a personal perspective, unlike shareholders in larger‐market firms. Many small and lower‐middle market company owners view the business as a means to a desirable lifestyle, rather than an entity that creates purely financial value. Most small‐firm owners do not measure investments in the business with the tools of corporate finance. They are more likely to use a gut‐feel approach in making an investment decision. As a rule, they are averse to debt,6 arguably because debt in the lower‐middle market usually comes with personal guarantees (PGs). As noted before, a private owner likely views debt as just an expensive method of investing their own capital—since the PG means they are taking the same risk as equity. This may be why many private owners are quick to pay off debt, and generally prefer using equity to fund capital needs whenever possible.
Middle‐middle market owner‐managers tend to balance the financial and psychological elements of risk/return. They understand that the cost of capital is relatively high, so financial returns must compensate for investment risk. However, personal pride and community standing still have great importance. Middle‐middle and larger‐company managers are driven to realize risk‐adjusted returns and view risk more strategically. This drives economic value–added approaches to managing, which have taken root only in larger companies. Behavioral and psychological decision making are less important to large‐company managers, or at least they take different forms.
The combination of capital providers that balance risk/return through portfolio management and owner‐managers who view risk/return differently leads to market segmentation. The behavior and perceptions of players are unique in each market. Therefore, making proper financing, appraisal, and investment decisions requires using theories and methods appropriate to the subject's market.
Buyers
Closing transactions in the middle market and then having strong financial returns afterward is largely influenced by the fit between the parties (e.g., the buyer and seller). In public company transactions there are few strings attached post‐closing, and the driver of the transaction is usually maximizing shareholder value. By contrast, middle market deals succeed because of the alignment of ambitions, strategic intent, and financial agreements, and often include earnouts, management agreements, and other post‐deal understandings and engagement. Keep in mind that in middle market M&A, deal terms can be as important as the stated valuation in a transaction. In fact, much of this handbook is dedicated to understanding the nuances and details of the terms and conditions of a merger, acquisition, or divestiture.
Finding the right buyer begins with understanding the types of buyers. We have segmented the buyer types into four broad groups and provide some characteristics and a brief description of each in Table 2.2. For most sellers, part of the fit equation includes achieving a financial objective along with their other goals. They make the mistake of believing that there is only one value for their business, when in fact every company has a range of values, depending on the appraisal purpose and who does the valuation. For example, a perfect‐fit strategic buyer will value a company one way, a nonstrategic individual buyer will value it another way, and a private equity group still another.
Midsized companies can often sell to one or more of these four types of buyers. Each of these alternatives normally represents a different value range and different liquidity options, eventually ending in an exit or transfer of ownership.
Individual Buyers Each prospective buyer type brings something different to the table, which directly affects their valuation and the terms in which they may be willing to enter into a transaction. Individual buyers can value a target only on the basis of its stand‐alone prospects, without figuring in positive synergies that might be created by combining the target's operations with other businesses. Typically, this group has an annual return expectation of 30 to 40% on its investment in the company. Individual buyers operate mainly in the small and lower‐middle market business segment. This was confirmed by one study comprising 10 years of data that showed that the selling price to earnings (effectively price to cash flow) multiples of small companies (transactions of less than $1 million) have averaged in the 2.5‐to‐3.0‐times range. This study used the Institute of Business Appraisers database, which houses selling data for more than 10,000 small companies. Interestingly, one of the conclusions of the study was that even with inflation and varying interest costs, that average stayed within a fairly tight range.
TABLE 2.2 Four Types of Buyers
| Buyer Profile | Description |
|---|---|
| Individual | Most individual buyers are acquiring a job (or source of income) when they purchase a business. Purchase prices tend to be constrained, and are typically comprised of a relatively small down payment with the balance coming from SBA‐backed bank financing and seller notes. |
| Financial | Private equity groups, business development companies (BDCs), search funds, independent sponsors, certain holding companies, and family offices are the main financial buyers in the middle market. They typically do not enable operating synergies in a deal. An institutional buyer who does not currently participate in the target's industry or cannot leverage the target's business is probably a financial buyer. This group includes some holding companies and insurance companies. |
| Strategic | Strategic buyers can be segmented into three subgroups: large corporate buyers (most tend to be publicly traded), private‐equity‐funded platform companies, and middle market businesses that are not institutionally funded. Corporate buyers and private‐equity platforms make up the majority of strategic buyers in the U.S. market. Strategic buyers can usually extract or create value beyond what a financial buyer can enable, resulting in operating and strategic synergies. These synergies can result from a variety of acquisition scenarios. Leading drivers of value can be increased revenues, market penetration, access to talent, and enhanced innovation. Perhaps the most quantifiable group of synergies emanate from horizontal integrations, which can result in substantial value by cutting duplicate expenses or by extending each company's reach into markets where the other is strong. Some of these savings or gains may be shared with the seller. Vertical integrations also can create substantial synergies in cost, coordination, or market expansion. Synergies also can result from the different financial structures of the parties. For instance, the target may realize interest expense savings due to adopting the cheaper borrowing costs of the acquirer. |
| Value investor | These acquirers seek assets or franchises that may be thought of as distressed or turnaround companies. They may seek to acquire a target company that has no defensible current or future earnings prospects, or is in an industry that does not give credit for value beyond the fair market value of its assets. |
Financial Buyers Historically, private equity firms have been financial buyers that tend to make direct investments in middle market businesses and tend to buy companies that they value and purchase at 4 to 10 times EBITDA, the bulk of the investments being buyouts where they have control. Multiples vary greatly by industry, with some hot sectors (healthtech and fintech, life sciences, and the like) commanding much higher prices than others. Private equity is part of the investment class called alternative investments. Buyout funds comprise the largest segment of private equity, the ones that lead M&A activity in the middle market, and are usually referred to in that context. Globally there are about 3,400 active buyout funds, with 2,300 of them in the United States. As shown in Figure 2.2, about 84% of those funds are focused on deals valued less than $250 million.a
In recent years, especially as the total amount of private equity has grown and the private equity market has matured, the landscape has evolved. As the private equity industry has expanded, it has aggressively fished the ocean for stand‐alone, core middle market companies, resulting in fewer of them (i.e., the market is overbought). To navigate this shortage, many private equity firms have embraced a strategy of deploying capital through a platform acquisition onto which they can place additional, smaller acquisitions (referred to as add‐on or tuck‐in acquisitions). This has given them the ability to take on some of the persona and attributes of a strategic investor (see the next subsection). Some PE firms have also become increasingly willing to buy minority stakes. The firms provide strategic capital for a number of activities, including recapitalizations, leveraged buildups, management buyouts, management buy‐ins, and facilitation of generational transitions of family businesses. Private equity firms themselves fund equity capital (provided by investors in funds created through partnerships with private and institutional investors), and most often work in tandem with providers of debt capital to make acquisitions (thus the concept of leveraged buyout, which was shortened to just “buyout”). While PE firms are opportunistic investors and look at many deals before making an investment, they are increasingly thematic investors with predefined market thesis and portfolio strategies. Frequently, they will create investment opportunities based on a thesis by sponsoring an executive team to target an industry in which the team has relevant experience and a strong track record.

FIGURE 2.2 Percent of Buyout Funds by Deal Size
Source: www.PrivateEquityInfo.com 2021.
*EV = Enterprise Value
In addition to buyout funds, the private equity market includes search funds, independent sponsors, business development companies, small business investment companies, mezzanine funds, family offices, growth equity, and venture capital. Under the financial buyer umbrella, some may consider an employee stock ownership plan (ESOP); although it is not a buyer per se, it is a technique that uses debt, and possibly private equity, to transition a company to its employees (and can be thought of as a financial buyer). Growth equity and venture capital are also not buyers per se, rather funding sources for growth companies that may make acquisitions. To round out the discussion about financial buyers, you will find more details about several of the most common ones below.
A search fund is an entity that has been formed by an entrepreneur or operator funded by a mix of individual and possibly institutional investors with the purpose of buying a single business, often for the entrepreneur or operator to manage and grow. It is sometimes referred to as entrepreneurship through acquisition.
An independent sponsor (previously called an unfunded sponsor) is effectively a private equity firm that raises capital for each portfolio investment as that investment is made. This is in contrast to a traditional firm that has a committed fund that it can deploy as the opportunities arise. However, this does not mean that the independent sponsor cannot act quickly. The independent sponsor usually has a group of pre‐vetted investors in the wings ready to evaluate and commit funding for opportunities that interest them. And unlike a search fund, an independent sponsor is building a portfolio of companies rather than pursuing a single business.
Business development companies, known as BDCs, created by Congress in 1980 and registered as investment companies, are closed‐end investment funds that are typically publicly traded and have the advantage of investing without the pressure of returning capital to their limited partners in a predefined window of time. You can think of BDCs as private equity funds that are publicly traded. Historically, BDCs have focused on businesses with strong cash flow generation and paying dividends to BDCs' investors, thus investing as senior, mezzanine, and unitranche lenders. In recent years, there has been a trend to fund buyouts as part of BDCs' portfolio and invest some equity alongside their debt.
Small Business Investment Companies (SBICs) are privately owned investment funds licensed by the U.S. Small Business Administration (SBA) that have obtained much of their financing from the SBA. They use SBA‐guaranteed loans and guaranteed securities. They do provide financing that can facilitate an M&A transaction in small businesses (in this case as defined by the SBA).
Mezzanine funds are primarily subordinate debt lenders that also may facilitate a transition or M&A transaction. Some of these lenders provide a tranche of equity to balance the capital stack if needed.
Family offices are money managers that invest the wealth of one or more ultra‐high‐net‐worth families. There are currently more than 3,000 family offices in the United States. In recent years, some family offices have effectively formed their own private equity funds to eliminate the costs associated with an external fund, and are now making direct investments in middle market companies. Many leverage the beneficiary family's capital and resources relating to certain industries in which the family may have actually created their wealth (but not always). Family offices are also investors in search of fund operators similarly providing capital and resources. A key attribute of a family office as an investor that can benefit a seller is their ability to invest in and hold that investment indefinitely. Some sellers are comforted to know that their company is not being purchased to then be resold in a few years (as is the case for most private equity firms).
Strategic Buyers As mentioned earlier and alluded to in Table 2.2, the strategic buyer landscape has evolved to include publicly traded companies, large private companies, platform companies of PE firms, and certain middle market business that are financially strong without institutional capital. Strategic buyers are many times a preferred buyer for middle market sellers seeking a complete exit. These “strategics” are often in the same or tangential industry, needing the target company's market presence or share, talent, intellectual property, or production/service capability. These buyers use what we call the second‐spreadsheet to determine value. First, they forecast the numbers for the target acquisition with no change in ownership (i.e., the stand‐alone value). Next, they impute the impact expected with the change in ownership, which might be increased investment, new business, costs savings, and so on after integration costs. The second spreadsheet is different for every acquirer, and this difference explains why five different corporate acquirers will value a company many different ways.
Historically, strategic buyers pay greater acquisition multiples as compared to financial buyers for middle market companies.b The valuation may be higher than a financial buyer because of the strategic or operational leverage created by the synergies (as documented in the second spreadsheet). This increases adjusted EBITDA by the value of the synergies the strategic buyer agrees to credit to the seller. For example, if the buyer decides to “share” $500,000 in annual cost savings with the seller, and uses a 5× EBITDA multiple, the resulting valuation will be increased by $2.5 million beyond what a financial buyer might pay. Private equity firms assembling platform plays may also see and pay for the value of these positive synergies.
In recent years, a new form of acquirer has appeared, the special purpose acquisition company, or SPAC, which is a hybrid of financial and strategic. SPACs are publicly traded shell companies with no operations and no revenue, put together to attract capital from public investors for the purpose of acquiring a private company, thus taking the target company public without needing to go through an IPO process. As described by the Securities and Exchange Commission, “A SPAC is created specifically to pool funds in order to finance a merger or acquisition opportunity within a set timeframe. The opportunity usually has yet to be identified.”7 The number of SPACs has grown significantly since 2010, when only two came to market. SPACs are strategic inasmuch as their purpose is to acquire, take public, and operate a single company; they are financial insofar as they are created by financiers—money seeking a use to which it can be put—whose motivation may be as much opportunistic as it is strategic. In 2020, SPACs raised more than $80 billion; the average value of a SPAC IPO was $336 million, meaning that most SPACs have been in the middle market.
Value Investors Value investors (sometimes referred to as buyers of distressed companies) look for assets they believe the market has not correctly priced, acquire the assets of the seller, and value them accordingly. Earnings are not really used as the basis for the valuation, but investors do look at the company's fundamental ratios. Rather, the assets are valued on either a liquidation basis or other appropriate premise of value depending on the circumstances and underlying assets.
While we have mentioned historical EBITDA multiples for each buyer group, it should be noted that valuation multiples vary tremendously in actuality. Differences in risk profiles, expected growth rates (particularly in the years following the one used in valuing the company), and the strategic significance of the company to the buyer all play huge roles in establishing value. What's more, there are certain industries, life sciences, and technology, for example, where it would be highly unusual for a successful company to trade within these multiples. This is not to say that these multiples cannot be used as general guidelines, but rather is an admonition not to take anything for granted. Nothing takes the place of good homework, thoughtful analysis, and due diligence when establishing a company's value.
MARKET ACTIVITY
The middle market can be viewed by the sizes and quantities of transactions. Figures 2.3, 2.4, and 2.5 provide a historical context on a global level for understanding the market, particularly as it relates to M&A activity. Figure 2.6 narrows the market to the United States and Canada. The data in Figures 2.3 and 2.4 has been segmented by deal size of transaction to roughly correlate with those segments in Figure 2.1. To some degree, there is a blurring of definitions of private and public deals on a global basis at the company size on which this handbook focuses. The data supporting these charts includes both private and public information as appropriate. It does not include growth equity or recapitalizations, which would increase the quantity and value of the transactions significantly. These charts are meant to illustrate the pure M&A deals.
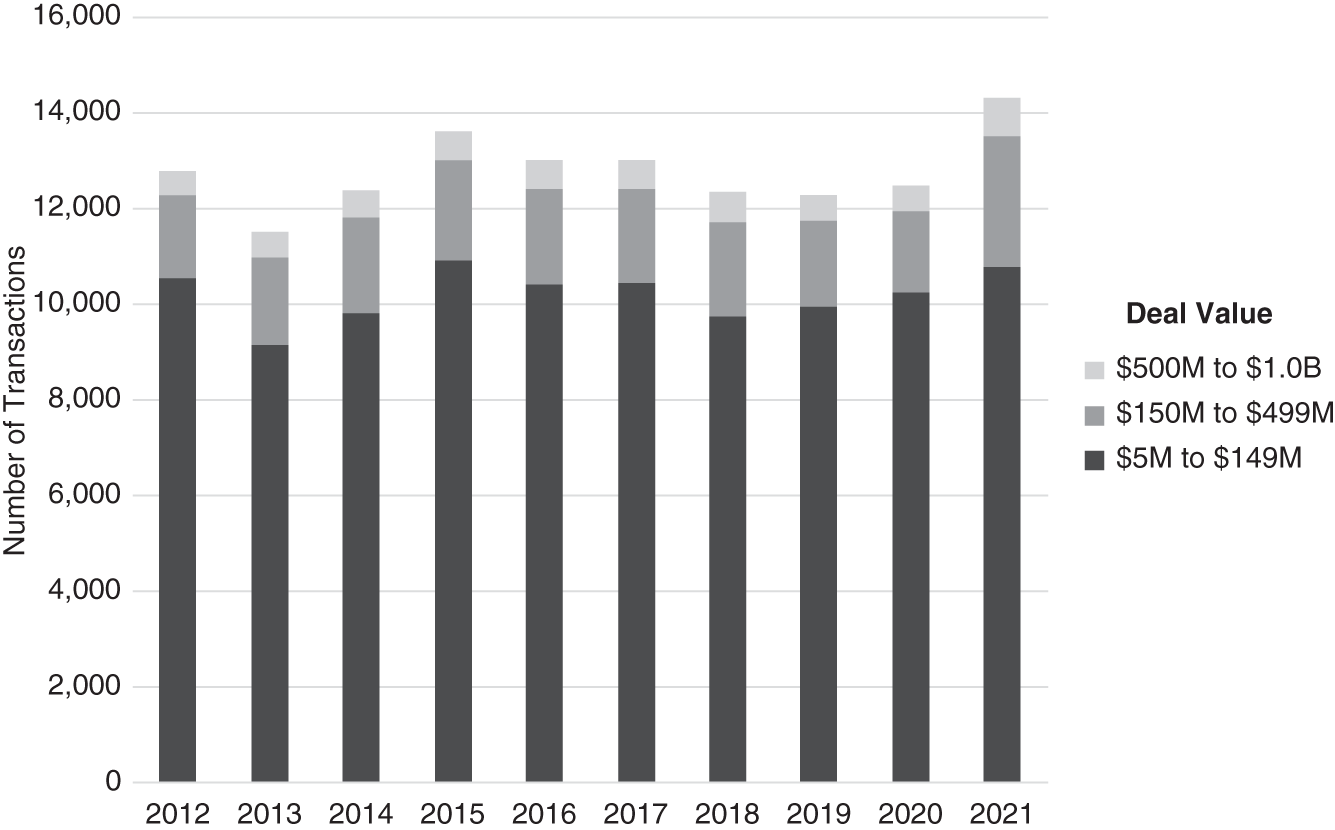
FIGURE 2.3 Global Middle Market M&A Activity‐Transaction Volumes
Data source: Dealogic 2022.

FIGURE 2.4 Global Middle Market M&A Activity‐Transaction Values
Data source: Dealogic 2022.
The quantity of transactions ramped up coming out of the Great Recession to a peak in the 2014–2016 window, and then receded until 2019. Despite the pandemic in 2020, the quantity of transactions was similar to 2018 and 2019, primarily due to the extraordinary activity in Q4. As shown in Figures 2.3 and 2.4, 2021 grew dramatically as sellers chose to act given economic and geopolitical uncertainty coupled with record valuations. In the United States, this was driven by a combination of pent‐up transactions from 2020 coupled with the increase in tax rates that were to be implemented in 2022. Depending on the data source used, we found that the number of global middle market M&A transactions during the past 10 years averaged about 13,000 +/– 1,000.
On average, global middle market M&A has reached $1.2 trillion annually for the past 10 years. Figure 2.4 highlights the value of transactions in the middle market versus the quantity as shown in Figure 2.3, and the trend of aggregate deal values somewhat tracks that of the quantity of transactions. However, note that the decline in values was reversed with the extraordinary increase in deals in 2021. The underlying data indicates that the private equity–funded portion of 2021 transactions included a greater number of higher‐performing companies. This logically tracks, given that underlying valuations increased to historic levels (on a per‐transaction basis) during that same period, especially for the middle and upper middle market deals in 2021.
Figure 2.5 highlights the global nature of the middle market. Since 2016, North America's volume of transactions has continued to increase to over 50% of the market. Today, the middle market is clearly global in nature, with significant activity in Europe and the Asian Pacific region.
Figure 2.6 narrows the focus of the data to the United States and Canada, highlighting the activity for many of the readers of this handbook. The extraordinary growth in the quantity and values of transactions was further pronounced in 2021 as the market experienced a hyper level of activity.
Multiples rise and fall; industries and geographies go in and out of favor; the structure of deals changes, depending on which kind of buyer is dominant and on factors such as the availability and cost of capital. While all these things change, the overall number of middle market mergers and acquisitions remains relatively steady. In any given year, about 1 in 5 middle‐market companies will be involved in an acquisition and about 1 in 20 will be involved in a sale.8 Observers of the market have forecast an increase in selling as baby‐boom‐generation owners retire (and have been forecasting this for at least a decade), and, if accurate, this may indicate a pent‐up demand for sales by owners. A financial crisis or other disruption can affect the pace of the market one way or the other. For example, new deal making almost stopped in the second and third quarters of 2020 because the Covid‐19 pandemic made determining the near‐term value of a company almost impossible. Foreseen changes in tax laws may cause buyers or sellers to hurry or delay a deal. But the continuity of the market is more striking than its fluctuations.

FIGURE 2.5 Global M&A Activity‐Transactions by Region
Data source: Pitchbook 2022.
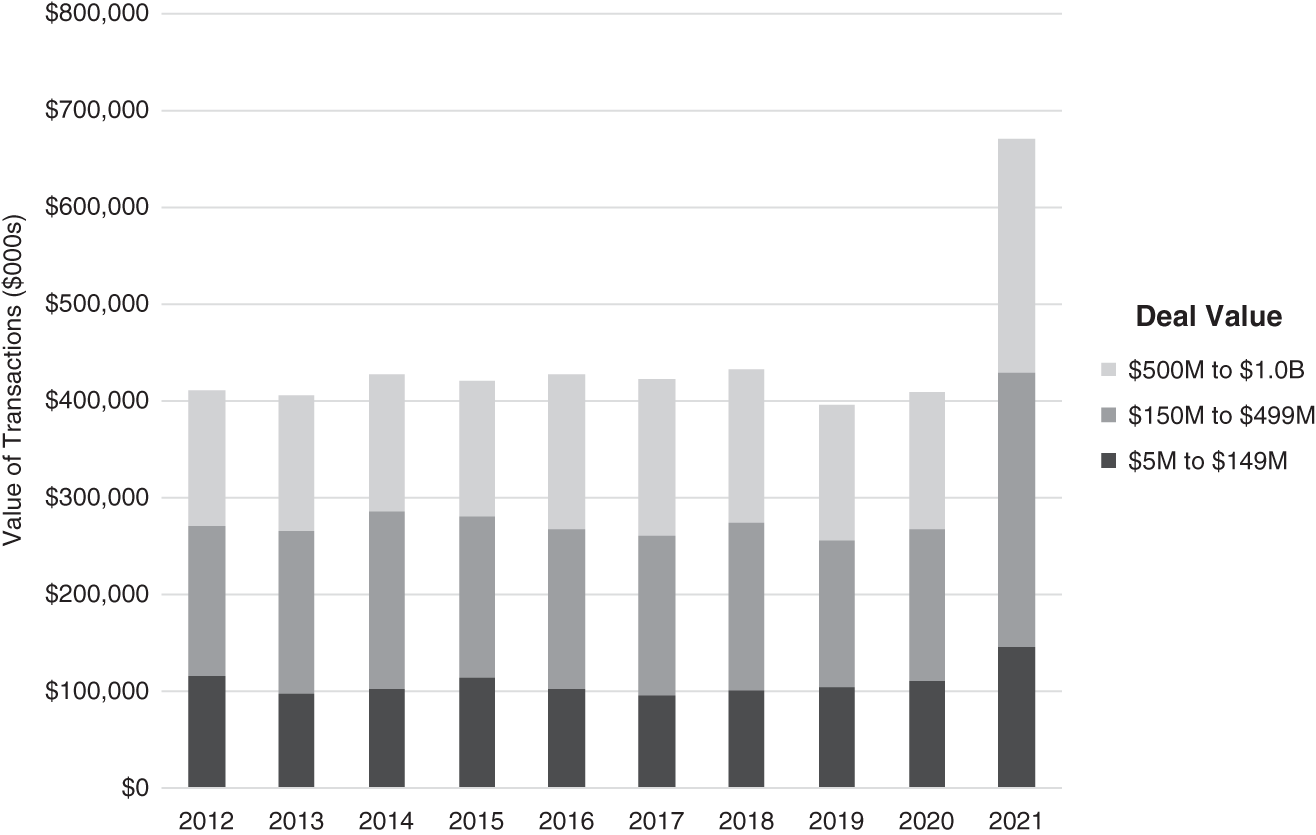
FIGURE 2.6 U.S. and Canadian Middle Market M&A Activity‐Transaction Values
Data source: Dealogic.
Because the middle market is home to many companies that are both solid and fast‐growing, it is attractive to buyers; and as some of these companies enter into the middle‐ and upper‐middle market ranks, they become buyers themselves. This handbook is designed to help both middle market companies and their advisors make the most of the deal opportunities they see and seize.
NOTES
- a. Source: PrivateEquityInfo.com 2021. These statistics represent only active buyout funds with current investments, and do not include venture capital, growth equity, angel investors, institutional real estate, or the other segments of the private equity market.
- b. In 2007 and again in recent years the market has experienced private equity buyers outbidding strategic buyers, paying higher purchase prices for some highly desirable companies. We believe this phenomenon is likely the result of a historically low cost of capital coupled with an excess of private equity needing to be invested.
- 1. Examples of middle market research and studies: (1) multiple industry surveys of middle market advisors by the Alliance of M&A Advisors, 2008–2021; (2) Private Capital Markets: Valuation, Capitalization, and Transfer of Private Business Interests (John Wiley & Sons, 2011), by Robert T. Slee; (3) Handbook of Financing Growth: Strategies, Capital Structure and M&A Transactions, 2nd ed. (John Wiley & Sons, 2009), by Kenneth H. Marks et al.; (4) the Pepperdine Private Capital Markets Project; (5) ongoing research by the National Center for the Middle Market at The Ohio State University Fisher College of Business.
- 2. Robert T. Slee, “Public and Private Capital Markets Are Not Substitutes,” Business Appraisal Practice, Spring 2005.
- 3. Richard M. Trottier, Middle Market Strategies (John Wiley & Sons, 2009), Chapter 1.
- 4. Craig R. Everett, PhD, “Pepperdine Private Capital Markets Project Survey Report,” http://bschool.pepperdine.edu/privatecapital.
- 5. Robert T. Slee and Richard M. Trottier, “Capital Market Segmentation Matters,” Business Appraisal Practice, Summer 2006.
- 6. National Center for the Middle Market and The Milken Institute, “Access to Capital: How Middle Market Companies Are Funding Their Growth,” 2015.
- 7. U.S. Securities and Exchange Commission, “Blank Check Company,” https://www.investor.gov/introduction-investing/investing-basics/glossary/blank-check-company. Retrieved August 1, 2021.
- 8. National Center for the Middle Market, “Middle Market M&A,” 2018. https://www.middlemarketcenter.org/research-reports/merger-acquisition-insights-executives-advisors-consultants.