Chapter 13
For Your Interest: The World of Bond ETFs
IN THIS CHAPTER
![]() Examining the rationale behind bond investing
Examining the rationale behind bond investing
![]() Recognizing different kinds of bonds
Recognizing different kinds of bonds
![]() Appreciating the risks that bond investing entails
Appreciating the risks that bond investing entails
![]() Knowing how much to allocate to your bond portfolio
Knowing how much to allocate to your bond portfolio
I love inline skating. Sometimes, I admit, I have taken to the Pennsylvania hills a bit too fast. There’s just something about the trees racing by and the wind in my face that I can’t resist. Whoosh!
On occasion, I’ve hit a bump, or some tiny driver in a monster SUV who can barely see over the steering wheel has cut me off, causing me to crash to the pavement. But thanks to the heavy, black plastic armor that covers my knees, elbows, wrists, and head (think of me as the Black Knight of Wealth Management), I’ve never been seriously injured.
Bonds are your portfolio’s knee and elbow pads. When the going gets rough, and you hit the big bump (by any chance, do you remember 2008?), you’ll be very, very glad to have bonds in your portfolio.
Plain and simple, there is no time-honored diversification tool for your portfolio that even comes close to bonds. They are as good as gold…even better than gold when you look at the long-term returns. Bonds are what may have saved your grandparents from selling pencils on the street following the stock market crash of 1929.
Bond Investing in the Modern Era
The one thing that grandpa and grandma never had — but you do — is the ability to invest in bond ETFs. Like stock ETFs, most bond ETFs (at least the ones I’m going to suggest) are inexpensive, transparent (you know exactly what you’re investing in), and highly liquid (you can sell them in a flash). Like individual bonds or bond mutual funds, bond ETFs can also be used to produce a reliable flow of cash in the form of interest payments, making them especially popular among grandparent types of any generation.
Yes, I know those interest payments of late haven’t been so great. Nominal bond interest rates are now (mid-2021) at rock-bottom lows. That makes bonds less attractive than they have been at other times in history, but it in no way renders them obsolete. And let me add that given relatively low inflation, the real rate on bonds is not all that horribly pathetic, historically speaking.
On January 1, 2020, 10-year Treasuries were paying 1.7 percent in interest. Back on January 1, 1979, they were paying 9.1 percent. Oh, those were the days! Um…not really. You would’ve fared much better in 2020 than in 1979, given that the inflation rate was but 1.4 percent in 2020 versus 13.3 percent in 1979. Remember, real return — return after inflation — is what matters.
Throughout this chapter, I discuss a few things about bond investing in general. Then, without knowing the intimate particulars of your individual economics, I try my best to help you decide if bond ETFs belong in your portfolio, and, if so, which ones. I also address that all-important and highly controversial question of how to achieve an optimal mix of stocks and bonds.
 The single most important investment decision you will ever make may occur when you determine the split between stocks and bonds in your portfolio. No pressure.
Tracing the Track Record of Bonds
Bonds, more or less in their present form, have been used as financial instruments since the Middle Ages. A bond, you see, is really nothing more than an I.O.U. Jane lends money to Joe. Joe agrees to pay Jane back at a certain date. Joe also agrees to add a bit of money on top of the principal that he returns to Jane. That’s a bond. The money thrown in on top of the principal is called interest. It’s that simple. Then, as now, bonds of varying risk existed. (See the sidebar, “The three risks of bond investing.”) Then, as now, risks and returns were highly correlated.
In other words, Jane won’t lend Joe money unless Joe is trustworthy. If Jane suspects that there is any chance that Joe can’t or won’t repay, she either won’t lend him the money, or she’ll demand higher compensation (more interest).
For the most part, bonds in the aggregate have been, and continue to be, less volatile than stocks, and their returns over time tend to be less. From 1926 to 2020, the average annualized nominal return of the S&P 500 (a broad index of U.S. stocks) has been around 10.7 percent, whereas the return of long-term U.S. government bonds has been approximately 5.6 percent.
A recent study from Deutsche Bank attempted to calculate the real returns of stocks versus bonds (the return after inflation, which happens to be the return that really counts) over the past 100, and even 200 years. Here’s what they found: Stocks in the past 100 years have seen a real return of 7.65 percent, and 10-year Treasury bonds, 2.68 percent. (This compares to a 100-year real return of 3.78 percent for corporate bonds, 1.01 percent for housing, and –1.06 percent for commodities.)
Over the past 200 years, the Deutsche Bank researchers reckon stocks have returned, in real dollars, 6.66 percent, and bonds, 3.06 percent.
To look at it a different way, if you got in a time machine and went back to 1820 (James Monroe was president, and all the cool people were listening to the music of a wild-haired German dude named Ludwig), and invested $1 in the stock market (ignoring all taxes, investment fees, and so on), that $1 today would be worth very close to $400,000. That same dollar invested in bonds would be worth slightly more than $400.
These numbers may lead you to look at bonds and say to yourself, “Why bother?” Well, in fact, there’s good reason to bother. Please read on before you decide to forsake this all-important asset class.
Portfolio protection when you need it most
When determining the attractiveness of bonds, you need to look not only at historical return, but also at volatility: Long-term U.S. government bonds (which tend, like all long-term bonds, to be rather volatile) in their worst year ever (2009) returned –14.9 percent. In their second-worst year ever (1967), they returned –9.2 percent. Those are big moves but still a walk in the park compared to the worst stock market years of 1931 (–43.3 percent), 1937 (–35 percent), 1974 (–26.5 percent), and 2008 (–37.0 percent).
As I note in the introduction to this chapter, during the Great Depression years, bonds may have saved your grandma and grandpa from destitution. The annualized real return of the S&P 500 from 1930–1932 was –20 percent. The annualized real return of long-term U.S. government bonds during the same three years was 14.9 percent.
There are two reasons that U.S. government bonds (and other high-quality bonds) often do well in the roughest economic times:
- People flock to them for safety, raising demand.
- Interest rates often (not always, but often) drop during tough economic times. Interest rates and bond prices have an inverse relationship. When interest rates fall, already-issued bonds (carrying older, relatively high coupon rates) shoot up in price.
As in the past, bonds may similarly spare your hide should the upcoming years prove disastrous for Wall Street. (You never know.) Whereas international stocks and certain industry sectors, like energy and real estate, have limited correlation to the broad U.S. stock market, bonds (not U.S. junk bonds, but most others) actually have a slight negative correlation to stocks. In other words, when the bear market is at its growliest, the complicated labyrinth of economic factors that typically coincide with that situation — lower inflation (possible deflation), lower interest rates — can bode quite well for fixed income. They certainly have done so in the past.
The way in which bonds tend to zig when stocks zag (and vice versa) is beautifully illustrated in Figure 13-1, provided by Vanguard Investments.
And also consider Figure 13-2, which shows how stocks and bonds have fared in some of the most exciting (read: volatile) investment years in the past eight decades.
History may or may not repeat
Of course, as investment experts say again and again (although few people listen), historical returns are only mildly indicative of what will happen in the future; they are merely reference points. Despite all the crystal balls, tea leaves, and CNBC commentators in the world, the experts simply don’t know what the future will bring.
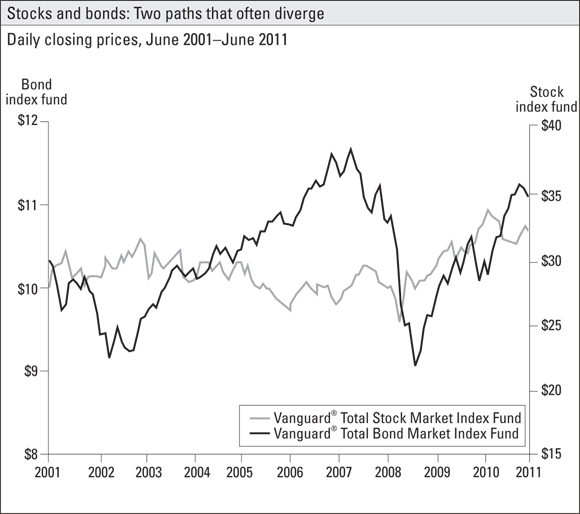
Source: Vanguard, with permission.
FIGURE 13-1: An illustration of how bonds protected investors during the very turbulent stock market of the first decade of the millennium.
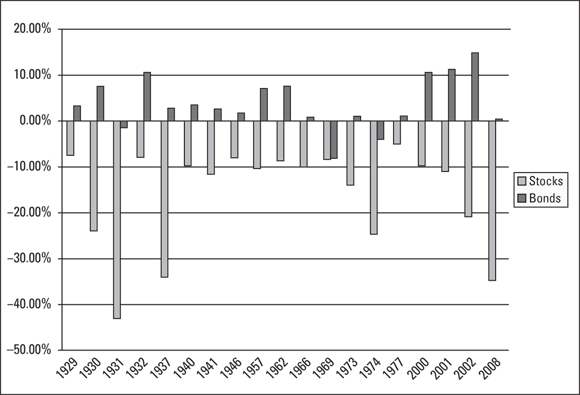
Source: Vanguard, with permission.
FIGURE 13-2: When stocks slide, bonds often do very well.
Although the vast majority of financial professionals use the past century as pretty much their sole reference point, some point out that in the 19th century, stocks and bonds actually had more similar — nearly equal, in fact — rates of return. And perhaps that may be true for the 21st century as well. Time will tell. In the meantime, given all this uncertainty, it would be most prudent to have both stocks and bonds represented in your portfolio.
Tapping into Bonds in Various Ways
Like stocks, bonds can be bought individually, or you can invest in any of hundreds of bond mutual funds or about 250 bond ETFs. The primary reason for picking a bond fund over individual bonds is the same reason you might pick a stock fund over individual stocks: diversification.
Sure, you have to pay to get your bonds in fund form, but the management fees on bond ETFs tend to be very low, as you’ll see later in this chapter. Heck, there is even one broad market bond ETF that can be had at no expense. Conversely, the cost to trade individual bonds can be quite high. That’s especially true of municipal bonds.
I’m not saying that you should not consider ever buying individual bonds. Doing so may make sense, provided that you know how to get a good price on an individual bond (if not, please read my book on that topic, Bond Investing For Dummies, published by Wiley) and provided that you are buying a bond with little default risk (such as a Treasury bond). But for the most part, investors do better with low-cost, indexed bond funds.
Like stocks, bonds can (and should, if your portfolio is large enough) be broken up into different categories. Instead of U.S. and international, large, small, value, and growth (the way stocks are often broken up), bond categories may include U.S. government (both conventional and inflation-adjusted), corporate, international, and municipal bonds — all of varying maturity dates and credit ratings. Unless you’ve got many millions to invest, you simply can’t effectively own enough individual bonds to tap into each and every fixed-income class.
Finding strength in numbers
To be honest, diversification in bonds, while important, isn’t quite as crucial as diversification in stocks. If you own high-quality U.S. government bonds (as long as they aren’t terribly long-term) and you own a bevy of bonds from the most financially secure corporations, you are very unlikely to lose a whole lot of your principal, as you can with any stock. But diversification offers more benefits than just protecting principal. There’s also much to be said for smoothing out returns and moderating risk.
Bond returns from one category of bonds to another can vary greatly, especially in the short run. In 2008, for example, high-yield corporate bonds, as represented by the SPDR Barclays Capital High Yield Bond ETF (JNK), saw a return of –24.7 percent. That same year, U.S. Treasury bonds, as represented by the iShares Barclays 7–10 Year Treasury Bond ETF (IEF), returned 17.9 percent. But the very next year, 2009, was a terrible year for Treasuries; IEF sagged –6.56 percent and JNK shot up 37.65 percent.
By owning a handful of bond funds, you can effectively diversify across the map. You can have Treasuries of varying maturities, corporate bonds of varying creditworthiness, international bonds of varying continents and currencies, and municipal bonds from across the nation. As you’ll see throughout the rest of this chapter, I urge investors primarily to seek safety in bonds. If you’re looking for high returns, go to stocks. The purpose of bonds, as far as I’m concerned, is to provide ballast to a portfolio.
The purposes served by bond funds are to make your bond investing easy, help you to diversify, and keep your costs low. Just as in the world of stock funds, all bond funds are not created equal. Some Treasury funds are better than others. Some corporate bond funds are better than others. Ditto for funds holding municipal bonds and foreign bonds.
Considering bond investment costs
Low costs are even more essential when investing in bonds than they are when investing in stocks. That’s always been the case, but especially when interest rates are as low as they are now, and you must keep your costs low. When (historically, at least over the past century) you’re looking at maybe earning 2.7 percent above inflation, paying 1.3 percent a year for some bond broker or fund company to manage your bond portfolio is going to cut your profits nearly in half…very likely more than half if you are paying taxes on the interest. Do you really care to do that?
As I write these words, interest rates are very low, which means that real interest rates (factoring in inflation, however low) for most bonds are considerably less than 2.7 percent. That fact means paying attention to the cost of your bond funds is more essential than ever.
The most economical bond funds are index funds, and you have a number of excellent index bond ETFs to choose from. Those I highlight in this section include some of the cheapest funds on the planet, which is a reason to like them. You’ll see passing mention of a few funds in this chapter, but the actual list of my faves appears in the next two chapters.
 Although I’m a big proponent of ETFs, I must tell you that the ETF tax edge in the fixed-income arena isn’t nearly as sharp as it is in stocks. The tax efficiency of a bond index mutual fund and a bond ETF are just about the same. The wonderful structure of ETFs that I discuss in Chapter 2 simply doesn’t matter all that much when it comes to bonds. Bonds pay interest — that’s how you make money with bonds — and they rarely see any substantial capital gains. To the extent that they do have capital gains, however, ETFs may have an edge over mutual funds. But that’s generally not going to be any big deal.
Determining the Optimal Fixed-Income Allocation
Okay, now that I’ve given you a few reasons to want to invest in bonds, it’s time to tackle the really tough question: How much of your portfolio should you allocate to bonds? The common thinking on the subject — and I’m not above common thinking, especially when it is right on the mark — is that a portfolio becomes more conservative as its percentage allocation to bonds increases, and as its percentage allocation to stocks decreases.
Of course, that doesn’t answer the $64,000 question (or however much that question would now be worth with inflation factored in): Just how conservative do you want your portfolio to be? Different financial planners use different approaches to arrive at an answer to this question. I feel confident that my approach is best (otherwise, I wouldn’t use it); in the interest of brevity, let me present it in the simplest terms.
Here’s my take: I reckon that stocks are very likely — but by no means certain — to outperform bonds over the next decade or two or three. But as in the past, you will see up years and down years in both markets. The down years in the stock market are the far more dangerous. Bear stock markets, historically, don’t usually last for more than a few years, although some have been particularly brutal and have lasted a decade or more. (Think about the 1930s, the late 1960s to mid-1970s, and 2000 to 2009.)
Yet for most investors over the past 100 years, stocks have paid off handsomely. So it’s a balancing act. Too much in the way of stocks and, should the markets go sour, you risk quick poverty. Too much in the way of bonds and, should consumer prices rise too much, you risk slow poverty as the interest you collect just barely stays ahead of inflation, or not even that, and you are forced to eat into your capital to pay the bills. In this section, I show you how to begin thinking about your own balancing act.
60/40? 50/50? Finding a split that makes sense
The balance between stocks and bonds is usually expressed as “[% stocks]/[% bonds],” so a 60/40 portfolio means 60 percent stocks and 40 percent bonds. The optimal balance for any given person depends on many factors: age, size of portfolio, income stream, financial responsibilities, economic safety net, and emotional tolerance for risk.
In general, I like to see working investors hold three to six months of living expenses in cash (money markets or Internet savings accounts) or near-cash (very short-term bond funds or short-term CDs). Non-working investors living largely off their portfolios should set aside much more, perhaps one to two years of living expenses. Beyond that, most people’s portfolios, whether they’re working or not, should be allocated to stocks (including REITs, which I discuss in Chapter 11), intermediate-term bonds, and perhaps a few alternative investments, such as market-neutral funds and perhaps a sprinkling of commodities (including precious metals).
In determining an optimal split, I would first ask you to pick a date when you think you may need to start withdrawing money from your nest egg. How much do you anticipate needing to withdraw? Maybe $30,000 a year? Or $40,000? If you haven’t given this question much thought, please do! Start with your current job income. Subtract what you believe you’ll be getting in Social Security payments or other pension income. The difference is what you would need to pull from your portfolio to replicate your current income. But most retirees find they need perhaps 80 to 90 percent of their working-days income to live comfortably. (You likely put less in the gas tank, buy fewer lunches out, have lower wardrobe expenses, and pay lower taxes, and hopefully, your house is paid for.)
Take a minute, please. Come up with a rough number of how much you’re going to need to take from your nest egg each year.
Got it?
Whatever the number, multiply it by 10. That amount, ideally, is what I’d like to see you have in your bond portfolio, at a minimum, on the day you retire. In other words, if you think you’ll need to pull $30,000 a year from your portfolio, I’d like to see you have at least $30,000 in cash and about $300,000 ($30,000 × 10) in bonds. That’s regardless of how much you have in stocks — and, with the assumptions outlined previously, you should have at least an equal amount in stocks. (See more on building an adequate nest egg in Chapter 24.)
So here’s the rough rule I’m suggesting (keeping in mind, please, that all rough rules can get you into trouble sometimes): If you are still in your 20s or 30s and want to keep the vast lion’s share of your portfolio in stocks, fine. But as you get older and start to think about quitting your day job, begin to increase your bond allocation with the aim of getting to your retirement date with at least ten times your anticipated post-retirement withdrawals in bonds. Most people (who aren’t rich) should have roughly one year’s income in cash and the rest in a 50/50 (stock/bond) portfolio, more or less, on retirement day.
With at least one year’s living expenses in cash and ten years of living expenses in bonds, you can live off the non-stock side of your portfolio for a good amount of time if the stock market goes into a swoon. (You then hope that the stock market recovers.)
If my rule seems too complex, you can always go with an even rougher rule that has appeared in countless articles. It says you should subtract your age from 110, and that’s what you should have, more or less, in stocks, with the rest in bonds. So a 50-year-old should have 60 percent (110 – 50) in stocks and 40 percent in bonds. A 60-year-old would want a portfolio of about 50 percent (110 – 60) stocks and 50 percent bonds. And so on and so on. This rough rule — even rougher than mine! — may not be bad, assuming that you are of average wealth, are going to retire at the average age, will live the average life expectancy, and expect that the markets will see roughly average performance!
Meet Joe, age 67, with $840,000 in the bank
So let’s consider Joe. He’s a single guy with no kids who figures he’s going to retire in one year. His salary is $65,000 a year ($55,000 after taxes). He has $800,000 in investments. He also has about $40,000 in cash and short-term CDs. He estimates that after Social Security and his government pension, he needs to pull another $24,000 a year out of savings to pay all the bills. It seems to me that Joe can do that and have a very good chance that his money will last as long as he lives. (Chapter 24 explains why.) How much should Joe invest in bonds and how much in stocks?
As a ballpark figure, without knowing much more about Joe (and ignoring for the moment such sticky things as present value and future taxes and Joe’s expected longevity), I’d start by urging Joe to keep the amount he has in cash and short-term CDs (“near cash”) exactly where it is. Then I’d take about $240,000 ($24,000 × 10) of the $840,000 and plunk it into a handful of fixed-income funds that would almost certainly include an intermediate conventional Treasury fund, an inflation-protected bond fund, and a high-quality corporate bond fund, such as, for example, VGIT, along with SCHP and VCIT, all discussed in the remainder of Part 3.
Depending on Joe’s home state and his tax bracket (I didn’t specify how much he’ll be collecting in Social Security and pension benefits), I might also include some municipal bonds. The rest of Joe’s money I would invest in a widely diversified portfolio made up mostly of stock ETFs.
Thus, Joe might be looking at an allocation of $560,000 stocks/$280,000 fixed-income (bonds, cash, CDs), or a 67/33 allocation. Joe also might be a good candidate for an immediate fixed annuity that would guarantee him the $24,000 a year he needs, or a good portion of it. (Important note: Many annuities are financial dogs, and even the best annuities aren’t for everyone. Please see my discussion in Chapter 25.)
A 66/33 allocation might be considered too risky for a 67-year-old. Many retirement models would allocate more to the tune of 50/50 or even be less aggressive than that. I would opt for a more conservative route, too, if Joe didn’t have his secure government pension, which, combined with Social Security, will cover all of his basic needs. Note, too, that I would use 66/33 only as my starting point. After taking all aspects of Joe’s personal circumstances into consideration, including his guaranteed income stream, expected longevity, risk tolerance, and legacy desires (would he be okay with the idea of dying broke?), I might end up suggesting a 60/40 portfolio or perhaps even 50/50. If he were a very conservative fellow, I’d even be okay with 40/60.
Meet Betsy and Mike, age 36, with $30,000 in the bank
Betsy and Mike are happily married. (Yes, happy is important, both from a financial and nonfinancial point of view.) They both work and make decent incomes — enough so that if they needed to, they could live on one income. Betsy works in academia. Mike is a self-employed landscaper and a piano teacher. They have no children. They have no debt. They would like to retire by age 62 and do a lot of traveling.
Betsy and Mike obviously need to accumulate a lot more than $30,000 if they want to retire by their early 60s and travel to anyplace other than nearby Cincinnati. Their situation, I feel, warrants taking about as much risk as any investor should take. I might suggest a 75/25 portfolio or even (if Betsy and Mike were the type of people who could emotionally handle the volatility) an 80/20 portfolio. The 25 or 20 percent in bonds — $7,500 or $6,000 — I might allocate to a total-bond ETF, such as BKAG (discussed in Chapter 14), provided they had room in their retirement plans. If they didn’t have the room in their retirement accounts, I’d look into tax-free muni ETFs, such as VTEB (discussed in Chapter 15).
I can hardly imagine any investor for whom I would want to see any portfolio more aggressive than 80/20 (80 percent stock, 20 percent bonds) or more sedate than 20/80. Here’s why:
- Studies show that 20 percent in bonds doesn’t really lessen a portfolio’s long-term performance all that much. Reason: When the market crashes, as it does every once in a while, you want some “dry powder” (such as bonds) that you can use to take advantage of the opportunity to purchase stock at fire-sale prices.
- Conversely, 20 percent in stocks doesn’t really raise a portfolio’s volatility all that much (and it may even lessen the volatility). Reason: Bond prices tend to drop the most when interest rates rise sharply. Interest rates tend to rise sharply when the economy is humming and stocks are doing well. Zig and zag. When you have no zig, you are more susceptible to heavy zag. And you can quote me on that!