
Chapter 2
Topics
50 Years of Research in Finance
Considerable progress has been made in research into finance over the last 50 years.
During the 1950s, two very fertile areas for research were financial markets and corporate finance.
- In 1952, Harry Markowitz developed his portfolio theory, by demonstrating mathematically that diversification was to the investor's advantage, as it reduced risk for the same level of returns (or improved returns for the same level of risk).
- In 1958, Franco Modigliani and Merton Miller opened up a field of research into corporate finance, by demonstrating that, if markets are efficient, there is no optimal financial structure that will minimize the cost of capital, and accordingly, maximize enterprise.
Since then, huge strides forward have been taken, mainly in the field of capital markets, with a strong emphasis on mathematics, a result of the educational backgrounds of the researchers—Modigliani the economist and Markowitz the statistician.
- In 1964, William Sharpe demonstrated that there are no portfolios that can systematically beat the market, and that the return that should be required on any financial security is linked to the risk-free interest rate and the market risk of the security via the famous ‘beta’ coefficient, thus creating the capital asset pricing model (CAPM).
- In 1970, Eugene Fama elaborated the theory of market efficiency. Since all new information is immediately integrated into share prices, it is impossible to predict future share price movements.
- In 1972, Fisher Black and Myron Scholes introduced the formula used for valuing options which is named after them.
- In 1977, Richard Roll proved that it was not possible to demonstrate that the CAPM was false. However, together with Stephen Ross, he came up with a more general model, the Arbitrage Pricing Theory, which has not, as yet, really taken off.
In the late 1970s, the reintroduction of the human element into economic models that had turned out to be highly reductionist, opened up new areas of research which have proved to be very fruitful:
- Signal theory, based on the work of Stephen Ross, challenges the premise that information is shared by all at the same time and at no cost. He shows that on the contrary, some financial decisions (borrowing, paying dividends, etc.) are not necessarily taken on the basis of their own merits, but in order to pass on new information to the market in a way that is credible.
- Agency theory, based on the work of Michael Jensen, challenges the premise that the company is a black box in which all stakeholders are working together to maximize value for shareholders. Some financial decisions (borrowing, diversifying, listing, distributing dividends, etc.) are not necessarily taken on the basis of their economic convenience, but in order to ensure as much overlap as possible with the interests of shareholders, managers and creditors.
- Finally, in the 1990s, behavioral finance suggested that homo economicus, who constantly minimizes and maximizes everything, is probably a mythical figure. Behavioral finance looks at what impact the factoring in of the partial rationality of the individual has. Richard Thaler and Hersh Sherfin have shown that there are pockets of inefficiency, but that these are not deep enough for arbitrage gains to be made on a systematic and lasting basis.
Ten Deadly Mistakes in Corporate Finance
In both our professional and academic experience we have come across certain mistakes rather frequently. We list some of them below hoping we'll get rid of them once and for all!
1. Believing that Growth in Earnings per Share (EPS) is Equivalent to Creating Value
As it is difficult to measure the value created by an acquisition, share buyback, merger, capital increase, etc., the EPS impact is often used as a measure of value creation. However, there is a link between EPS accretion and value creation, or between EPS dilution and value destruction, only under three conditions. Before discussing them, let's consider a virtual example. Let's imagine that the software company SAP (2006e P/E ratio of 27) has decided to merge with Barclays bank (P/E of 10) on the basis of current share prices. As SAP's P/E is higher than Barclays, its EPS will increase automatically after this transaction, by 88%. Does this mean that the merger has created value, based on this yardstick? Of course not! If there is value creation, it will be due to synergies, and in this case, we don't see much in the way of synergies … Incidentally, looking at things from the other side, i.e. Barclays' EPS, the impact would be completely different: 28%. So when is an improvement in EPS an indicator of value creation?
1. When earnings growth of the merged entity is more or less the same as previously. Clearly, in our hypothetical SAP-Barclays merger, this is not the case: SAP projects 19% earnings growth as a standalone entity, vs. 10% for Barclays. The new group's growth rate would be between the two (given the absence of synergies) and, in this case, 12%. This is not the same as 19%! Please note that the higher SAP expected growth rate in EPS explains its higher P/E ratio.
2. When the risk of operating assets after the merger is more or less the same as before the merger. In our example, this is doubtful. Generally speaking, however, this can be true when two companies in the same sector and with the same positioning merge, Autostrade and Abertis, for example. This is much less true for Mittal (basic steel) and Arcelor (high value steel).
3. When the new group's financial structure doesn't change substantially with the transaction, as this helps ensure that financial risk is the same after the transaction as before. Moreover, it is well known that debt leverage raises EPS but does not create value; otherwise, all companies would have leveraged up long ago and we'd all be rich!
2. Believing that Merger Synergies can be Valued on the Basis of the Average of the Two Companies' P/Es
There are two reasons that can be used for justifying why synergies cannot be estimated using the average P/E of the new group:
1. Synergies announced at the moment of the merger are only an estimate, and the people who have announced them have every interest in giving rather high figures to push shareholders to approve the deal. Moreover, the technical execution of a merger or any other link-up carries its own complications, such as making employees of formerly competing firms work together, creating a new culture, trying to keep from losing clients who wish to maintain diversity in suppliers, etc. Experience shows that more than one merger out of two fails from this point of view and that synergies actually generated are weaker than announced, and take longer to show up.
2. Sooner or later, the merged group has to pass on some of the synergies to its customers, staff and suppliers. M&A tends to come in waves, and competitors will be encouraged to follow suit, in order to generate synergies that allow them to remain competitive. Ultimately, all companies will be able to lower their prices, or refrain from raising them, and it is the end customer who will benefit.
3. Believing that the Debt/Equity Ratio is the Best Measure of Debt-Repayment Capacity
Financial leverage is often used to assess a company's debt level and its ability to meet its debt obligations. However, this approach has become completely archaic! A company does not pay off its debts with its equity but with its cash flow. Even in the event of liquidation, equity provides a cushion of security only if the company is able to sell its assets at their book value, which, in practice, is almost never the case.
If you ask a banker what the highest debt possible for a target company is he or she will surely answer expressed in terms of the net debt/EBITDA or net debt/cash flow ratio, as these ratios are good indicators of a company's ability to generate enough cash flow to pay off its debt.
Unilever, for example, has leverage of more than 130%, which may seem huge. However, when examining the company more carefully, we observe that its net debt is equivalent to just one and a half years of EBITDA!
At the other extreme, Rémy Cointreau has leverage of 0.6, but its debt is equivalent to 3.6 times its EBITDA.
4. Confusing Apparent and Real Cost of a Source of Financing and Comparing the Costs of Financing While Forgetting Differences in Risk
When investment bankers ‘sell’ a convertible bond issue, they always highlight the ‘insignificant’ (or even ‘non-existent’!) cost of this source of financing. Indeed, it is true that companies pay a very low rate of interest on a convertible bond, and its (apparent!) cost of financing is below the risk-free rate.
However, the accounting cost is only an ‘illusion’, as its low level is cancelled out by the ultimate risk of dilution. And CFOs are not usually duped, but it is hard sometimes to resist the temptation of low annual cash costs, especially when the materialization of the risk (i.e. the issue of shares at a price below the current share price, thus leading to shareholder dilution) occurs only years later.
Thus, a distinction should be made between the apparent cost of a source of financing, i.e. the annual cash cost, and its real cost, which includes the entire ultimate cost, including deferred coupons, redemption premium, expected increase in share price, etc.
Moreover, cost of the product must reflect the risk incurred. Obviously, issuing shares has a higher real cost than issuing convertible bonds (the difference can range from 4% to 10%). In buying new shares, the investor hopes for a good return, but the company is under no obligation to pay a dividend or to reimburse the investor. Such flexibility comes at a cost: the company must pay out a coupon and guarantee repayment of the debt.
However, we are not suggesting here that all sources of financing are equivalent and that it doesn't really matter which type is chosen. A convertible bond, for example, can be the best choice for a company whose cash flow is currently small but is expected to grow strongly in the future.
5. Forgetting the Risk to Profitability
This will be obvious to our readers (at least, we hope!), but in light of recent events, it is always worth pointing out. After all, finance is nothing more than risk, return and value. The value of a product can only be determined when risk and required return are known.
When financial markets are doing well, as in 1999 and 2000, investors have an unfortunate tendency to overlook risk. The big losses suffered by equity investors in 2001 and 2002 were merely the materialization of risk. The more a portfolio was invested in TMT stocks, the greater the risk was. The losses suffered were not an injustice, but simply a reminder of common sense.
What is true for investors is also true for companies. Some company treasurers thought they were doing well by investing some of their company's cash in Parmalat commercial paper, which offered much more attractive returns than other Italian industrial companies … and for good reason!
6. Believing that Increasing the Leverage Raises Share Value
Leverage is an accounting reality: if a company carries debt and its return on capital employed (ROCE) is greater than its cost of debt, then its return on equity (ROE) is greater than its ROCE. This leverage formula is based on an accounting tautology and therefore must be correct. From a financial point of view, however, ROCE and ROE are of very limited interest. As they are accounting-based concepts, they do not reflect risk and in no way should they be the company's sole objective. Otherwise, they could lead to unwise decisions.
For it is easy, as we have seen, to improve ROE by leveraging up, but the company then faces greater risk: something that is not reflected in accounting terms. Hence, if ROE increases with leverage, the required rate of return will rise commensurately and no value will have been created.
There are, nonetheless, two special cases where we believe that leverage can actually contribute to the value creation:
1. In an inflationary economy. This was what happened in the 1960s, when debt was a stratagem that was especially well suited to a strong-growth environment. There are two components to this strategy: heavy investment to expand industrial assets and narrow margins to win market share and keep those assets busy. Obviously, ROCE is low (because of low margins and heavy investment), but the debt that is inevitably incurred (because weak margins produce insufficient operating cash flow to cover all investment in the business) results in increased leverage and inflates ROE. This is all the more so when the real cost of debt is low or even negative because of inflation, and creditors are reimbursed with devalued currency. However, ROE is quite unstable and can drop suddenly when growth in the business slows.
This was the strategy used typically by Moulinex and it allowed the company to achieve dominance on its market and to ‘flatten out the learning curve’, but this was also the source of later difficulties. With the beginning of the 1980s and the return to positive real interest rates, i.e. far above the inflation rate, most companies successfully improved their ROE while reducing debt and hence leverage. This is only possible via a strong improvement in ROCE, i.e. by improving asset rotation (e.g. by reducing inventory levels) and profit margins. This has been the strategy of Peugeot throughout the last two decades and more recently of Volkswagen.
2. When using heavy leverage, in particular for companies having been bought out in an LBO. But beware: we are not suggesting that improving ROE through leverage creates value, or that tax savings are a real source of value creation. Heavy debt, however, tends to make managers especially efficient, so that the company can use its cash flow to meet its heavy debt-servicing obligations, at the price of constantly having its back to the wall. It is therefore the improvement in ROCE that creates value.
7. Believing that Raising the Dividend Increases the Value of the Stock
If this was true, companies would long ago have raised their payout to 100% (or even higher) and investors would all be rich and happy!
Mathematical models do not necessarily provide a clear picture right off the bat. In the Gordon and Shapiro model, for example, the value of stock whose dividend grows at a constant rate is:
![]()
Intuitively, it would seem that if the payout rises, the value of the stock should also rise. However, this means forgetting the negative indirect impact on the company, which, having fewer financial resources at its disposal because of its higher dividend, will be forced to curtail its investments and grow more slowly. The two effects end up cancelling each other out, and the value of the stock remains constant.
That said, there appear to be two ways in which raising the dividend can indeed create value:
- If the company increases its dividend to return to its shareholders cash that it does not or no longer needs and that it would otherwise invest at a rate below its cost of capital. This is especially true for cash-rich companies such as Microsoft and GlaxoSmithKline. Scientific studies show clearly that raising the dividend leads to gains in the share price.
- If the company uses this to signal that its economic situation is healthier than the investment community believes. Such a signal is all the more credible as it demonstrates management's confidence in its future, since it has given up a rare and precious resource—cash!
8. Believing that Structuring a Corporate Finance Transaction is Possible Without a Preliminary Complete Financial Analysis
Would a doctor ever write out a prescription without first examining and diagnosing the patient? Would a tailor make a suit without first taking the customer's measurements? Of course not!
Similarly, a financial analysis of the company is the first and essential step of any solid basis of reasoning. To forget this is to end up with a haphazard strategy that would only hit the mark by coincidence.
In our experience novices often recoil in horror before a financial analysis, not knowing where to begin or end. They are likely to make mainly descriptive remarks, without trying to tie them together and check for their internal consistency and without trying to figure out which is the cause and which is the effect.
Financial analysis is not just some vague comments on the P&L, balance sheets or some ratios. Financial analysis is an investigation that must be followed to its logical conclusion and whose parts are not isolated but inter-linked. The main questions financial analysts must answer are these: Does this make sense? Is this consistent with what I've already established, and, if not, why not? Analysts must ask themselves several questions and will seek the answers in an accounting document that they do not comment on as such, but which serves as a source of raw materials.
The analyst is like a modern-day Sherlock Holmes or Miss Marple, on the lookout for a logical chain of events, as well as disruptive elements that could signal problems.
The principle that will guide the analyst in learning and understanding the company is this: ‘creating value requires investments that must be funded and must be sufficiently profitable’.
Indeed, a company cannot long survive if it is unable to attract a steady stream of customers that want to buy its products or services at a given price allowing it to generate a sufficient operating profit.
So the first thing that the analyst must examine is how the company achieves its financial margins. The first thing a company needs is investment in two forms: acquisition of equipment, buildings, patents, subsidiaries, etc., and to build up working capital. And these investments obviously have to be financed, either through equity or through banking or other financial debt.
After studying the three above elements—margins, investments and financing—the analyst can calculate the company's profitability, in terms of ROCE or ROE.
The analyst will then have completed the work and can answer the simple questions that motivated it, i.e. is the company able to meet the commitments that it has taken on with its creditors? Is it able to create value for its shareholders?
9. Believing that Actual Return can Long be Kept above the Required Rate of Return
Economists (and experience) tell us that no such situation is infinitely sustainable. A company's ROCE will sooner or later converge gradually towards its cost of capital. This is the law of diminishing returns. A return that is above the required rate of return, when factoring in risk, will naturally attract competitors or the attention of competition watchdogs (see the Microsoft case). Sooner or later, deregulation and technological progress will make net ROCE vanish. Or, as an old adage says: ‘there are no impregnable fortresses, there are only fortresses that are poorly attacked!’.
True, the real economy is less fluid than financial markets and it takes longer for its efficiency to show up, but in our view, it inevitably does. After all, the returns of Air Liquide and Coca-Cola did indeed converge towards their cost of capital!
10. Believing that Calculation Replaces Reflection
What a fabulous tool Excel is! But what a trap it is for serious reflection!
Mathematicians have made major contributions to finance (through portfolio management, the CAPM, valuing of options, etc.), but finance is not just mathematics. Consider the two following examples:
- Three years ago, the Chinese market traded at an average P/E of 10, a risk-free rate of 5%, and an estimated 5% risk premium. Given the Chinese growth rate (GDP rose 9% in volume in 2007) the above numbers were clearly inconsistent, even though they may have been mathematically correct. Such high growth rates, with a market P/E of just 10 are impossible without the discounting rate being far above the European rate (about 9%), where P/Es were about 17 with weaker growth than in China. In short, the risk premium was financially wrong, even if it was mathematically correct. A discounting rate of about 15% was much more justified, and this is the one that Chinese investors apply themselves to their companies; otherwise P/Es would have been 30 and not 10!
- The beta of a low-cost airline like easyJet or Ryanair is significantly higher than for a mainstream carrier like Air France or Lufthansa, which draw most of their earnings from business passengers. This calculation may be mathematically correct, but what a mistake from a financial point of view! Of the two types of airlines, which is more exposed to the state of the economy? Naturally, the mainstream carrier, whose cash flows accentuate fluctuations in the economy, while those of low-cost airlines are much less exposed.
In short, in finance, constantly keep in mind the Aretha Franklin song: Think.
Five Mistakes in Corporate Valuation
In the current economic climate, we'd like to draw your attention to some mistakes that may have serious consequences for the overall quality of your estimates.
1. The Value of Debt
When calculating the value of capital employed and the value of equity, whether using the DCF method or comparative methods, financial debts must be factored in at their market value and not at their book value.
Most of the time, for companies that are solvent and/or for which market conditions have not changed substantially since their debts were issued, there is little difference between their market and their book value.
Under IFRS or US GAAP, these calculations are easy to do, as companies now provide the estimated value of their debts in the notes to their accounts.
For example, in Figure 2.1 are the values of some groups' bonds that are maturing in 2013, as a percentage of the normal value.
Figure 2.1: Values of groups' bonds maturing in 2013
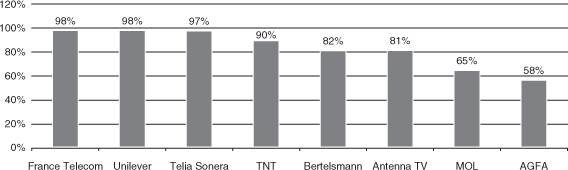
Ford has $154bn in financial debt on its balance sheet, compared with a market value of $122bn, which is a difference of $32bn, six times the group's market capitalization of $5.5bn, and we won't mention the situation at General Motors before its bankruptcy!
2. Debt Beta
Along the same lines, the assumption that the debt beta (β) could be considered as equal to zero (which is the key feature of risk-free debt) should be frequently considered unacceptable.
However, this is one of the assumptions made for calculating the unlevered β using the simplified formula:

Since the full formula is:
where βD is the β of the debt, βE is the equity beta and β the unlevered β. V is the market value of debt and equity.
When a company's capital employed is relatively volatile, and thus risky, and/or it is carrying a lot of debt, part of this volatility is absorbed by the debt.
This explains why the value of the debt can differ from its book value, and accordingly, why the debt β frequently is different from zero.
In these circumstances, assuming that the βD is zero, as frequently happens, can be an error. It results in a generalized undervaluation of the volatility and market risk of the capital employed. Unlevered β is then only determined by the β of equity, as the share of volatility that has been absorbed by the debt has disappeared from the computation.
To illustrate this, we use data from April 2009 to calculate the cost of capital of various groups (Table 2.1), assuming alternatively a zero βD or an estimate of it.
Table 2.1: Cost of capital of various groups
| Group | Unlevered β with βD = 0 | Unlevered β with βD ≠ 0 |
| Enel | 0.38 | 0.48 |
| Lafarge | 1.06 | 1.18 |
| Office Depot | 1.95 | 1.06 |
| Pernod Ricard | 0.84 | 1.92 |
| Stora Enso | 0.72 | 0.90 |
| Valeo | 0.95 | 1.02 |
3. The Risk-Free Rate in Emerging Countries
There are currently countries in which the government borrows at higher interest rates than the most highly rated issuers of corporate debt in the country (Ukraine, for example). This creates a problem when determining the risk-free rate.
In general, the government is assumed (and observed) to issue debt at a rate that is deemed to be the risk-free rate, because the government, unlike private companies and investors, has the power to raise taxes to pay down its debts.
We were recently confronted with this difficulty and we decided to use, as the risk-free rate in our estimates, the rate of interest on a bank loan that was recently granted to a group that was carrying little debt and that had a solid economic model. Even though it wasn't a risk-free rate, it was at least the lowest interest rate in the country in which the group operates.
4. The Pension Deficit and Other Related Issues
It is quite correct to consider the net difference between the value of pension assets and the present value of a company's commitments as an element of net debt. It can even be said to be recommended since the amount of the pension fund provision on the balance sheet is disconnected from economic and financial reality, given the prevailing accounting principles.
However, just because this figure is zero or low, you shouldn't just move rapidly on to the next valuation issue. You should always be suspicious of small differences between two large numbers.
Assets used to hedge commitments are essentially invested in shares, while the commitments themselves have the same quality as bonds. So a small difference between those two amounts could turn into a big gap if the stock market suddenly plummets. It will also have an impact on the βU.
We were recently confronted with the case of a company whose past results and business plan showed little sensitivity to the economic situation, which led us to expect that its βU would be low. However, the calculation, which factored in a small amount of pension deficit net of pension assets, yielded a figure close to one.
Once the nature of the hedging assets was factored in, the βU fell to 0.6. Part of the volatility evidenced by the βE of this company was not explained by the volatility of capital employed, but by the volatility of the portfolio of pension assets made up mainly of shares, structurally financed by debt, like in any good hedge fund!
5. Performance of Equity Betas
If the economic and financial crisis had had the same impact on all firms, the βs would have remained stable.
But, as can be seen every day, the impact has been far greater on some sectors (banking, construction, automobile and aeronautic) than it has been on others (food, health, etc.).
However, as the market β has remained the same, and by construction equal to one, the β of firms that have been less impacted have, on the contrary, fallen (see Table 2.2).
Table 2.2: The β of less impacted companies
| Equity β computed from June 2005 to June 2007 | Equity β computed from July 2007 to June 2009 | |
| Société Générale | 1.32 | 1.57 |
| ADP | 0.57 | 1.02 |
| Peugeot | 0.96 | 1.26 |
| L'Oreal | 0.76 | 0.55 |
| Danone | 0.84 | 0.60 |
Accordingly, if you use a current market risk premium to estimate today's value of a share, as we recommend, it would be a good idea to update your betas!
If you don't, your estimated rate of return will be too low for the riskiest shares and too high for those that are less risky.
With an equity market risk premium that rose from 3% in June 2007 to 6.7% in October 2009, the extra return expected by the shareholders of Danone compared with the risk-free interest rate has increased by 60%, from 2.5% to 4.0%, and nearly tripled for Peugeot, rising from 2.9% to 8.4%.
2.4 M&A: Six Mistakes to be Avoided1
1. Don't Apply the Cost of Capital of the Bidder to the Target Firm
- The cost of capital used in a takeover should reflect the risk of the investment, not the risk profile of the bidding company.
- Risky businesses cannot become safe only because the bidder operates in a safe business!
2. Pay Attention to the Rules of Thumb
- Daily corporate valuation is full of rules of thumb. We believe that the reader would better avoid spending too much time on them, especially after having made tremendous efforts in keeping the estimates as objective and scientific as possible! Here are a couple of examples:
- It is quite common to add ad hoc premiums for brand name control as well as to subtract discounts for liquidity, minority stakes and so on.
- The target company should be considered cheap if it trades at below some prevailing multiples—e.g. seven times EBITDA, 15 times earnings, market values below book values.
3. Don't Go for Cliché
- Through time, acquirers have tried to justify the high premiums paid for their acquisitions using cliché—‘synergies’ during the 1980s, ‘strategic considerations’ in the 1990s and ‘real options’ in the last decade, or a sum of all of them!
- Even if all of the above elements may actually have value, the reader should never forget that their contributions to value creation must be clearly stated and correctly estimated. Corporate valuation and M&A activity are not about dreams!
4. Don't be too Conformist
- It is quite common to justify acquisitions with two arguments:
- A lot of other companies in the same sector are doing acquisitions. External growth is prevailing over organic growth.
- The transactions occurring in the current merger wave represent the key driver of our estimate when valuing possible target companies. Even if our internal ‘traditional’ estimates suggest lower values.
- The mere fact that your competitors are doing bad acquisitions (overpaying for them) is not a good reason to join the group! Your company may be operating in a value destroying sector; thus, differently from what other companies are doing, it may be time for you to consider shrinking and/or to continue focusing the strategy on the internal growth.
5. Don't Let Pride be More Important Than Common Sense
- If companies define their objective in a bidding fight as winning the auction, the bidder will get the best result. But beware the winner's curse (the bidder may end up realizing they have overpaid the target).
- The premiums paid should only reflect expected synergies, control issues and strategic considerations. They should never reflect the self-esteem of the management of the acquiring firm.
- The opinions of banks on the value of the deal are worth nothing. Never forget that investment bankers make their money on the size of the deal and not on its quality.
- M&A is not a ‘macho game’. Managers are frequently too willing to fight out acquisitions with other people's money! And investment bankers are all ready to act as lemmings.
6. In M&A, External Circumstances May be Against the Bidder
- Companies willing to do acquisitions often do so because they need to grow fast (and hopefully at low cost). Although it is true that mature companies can buy rapidly growing firms to push up their earnings, the key issue is always ‘at what price’ this objective can be achieved. If external growth turns out to be expensive, the company is actually destroying value for its shareholders.
- Dont forget that, on average, the stock prices of acquiring firms fall on the date of the acquisition announcement by 3–4%: a remarkable decrease.
- When a company decides to grow through acquisitions of public firms, the chances are against it because it almost always has to pay the market price plus a premium. Think about it: it is not who you buy that determines the final success of an M&A transaction, it is how much you pay for the target. The odds can improve when you grow by buying private companies, where you assess the intrinsic value of the target and you are less likely to fall into bidding wars. In addition, there are real constraints on private firms that may be removed when the takeover occurs.
Rating agencies have clearly gained in importance in Europe in the last 20 years, as shown by the 35% annual increase in the number of companies carrying a Moody's rating.
This is obviously due mostly to the transition of continental Europe from an economy based mostly on banking intermediaries to one where the financial markets are becoming predominant.
CFOs can no longer shield themselves from this additional consideration. Ratings are even becoming one of their main concerns. Financial decisions are taken based partly on their rating impact; or, more precisely, decisions that have a negative rating impact will be adjusted accordingly.
Some companies even set rating targets (e.g. Vivendi Universal, PepsiCo). This can seem paradoxical in two ways:
- Although all financial communication is based on creating shareholder value, companies are much less likely to set share price targets than rating targets.
- In setting rating targets, companies have a new objective: that of preserving value for bondholders! This is praiseworthy and, in a financial market context, understandable, but has never been part of the bargain with bondholders.
We see several possible explanations for this paradox:
- A downgrade is clearly a major event for a company that goes well beyond bondholder information. A downgrade is traumatic and messy and almost always leads to a fall in the share price. Thus, by preserving a financial rating, it is also shareholder value that management is protecting, at least in the short term.
- A downgrade can also have an immediate cost if the company has issued a bond with a step-up in the coupon, i.e. a clause stating that the coupon will be increased in the event of a rating downgrade. Step-ups are meant to protect lenders against a downgrade and obviously make managers pay more attention to their debt rating.
- A good debt rating guarantees some financial flexibility. The higher the rating, the easier it is to tap the bond markets, as transactions are less dependent on market fluctuations. An investment grade company, for example, can almost always issue bonds, whereas market windows close regularly for companies that are below investment grade. The seizing up of the high-yield market over the last few months is quite instructive here, as many issues have had to be postponed. The high-yield market is similar in this respect to the equities market. Under the new Basel II banking solvency standards the highest rated companies will probably have even greater flexibility, as loans to them will require lower reserve requirements and banks will more readily lend to them.
- Some banks sell the concept of lower cost of capital (and, thus, enhanced value) as a function of rating—for example, obtaining the lowest possible cost of capital for a BBB rating. This is based on the tax savings brought about by financing costs but, beginning with a certain level of debt, the savings are cancelled out by the discounted value of the cost of bankruptcy. Readers who know us well know that we are not great fans of this argument. For it seems difficult to maintain that companies rated BBB can be valued significantly higher than others. The average company rating is closer to A, after all, and major groups such as Nestlé and AstraZeneca, which have stable cash flows, do not try to play leverage, preferring to hold onto their very strong rating. Similarly, setting out to obtain the best rating possible is getting things backwards! This minimizes the cost of debt, but so what? If it also requires an exorbitant level of equity, the cost of capital has not necessarily been reduced.
There is a phenomenon that is even more perverse than setting a target rating: refusing to be rated or asking for a confidential ‘shadow rating’.
Being rated can be scary, and CFOs balance out the lack of flexibility created by the lack of rating (e.g. certain investors can no longer be tapped and the bond market is mostly closed off) with the potential lack of flexibility created by a poor rating.
In extreme cases, we have even seen companies that, in their initial rating process, tried to obtain the worst possible rating for their particular financial profile. They have done this in order to gain some flexibility, i.e. some room for their situation to get marginally worse without undermining their rating. In this particular case, caution has a clear impact on value, as a lower rating means higher debt costs. But this is like an insurance premium that always looks too high until an accident strikes.
All in all, the desire of many companies to set a rating target reminds us that financial structure is above all the choice of the level of risk that shareholders choose to run and that the European debt market is becoming a real market with varied, segmented products, offered to investors who need some criteria in making their choices.
Credit scoring is an analytical technique used to assign a rating that has been boosted by the requirements of the Basel II capital requirements for banks.
The basic idea is to prepare ratios from companies' accounts that are leading indicators (i.e. two or three years ahead) of potential difficulties. Once the ratios have been established, they merely have to be calculated for a given company and cross-checked against the values obtained for companies that are known to have run into problems or have failed. Comparisons are not made ratio by ratio, but globally. The ratios are combined in a function known as the Z-score that yields a score for each company. The equation for calculating Z-scores is as follows:
![]()
where a is a constant, Ri the ratios, βi the relative weighting applied to ratio Ri and n the number of ratios used.
Depending on whether a given company's Z-score is close to or a long way from normative values based on a set of companies that ran into trouble, the company in question is said to have a certain probability of experiencing trouble or remaining healthy over the following two or three year period. Originally developed in the USA during the late 1960s by Edward Altman, the family of Z-scores has been highly popular, the latest version of the Z′′ equation being:
![]()
where: X1 is working capital/total assets; X2 is retained earnings/total assets; X3 is operating profit/total assets; X4 is shareholders' equity/net debt.
If Z′′ is less than 1.1, the probability of corporate failure is high, and if Z′′ is higher than 2.6, the probability of corporate failure is low, the gray area being values of between 1.1 and 2.6. The Z′′-score has not yet been replaced by the Zeta score, which introduces into the equation the criteria of earnings stability, debt servicing and balance sheet liquidity.
The MKV firm (bought by Moody's in 2002) also developed its proprietary scoring model founded on an optional approach.
Scoring techniques represent an enhancement of traditional ratio analysis, which is based on the isolated use of certain ratios. With scoring techniques, the problem of the relative importance to be attached to each ratio has been solved because each is weighted according to its ability to pick out the ‘bad’ companies from the ‘good’ ones.
That said, scoring techniques still have a number of drawbacks.
Some weaknesses derive from the statistical underpinnings of the scoring equation. The sample needs to be sufficiently large, the database accurate and consistent and the period considered sufficiently long to reveal trends in the behavior of companies and to measure its impact.
The scoring equation has to be based on historical data from the fairly recent past and thus needs to be updated over time. Can the same equation be used several years later when the economic and financial environment in which companies operate may have changed considerably? It is thus vital for scoring equations to be kept up to date.
The design of scoring equations is heavily affected by their designers' top priority, i.e. to measure the risk of failure for small and medium-sized enterprises. They are not well suited for any other purpose (e.g. predicting in advance which companies will be highly profitable) or for measuring the risk of failure for large groups. Scoring equations should thus be used only for companies whose business activities and size is on a par with those in the original sample.
Scoring techniques, a straightforward and rapid way of synthesizing figures, have considerable appeal. Their development may even have perverse self-fulfilling effects. Prior awareness of the risk of failure (which scoring techniques aim to provide) may lead some of the companies' business partners to adopt behavior that hastens their demise. Suppliers may refuse to provide credit, banks may call in their loans, customers may be harder to come by because they are worried about not receiving delivery of the goods they buy or not being able to rely on after-sales service, etc.
Behavioral Finance: Are Investors Really Rational?
1. Market anomalies: stumbling stones or lightning conductors?
Modern finance is based largely on the assumption that investors are rational people. This assumption has been very useful for simplifying the facts and designing models that have evolved, especially during the 20 years between 1950 and 1970, when IT capacities were far below what they are today. This assumed rationality of all of the players on the market gives rise to the theory of market efficiency. Efficient markets are generally defined as markets on which it is possible for resources to be allocated exactly where and when they are needed and at a lower cost. From a more micro-economic point of view, the informational efficiency of markets has been formulated by Eugene Fama as follows: changes in share prices do not depend on previous prices (low efficiency). All relevant information is taken into account in the formation of prices (semi-strong efficiency) and those holding private information cannot take advantage of it (strong efficiency).
A slew of financial research since the 1960s consisted in testing the efficiency of markets, probably the most tested hypothesis in finance. Some observations seem to contradict market efficiency. The following anomalies have been noted:
Excessive volatility. Common sense lies at the base of the first challenge to market efficiency. How can markets be so volatile? New information on, say, Google does not arrive every second, yet its share price changes from one minute to the next. There would seem to be a ‘noise’ effect that impacts on the basic value of the share.
Dual listed stocks and closed-end fund securities. Dual listed stocks are shares in twin companies that are listed on two different markets, with identical dividend payments. Nevertheless, the prices of the two stocks may differ over a long period. Similarly, the value of closed-end fund securities (made up only of listed stocks) can be listed over a long period at a discount or a premium to net asset value. Standard discounts applied to conglomerates do not explain the size of the discount on certain funds, and even less so the premiums on others! It is interesting to note that these premiums or discounts compared to the intrinsic value can last over the long term, which explains why arbitrage (something simple to implement) becomes complex for any investor that does not have a very long-term investment period.
Calendar effect. Certain studies highlight the fact that returns on financial securities may depend on the day of the week or the month in the year. Stocks seem to perform less well on Mondays than on other days, and returns in January are higher than in other months (this phenomenon is especially true for smaller firms). For each of these observations, reasons that are backed by investor rationality are put forward. Nevertheless, it does appear that the anomalies are not clear enough for profitable arbitrage to be carried out, given the amount of transaction costs.
Weather anomalies. It has been noted that returns on shares are higher when the weather is fine than when it rains. But here again, although the statistics of these observations are significant, they are not a sufficient basis for arbitrage.
Accordingly, there would appear to be a body of evidence that implies that the theory of efficient markets is partially invalid. Eugene Fama, the high supporter of efficient markets, defends the theory doggedly. For him, the observation of anomalies can largely be explained by the methodology used. Fama especially challenges observations of systematic over- or under-reactions of markets noted by other economists.
If we do arrive at the conclusion that the theory of efficient markets is (at least partially) invalid, it then becomes necessary (i) to understand what it was in the initial modeling that did not correspond to reality and (ii) to attempt to develop a new modeling of investor behavior that is closer to reality.
2. Investor behavior
What if the initial assumption underlying modern theory was a false assumption: are investors really rational (i.e. do they act in a consistent manner in order to maximize returns)? Behavioral finance uses an innovative method for testing this assumption. Experiments have been carried out in order to determine the real behavior of investors faced with a choice.
The results of certain psychological experiments can be applied to finance. For example, some tests seem to prove that individuals answer questions put to them by making mental associations or taking short: a number between zero and 100 is chosen at random in front of a sample of people who are then asked to guess whether the number of African countries is higher or lower than the number drawn, and then to guess how many countries there actually are in Africa. It is interesting to note that the average number of countries given by people in the different samples to the last question depends on the initial number drawn. This example demonstrates the fact that investor decisions can be influenced (independently of fundamental choices to be made).
A typology of experiments that is also used to appreciate the attitude of investors to financial products involves giving a sample of individuals a choice between several lotteries (the gains on which are associated with probabilities) with or without a financial risk. Here we see a direct link with psychology. The field of behavioral finance has in fact been developed by financiers and psychologists in tandem. The results of these studies undermine some of the basic assumptions of investor rationality. The following behaviors can be cited:
1. Losses do not have the same weight of gains. Investors seem to prefer taking risks when there is a strong probability of loss (a probability of 50% of losing 100 rather than the certainty of losing 50), but they prefer to plump for a lower gain when the probability is high (certainty of gaining 50 rather than having one chance in two of gaining 100).
2. If the probability gap is narrow, individuals will choose the lottery offering the highest possibility of gain, but if there is a wide probability gap, they will take a close look at the expected gain. This generates a number of paradoxes. It is possible to prefer A to B and B to C, but to prefer C to A. For a financier, this means preferring BNP Paribas to Fortis, Fortis to Mediobanca, but Mediobanca to BNP Paribas! This observation is the sort of thing that can drive an asset manager crazy!
3. Impact on the market
The irrationality of some investors does not really represent a problem if the anomalies can be quickly corrected by arbitrage and if there is a rapid return to efficiency. Additionally, the presence of irrational investors among market players does not necessarily mean that markets are inefficient, especially if the trades made by these investors set each other off, or if rational investors can use arbitrage to bring about a return to balanced prices.
Nevertheless, some of the anomalies we've looked at (dual listing, closed-ended funds) last over the long term, which is proof that the inefficiency of markets cannot systematically be corrected by arbitrage. Some even seem to prove that the market systematically over- (or under-) reacts to some information. The super-performance of a share (or a portfolio) tends to follow on an under-performance, and vice versa.
4. Implications
It's very easy to criticize, but a lot harder to come up with something better. What is important is that we don't throw out the baby with the bathwater, by exploding the theory of markets in equilibrium, with all the consequences that that would entail (no more CAPM, impossible to value financial products).
What we need are suggestions for a more complete framework for finance. Existing models put forward by economists are, in our view, of partially limited use in their current state (especially for corporate finance). They focus on the first line of reasoning: model the behavior of investors in order to determine whether they get anything useful out of it and to identify how they understand financial products. This is just the first step in the reconstruction of a model, which goes as far as the valuation of shares. So, we're not quite there yet. But Rome wasn't built in a day and we'll keep a close eye on developments in the field of behavioral finance, waiting with some impatience for the direct applications thereof to corporate finance.
Investors are human beings, not computers, and are thus sensitive and irrational, and that's the way it should be. Can we model irrationality without making it disappear? And if behavioral finance manages to do that, won't it be a sort of pyrrhic victory?
But while we wait, we'd like to draw a quick parallel with physics. The theory of gravity remains valid, even though it has been proved to be defective at both the macro and micro level, by the theory of relativity and quantum theory. So we'll just soldier on for another few years with the theory of markets in equilibrium as our guide, at the risk of appearing old-fashioned, but our rational opinion is that this is a risk worth taking!
References and Further Reading
Chan, H. and Singal, V., Role of speculative short-term sales in the price formation: the case of the week-end effect, Journal of Finance, April 2003.
Hirshleifer, J. and Shumway, F., Good day sunshine: stock returns and the weather, Journal of Finance, June 2003.
www.behaviouralfinance.net, this site provides a very comprehensive list of all of the research on the subject and includes a large number of articles.
Micro-finance: Helping the Poor
The aim of all financial systems is to facilitate relationships between agents who have surplus capital at their disposal and agents in need of capital. It has been demonstrated that this function improves the general well-being of any society. On the whole, banks and financial markets fulfill this role very well by providing financing and/or investment opportunities to large numbers of corporations and ordinary people, especially in countries with Western-style economies, but also in countries such as China, Turkey and the Gulf States.
Like any organization, financial markets and banking systems have running costs (customer solicitation, analysis of loan applications, structuring of loans, providing of funds, management of repayments, bad debts and disputes). When these costs rise above a certain threshold, the intermediation service they cover becomes prohibitively expensive—we know of one financial intermediary that was asking for a fee equivalent to 80% of funds raised in an IPO of a firm with sales of €1.6m on the Paris OTC market!
So, there will always be some economic agents, the very poorest, who are de facto excluded from the official financial system which is just not interested in them. The paradox is that they are probably no less solvent in real terms than other borrowers and additionally, a portfolio of loans to the poor would be more diversified, and thus less risky for investors. Muhammad Yunus, the founder of the Grameen Bank in Bangladesh, who was awarded the 2006 Nobel Peace Prize, has provided concrete evidence to confirm this.
It is true that the emergence of credit scoring techniques, followed by on-line borrowing over the Internet have helped to lower the breakeven point on loans, but there is a level below which the market system just cannot go. Also, not everyone has access to the Internet or to a long list of credit references.
Given this situation, the emergence of a financial system specifically tailored to meet the needs of potential borrowers who have always been ignored by the traditional financial system was inevitable. It is known as micro-finance. Originally, micro-finance was a specifically created financial system and not an extension of traditional services offered by banks. Banks had, in fact, always wrongly assumed that very poor borrowers would have a much higher than average loan default.
Micro-finance is thus aimed at people who do not have access to traditional financial systems, in other words, at the very poorest members of society. This definition covers a large section of the population in emerging economies as well as the most underprivileged members of Western societies. Micro-finance works on the basis of the same logic as the traditional system. The difference lies in the size of the loans granted. The average amount of a micro-loan in Asia or Africa is around €300 (and can be for as little as €10), in eastern Europe it is usually just over €1000 and in western Europe around €2500.
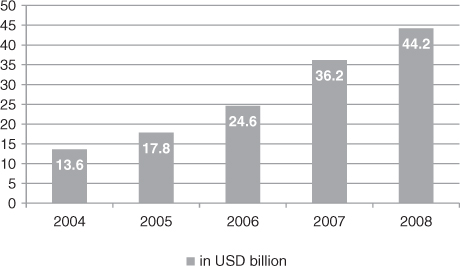
There are over 1275 micro-finance institutions (MFIs) in the world that provide financing to over 100 million homes (source: Micro-finance Information Exchange, figures are from 10,000 institutions and 130 million borrowers according to PlaNet Finance). The sector is experiencing strong growth (Figure 2.2), with a ten-fold increase in the number of borrowers in ten years.
Figure 2.2: Growth in micro-finance volume worldwide. Source: Microfinance Information Exchange (MIE)
Micro-loans are generally used to finance small investments made by small businesses or rural homes. Loans are generally very short term (a protection for lenders) but may be renewed, with the possibility of larger loans for responsible borrowers who meet their repayments. Borrowers often organize themselves into solidarity groups, which enables them to guarantee the repayment of the loan.
Obviously, micro-finance does not purport to be able to solve all of the economic problems of emerging countries on its own. It is not the responsibility of MFIs to finance the infrastructure that is necessary for a country to develop. Micro-finance should thus complement other development initiatives. It is, however, undeniable that micro-finance helps to improve the living conditions of the very poorest members of society and to kick-start economic development.
The relationship between development aid and micro-finance is not that clear cut and defining micro-finance within traditional finance is not all that easy either. Even though recovery rates are very high (compared with recovery rates on traditional loans), operating costs of MFIs are, per euro lent, obviously much higher than for traditional loans:
- the number of loan applications to be processed is much larger;
- provision of services is more complicated (widely dispersed populations, etc.).
So, notwithstanding relatively high interest rates (although much lower than interest rates charged by money-lenders and usurers), very few MFIs are profitable (around 200). A lucky thing it is then that most MFIs are not-for-profit organizations (associations and foundations)!
Most MFIs are financed by entities which are not required to be economically profitable such as governments (development agencies, etc.), international organizations (EU, World Bank, etc.) or NGOs (see Figure 2.3). Traditional banks moving onto the micro-finance market generally have to sacrifice some of their profits which they justify on the grounds of corporate responsibility and ethics.
Figure 2.3: MFI financing. Source: Micro-finance Information Exchange (MIE)

As some countries develop economically (this is especially the case in Latin America), MFIs are becoming more profitable and some even go as far as changing their status from not-for-profit organizations to traditional banks.
We could well see a natural shift from micro-finance to traditional finance and from traditional finance (banks) to micro-finance. Even though there are clearly links between the two, we do not believe that such a shift would be either natural or desirable.
Any attempt to be more profitable will have contradictory effects on the micro-finance sector:
- greater financial efficiency for players, greater access to resources and accordingly greater involvement; and
- the solicitation of a more profitable client base (which will be more urban), with average loans for higher amounts, which would deny a section of the population access to financing.
Even though attempts to achieve a certain financial independence (covering costs with interest made) could be a goal which would guarantee the continued existence of the system, the future of micro-finance is not to become part and parcel of the traditional finance system. Its future is to plow its own furrow by sticking to its initial aims and by continuing to assist individuals in a meaningful way to ‘enrich themselves through their work and their savings’ (repaying a loan is a form of saving). Thanks to micro-finance, poorer clients can now hope that one day, they'll be able to gain access to the traditional financial system with all of its advantages, although they will of course also have to accept all of its unavoidable running costs. In the long term, the best proof of the success of micro-finance will be its disappearance, when it eventually runs out of clients. Unfortunately, we may have to wait quite a while yet until that happens.
Project financing is used to raise funds for large-scale projects with costs running into the hundreds of millions of euros, such as oil extraction, mining, oil refineries, purchase of methane tankers, the construction of power plants or creation of works of art.
Lenders base their decision to extend such financing on an assessment of the project itself rather than the borrower, and on the projected cash flows generated by the project that will repay the credit. They rely on the project's assets as collateral for the debt.
This type of financing was first used in the early 1930s by American banks to extend financing to oil prospectors who could not offer the guarantees required for standard loans.
The banks drew up loan contracts in which a fraction of the oil still in the ground was given as collateral and part of the future sales were set aside to repay the loan.
With this financial innovation, bankers moved beyond their traditional sphere of financing to become more involved, albeit with a number of precautions, in the actual risk arising on the project.
But it is all too easy to become intoxicated by the sophistication and magnitude of such financial structures and their potential returns. Remember that the bank is taking on far more risk than with a conventional loan, and could well find itself at the head of a fleet of super oil tankers or the owner of an amusement park of uncertain market value. Lastly, the parent company cannot completely wash its hands of the financial risk inherent to the project, and banks will try to get the parent company financial guarantee, just in case.
When considering project financing, it is essential to look closely at the professional expertise and reputation of the contractor. The project's returns and thus its ability to repay the loan often depend on the contractor's ability to control a frequently long and complex construction process in which cost overruns and missed deadlines are far from rare. Project financing is not just a matter of applying a standard technique. Each individual project must be analyzed in detail to determine the optimal financing structure so that the project can be completed under the best possible financial conditions.
The financiers, the future manager of the project and the contractor(s) are grouped in a pool taking the form of a company set up specifically for the project. This company is the vehicle for the bank financing.
Clearly, project financing cannot be applied to new technologies which have uncertain operating cash flows, since the loan repayment depends on these cash flows. Similarly, the operator must have acknowledged expertise in operating the project, and the project's political environment must be stable to ensure that operations proceed smoothly. Only thus can investors and banks be assured that the loan will be repaid as planned.
Risks on large projects arise during three quite distinct stages:
- when the project is being set up;
- during construction; and
- during operations.
Contrary to appearances, risks arise as soon as the project is in the planning stage. Analyzing a major project can require several years, considerable expertise and numerous technical and financial feasibility studies. All this can be quite costly. At this stage, the actors involved are not sure that the project will actually materialize. Moreover, when there is a call for tenders, the potential investors are not even sure that their bid will be retained.
But, of course, the greatest risk occurs during construction, since any loss can only be recouped once the facilities are up and running!
Some of the main risks incurred during the construction phase are:
- Cost overruns or delays. Such risks can be covered by a specific insurance that can make up for the lack of income subject to the payment of additional premiums. Any claims benefits are paid directly to the lenders of the funds, or to both borrowers and lenders. Another method is for the contractor to undertake to cover all or part of any cost overruns and to pay an indemnity in the event of delayed delivery. In exchange, the contractor may be paid a premium for early completion.
- Non-completion of work, which is covered by performance bonds and contract guarantees, which unconditionally guarantee that the industrial unit will be built on schedule and with the required output capacity and production quality.
- ‘Economic upheavals’ imposed by the government (e.g. car factories in Indonesia or dams in Nigeria) and arbitrary acts of government, such as changes in regulations.
- Natural catastrophes that are not normally covered by conventional insurance policies.
As a result, the financing is released according to expert assessments of the progress made on the project. Risk exposure culminates between the end of construction and the start of operations.
At this point, all funds have been released but the activity that will generate the flows to repay them has not yet begun and its future is still uncertain. Moreover, a new risk emerges when the installations are delivered to the client, since they must be shown to comply with the contract and the client's specifications. Because of the risk that the client may refuse to accept the installations, the contract usually provides for an independent arbitrator, generally a specialized international firm, to verify that the work delivered conforms with the contract.
Once the plant has come on stream, anticipated returns may be affected by:
- Operating risks per se: faulty design of the facilities, rising operating or procurement costs. When this occurs, the profit and loss account diverges from the business plan presented to creditors to convince them to extend financing. Lenders can hedge against this risk by requiring long-term sales contracts, such as:
- take or pay: these contracts link the owner of the facilities (typically for the extraction and/or transformation of energy products) and the future users whose need for it is more or less urgent. The users agree to pay a certain amount that will cover both interest and principal payments, irrespective of whether the product is delivered and of any cases of force majeure;
- take and pay: this clause is far less restrictive than take or pay, since clients simply agree to take delivery of the products or to use the installations if they have been delivered and are in perfect operating condition.
- Market risks. These risks may arise when the market proves smaller than expected, the product becomes obsolete or the conditions in which it is marketed change. They can be contained, although never completely eliminated, by careful study of the sales contracts, in particular the revision and cancellation clauses which are the linchpin of project financing, as well as detailed market research.
- Foreign exchange risks, usually eliminated by denominating the loan in the same currency as the flows arising on the project or through swap contracts (see above).
- Abandonment risk, which arises when the interests of the industrial manager and the bankers diverge. For example, the former may want to bail out as soon as the return on capital employed appears insufficient, while the latter will only reach this conclusion when cash flow turns negative. Here again, the project financing contract must lay down clear rules on how decisions affecting the future of the project are to be taken.
- Political risks, for which no guarantees exist but which can be partly underwritten by state agencies.
Corporate Finance in Europe: Confronting Theory with Practice
Many studies have highlighted the fundamental differences between the structure and organization of markets and financial systems in the USA and Europe.
Stretching the stereotype, we could say that in the USA, market relationships are usually between a wide shareholder base and managers, while in Europe the tendency is more towards privileged relationships between dominant institutions and large controlling shareholders, often members of the company's founding family.
These differences have major repercussions in terms of corporate governance, and ultimately, on the development of financial markets in these countries. They are also likely to have significant repercussions on the financial practices of companies in Europe and in the USA. A team of Dutch researchers carried out a study on a sample of European companies, seeking to add to an American study. The results they obtained on a sample of 313 responses returned by the Finance Directors of UK, Dutch, German and French companies confirm our received ideas of how corporate finance is practiced. The main results of the research are discussed below.
The authors noted that the European companies that responded to their survey did not all have the same goals, with goals differing from country to country. British and Dutch companies all gave great importance to shareholder value as a decision-making criterion, while far fewer French and German companies saw shareholder value in this light.
The favorite investment decision-making criterion of the majority of European Finance Directors is the payback criterion. This criterion does not factor in the time value of cash flows or cash flows after the date on which the investment is recovered. In the USA, the payback criterion was only ranked third, behind IRR (internal rate of return) and NPV (net present value). The dominance of this investment decision-making criterion in Europe is more pronounced in smaller companies, in companies with older senior managers who have not done MBAs, and in unlisted companies.
Among the companies basing their investment decision-making on NPV criteria, European companies mainly use the CAPM (capital asset pricing model) for calculating the cost of capital, although not quite as often as their US counterparts. Here again, large companies and listed companies rely on this method more often than other companies.
European companies, like their US counterparts, rarely consider risk factors that are specific to the investment projects in question, such as interest rate risk, foreign exchange risk, etc. Only French companies, and to a lesser degree German ones, say that they adjust the discounted cash flow rate to recent stock market performances and to the risk of fluctuations in the price of raw materials. Finally, European companies only make minor adjustments to the cost of capital required for international projects, which goes against the theory and against common sense.
The authors also looked at choices of capital structure (debt to equity ratio) made by the financial directors of European companies. They looked at the relevance of the two main theories on which decisions relating to capital structure are based. The first is the static trade-off theory, which postulates that each company has a target capital structure which depends on tax advantages relating to debt and bankruptcy costs. The second is the pecking order theory which suggests that, as a result of information asymmetry between managers and the capital markets, companies have an order of preference for the various sources of capital for financing their investment projects. Internal resources are preferable to debt, which in turn is preferable to equity.
European companies, and especially French and British companies, would appear to set an optimal target capital structure slightly more frequently than their US counterparts. Furthermore, the criteria generally relied on for setting a target capital structure (debt-related tax breaks, bankruptcy costs) would not appear to have such a tangible influence on determining the optimal capital structure in the USA. The results obtained provide only a little support for the trade-off theory in Europe.
The pecking order theory would appear to be rejected in Europe, in the same way that the US study showed it was in the USA. The behavior of European finance directors reveals a preference for internal sources of financing relative to debt and equity.
The underlying motivation for this behavior is not linked to information asymmetry between managers and capital markets, but the determination to hold onto the company's flexibility and its ability to finance its investments autonomously. This should not come as much of a surprise to our readers.
More or less stating the obvious, the authors show that the larger the companies, the greater their preoccupation with the creation of shareholder value, and the more they will rely on sophisticated methods for their investment decision making, aware that arguments in favor of a choice of financial structure based on tax considerations have never been very convincing.
Capital Markets: Some Useful Definitions
Book-building
Book-building is a technique used to place securities on the market. It is the process whereby the bank marketing the offering gets to know investors' intentions regarding the volumes and prices they are prepared to offer for the security.
Bought deal
A bought deal takes place when a bank buys the securities from the seller or issuer and then re-sells them to investors. The remaining unsold securities go onto the bank's balance sheet. Bought deals are used most often for transactions such as block trades of already existing shares or a bond issue.
Claw-back
A claw-back clause allows the securities allocated to one class of investors to be reallocated to other classes of investors, should the structure of actual market demand (retail, institutional, etc.) differ from that planned originally.
Flow-back
Flow-back is the excessive sale of securities immediately after their placement.
Greenshoe
A greenshoe is an option granted by the seller or issuer to the bank to buy at the price of offering a number of supplementary shares over and above the number offered to investors.
Lock up
A shareholder who has sold a large number of shares or a company which has issued new shares is frequently required not to proceed with a supplementary sale or issue of shares for a given period called the lock up period. Most of the time this lasts between three and nine months.
One-on-one
Private meetings between the CEO or the CFO of a company and one of its (large) shareholders or potential investors are one-on-ones. Most of them take place during road shows.
Overhang
Overhang is a problem caused by fear that the arrival of a large number of shares on the market will depress the share price.
Road show
A road show is a meeting of the company's management with potential investors. It usually takes place as a part of a placement of a company's securities.
Warm up
Warm up sessions are meetings of investment banks with investors to test the latter's sentiment. Warm up meetings are especially important when the size of an issue is large.
Transaction Multiples: Before and During the Crisis2
We have examined the effects of the current economic and financial crisis on transaction multiples. The aim of the analysis is threefold:
1. to assess to what extent multiples are affected by crisis, assuming that corporate transactions should generally occur at a lower price during a downturn and multiples be consequently lower;
2. to highlight if crisis produces differentiated effects in various countries and financial systems;
3. to test if multiples are also affected by the circumstance that companies may or may not be listed on stock markets.
Sample composition
We have examined two years: 2006 and 2008, unanimously considered, respectively, as an expansion and a depression year. We have used three enterprise value (EV) transaction multiples: EV/Sales; EV/EBITDA; EV/EBIT. These multiples are: among the most frequently employed; frequently available for troubled and young companies; relatively difficult to manipulate and not as volatile as net earnings multiples.
We have considered only European countries with a minimum number of 25 annual transactions for both years: France, Germany, Italy, Netherlands, Spain and UK. They have been divided into two groups, according to the financial system: bank-based system (France, Germany, Italy and Spain); market-based system (Netherlands and UK). Table 2.3 summarizes the sample characteristics.
Table 2.3: Sample criteria
| Time period | From 1/01/2006 – 31/12/2006 and from 1/01/2008 – 31/12/2008 |
| Countries | Buyer: EURO – Area |
| Target: France, Germany, Italy, Netherlands, Spain, UK | |
| Min number of annual deals per country | 2006 – 25 |
| 2008 – 25 | |
| Deal type | Acquisition, Institutional buyout, MBI, MBO, Merger |
| Sector | Financial sector is excluded |
| Percentage of stake | Final stake min = 5 max = 100 |
| Percentage of acquisition | Listed companies: min 2% |
| Private companies: min 5% |
The final sample comprises 511 deals in 2006 and 457 in 2008.
Deal multiples by country
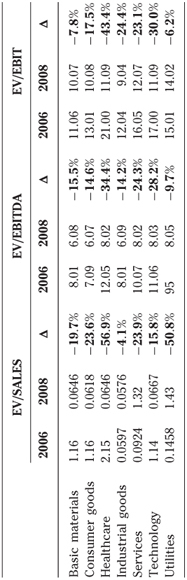
Table 2.4 provides evidence of the deal multiples by country and by financial system.
Table 2.4: Deal multiples by target country

The results show a decrease of the median values of the multiples from 2006 to 2008. The trend is generalized and does not substantially change with the different multiples used (–22.4% for EV/SALES, –13.7% for EV/EBITDA and –18.6% for EV/EBIT). Almost all countries behave similarly, with the sole exception of the increasing EV/Sales in the UK and the EV/EBITDA and EBIT in Spain.
The downward trend is evenly spread among the seven sectors considered in the analysis (Table 2.5). The results show that the decrease is generalized and characterizes all the sectors: mainly healthcare (–43% of EBIT multiple) and technology (–30%), to a lesser extent utilities (–6.2%) and the basic materials (–7.8%). It is interesting to note that investors seem to penalize more mildly sectors with stable growth, lower volatility of earnings changes, lower R&D and incidence of intangible assets (utilities and basic materials, as well as consumer goods). These elements are consistent with the idea that investors become risk-averse during downturns, thus penalizing more intensely companies whose strategic and business risk are relatively high.
Table 2.5: Deal multiples by target sector
Deal multiples and target turnover
The sample has then been divided into seven classes according to the turnover of the target firm, with the aim of exploring to what extent multiples change with the size of the target company (Table 2.6). Each class of values contains an adequate number of firms (the minimum being discretionary set at 25 transactions).
Table 2.6: Number of deals by target turnover (€000)
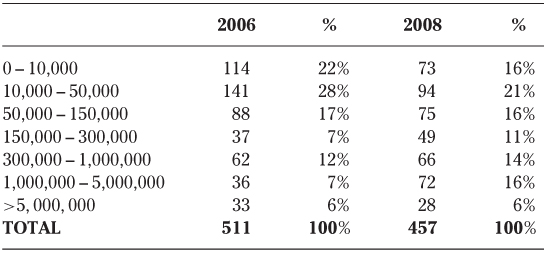
While in 2006 the two smallest size classes contain the highest number and frequency of transaction (together covering 50% of the entire sample of transactions), class density changes in 2008, because the number of transactions involving bigger targets increases substantially (the three top classes covering 36% of the entire sample). The shift toward bigger transactions could be at least partially explained with a ‘flight to safety’ of the M&A activity in downturns. During a crisis, investors generally increase their risk aversion and become more reluctant to consider risky transactions like small deals. Ceteris paribus, the bigger the size of the target company, the lower the riskiness of the potential deal tends to be. Bigger companies have higher market shares, are more diversified, have more bargaining power with stakeholders (clients, suppliers) and are generally less leveraged than small companies. All elements that, in turmoil, are positively considered by equity investors.
An additional factor concerning big size deals is provided in Table 2.7, where it can be observed that the bigger the target size the higher the ‘discount’ applied by the market. If we consider the EV/Sales of the two biggest dimension classes, the discount applied on bigger scale transactions is in fact substantially higher than the one applied on smaller deals.
Table 2.7: Deal multiples by target turnover
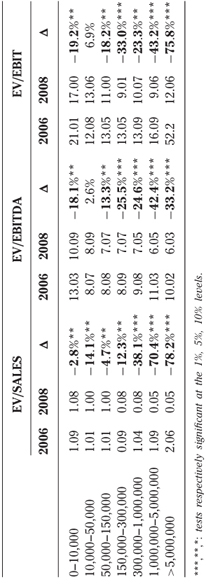
A possible reason for this behavior is probably given by the high difficulty of financing big deals during a credit crunch, in turn forcing the need to offer an economic incentive in terms of lower multiples. This rationale is particularly grounded in this crisis, which has determined a dramatic credit squeeze for companies and investors, thus also reducing the possibility of structuring transactions involving the acquisition of relevant equity stakes of big companies.
The evidence of a ‘big size discount’ effect is further reinforced if we consider the content of Figure 2.4. It contains the regression analysis of the EV/EBITDA for 2006 and 2008 against the logarithm of the target turnover, and it has the aim of checking the statistical significance of the relationship between multiples and deal sizes.
Figure 2.4: EV/EBITDA by target turnover
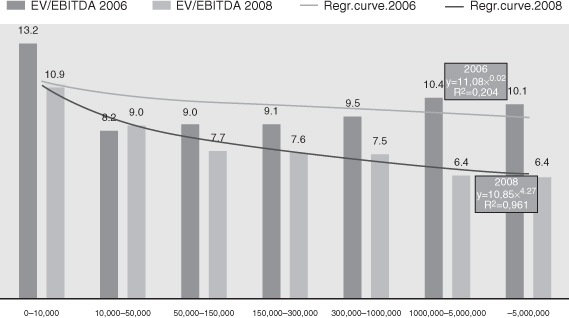
The regression line (and equation) shows that multiples were strongly affected by the size of the target company in 2008, while this effect was weaker in 2006. A possible interpretation is that investors could become more selective in choosing their target during a crisis, penalizing small deals (which occur at higher multiples) while favoring big deals (carried out at lower multiples). In times of stock market frenzy, conversely, the market euphoria could push investors to be less selective and/or the credit market to offer investors more resources for financing bigger scale transactions (thus reducing the need of a size discount on big deals).
Deal multiples and stock market listing
An additional objective is to examine to what extent multiples are also affected if the target is either a listed or privately held company. The assumption here tested is that transactions involving privately held companies could be penalized more intensely during a crisis, by applying to them a higher discount because of their lower liquidity. Liquidity could in fact be a key element of the transactions especially during downturns, as investors perceive the difficulties arising when investing in companies whose shares cannot be freely traded on a stock market.
Table 2.8 shows that the sample of transactions is balanced between listed and unlisted companies and the frequency of these two classes does not change from one year to the next.
Table 2.8: Target ownership status
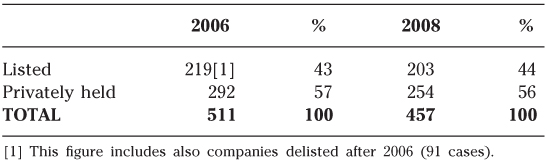
As shown in Table 2.9, EV multiples have decreases for both groups of companies. However, it is possible to observe that multiples of listed companies decrease less markedly than those of private companies (–0.4% vs. –28.5% for the EBITDA multiple). A similar behavior occurs for the other two multiples considered in the analysis, the EBIT multiples and the Sales multiple). The first one decreased, in fact, by 36.3% for unlisted versus 0.5% for listed, while the second decreased by 6.9% and 49.5% respectively.
Table 2.9: Deal multiples by target status
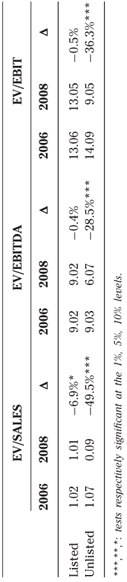
The Making of an Investment Banker
Share price performances can have a major impact on the wealth of investment bankers, many of whom have gained firsthand experience of this rather unpleasant fact as a result of the current economic crisis. But they can also have a long-term impact on their careers, and on the careers of students who are planning to enter the investment banking business. Paul Oyer (2008) of Stanford University has shown how market conditions over the period during which students are doing their MBAs modify the career decisions of those students. He has based his results on a survey of several thousand Stanford MBA graduates in the 1980s and 1990s.
Going straight into investment banking after completing an MBA has a long-term effect on the career of the young graduate. The probability of staying in investment banking is 73% higher than for a graduate who started his or her career in another business (consulting, entrepreneur, retail bank manager, etc.).
There are two possible explanations for this phenomenon:
- One is born an investment banker, i.e. some people are pre-disposed to investment banking and have a love and/or talent for it. Obviously, more natural-born investment bankers are likely to start out working in finance and will wish to stay in the business for as long as possible.
- One becomes an investment banker through experience. Good market conditions lead students to take more finance courses while they're at university or business school, and then to start their careers in investment banking, which means that early on, they develop the specific qualities that are needed to work in this field.
The results of Oyer's study argue in favor of the second explanation. When share prices are performing well, students who do not necessarily have a particular interest in or talent for finance are often attracted by the lure of money (investment bankers' earnings are far higher than average earnings in other sectors during such periods). If only natural-born investment bankers were to enter the field, such opportunistic students would switch fields as soon as there was a downturn in the cycle. Those who start out in investment banking when share prices are performing badly would be ‘true’ investment bankers, attached to their chosen field. Statistics show, however, that this is not the case. Those who start out in investment banking are just as likely to stay in the business, regardless of market conditions when they started their careers.
The study confirms that more students take finance courses when market conditions are favorable. Additionally, students who already have some experience of finance before starting their MBAs are more attached to the business than others. Oyer concludes that it is through experience that one becomes an investment banker. Initial choices made by students have long-term consequences on their careers, and these choices are influenced more by the economic situation at the time they are made than by any innate qualities.
Not only do market trends during the period that future investment bankers are studying have a lasting influence on their careers, they also have an impact on their discounted wealth. A Stanford MBA graduate working in finance for six to ten years was paid, over the period of the survey, $15,814 per week, which is three times as much as Stanford MBA graduates working in other sectors earned. Oyer suggests that students beginning an MBA at a prestigious university or business school should hedge against a fall in share prices over the time it takes to complete their studies. Spoken like a true investment banker!
References and Further Reading
Oyer, P., The making of an investment banker: stock market shocks, career choice, and lifetime income, Journal of Finance, 63, 2601–2628, 2008.
To improve your knowledge on the financial markets take a look at:
International Investments, B. Solnik and D. McLeavey, Addison Wesley, 2003.
A Random Walk Down Wall Street, B. Malkiel, Norton & Company, 2011.
Options, Futures, and Other Derivatives, J. Hull, 8th ed. Prentice Hall, 2011.
Corporate Financial Distress and Bankruptcy: Predict and Avoid Bankruptcy, Analyze and Invest in Distressed Debt, E. Altman and E. Hotchkiss, 3rd ed., John Wiley & Sons, 2005.
Triumph of the Optimists: 101 years of global investment returns, E. Dimson, P. Marsh and M. Staunton, Princeton University Press, 2002.
The Equity Risk Premium: The Long Run Future of the Stock Market, B. Cornell, John Wiley & Sons, 1999.
Discover the fundamentals of financial theory in:
Financial Theory and Corporate Policy, T. Copeland and F. Weston, 4th ed., Addison Wesley, 2004.
Capital Ideas: the improbable origins of modern Wall Street, P. L. Bernstein, John Wiley & Sons, 2005.
Beyond Greed and Fear: Understanding Behavioral Finance and the Psychology of Investing, H. Shefrin, Oxford University Press, 2007.
Value at Risk: The New Benchmark for Managing Financial Risk, P. Jorion, 3rd ed., McGraw Hill, 2006.
To perfectly master financial analysis, read:
Financial Accounting, D. Alexander and C. Nobes, 3rd ed., Prentice Hall, 2009.
Corporate Financial Reporting, H. Stolowy, M. Lebas and Y. Ding, 3rd ed., Cencage Learning, 2010.
IFRS 2010: Interpretation and Application of Internationl Accounting and Financial Reporting Standards, B. J. Epstein and A. Mirza, John Wiley & Sons, 2010.
Valuation: securities analysis for investment and corporate finance, A. Damodaran, 2nd ed., John Wiley & Sons, 2006.
Valuation: measuring and managing the value of companies, T. Koller, M. Goedhart and D. Wessels, 5th ed., John Wiley & Sons, 2010.
Discover the corporate finance strategy in:
Going Public: Everything You Need to Know to Take Your Company Public, J. Arkebauer, Dearborn financial publishing, 1998.
Takeovers, Restructuring, and Corporate Governance, F. Weston and M. Mithcell, 4th ed., Prentice Hall, 2003.
Real Options: A Practictioner's Guide, T. Copeland and V. Antikarov, Texere, 2003.
Creating Value from Mergers and Acquisitions, S. Sudarsanam, 2nd ed., Prentice Hall, 2010.
The Synergy Trap, M. L. Sirower, Free Press, 2007.
Dividend Policy: Its Impact on Firm Value, R. C. Lease et al., Oxford University Press, 2000.
The New Financial Capitalists: Kohlberg Kravis Roberts and the Creation of Corporate Value, G.P. Baker and G. Smith, Cambridge University Press, 1998.
Buyout: The Insider's Guide to Buying Your Own Company, R. Rickertsen, R.E. Gunther and M. Lewis, Amacom, 2001.
Or simply read research articles in finance:
Corporate Governance: An International Review
European Finance Review
European Financial Management
European Journal of Finance
Financial Analysts Journal
Journal of Accounting and Economics
Journal of Applied Corporate Finance
Journal of Business, Finance and Accounting
Journal of Corporate Finance
Journal of Finance
Journal of Financial Economics
Journal of Fixed Income
Review of Financial Studies
1. The Dow Jones has got back to its historic highs of 2000 but the EuroStoxx 50 has not yet managed to do so because:
- US firms are doing better than European firms
- The Dow Jones does not reflect fluctuations in its market capitalization as accurately as the EuroStoxx 50 does
- The Dow Jones does not include any technology, media and telecom (TMT) firms
2. SEPA stands for:
- System for European Payment Advances
- Société Européenne Par Action
- Single Euro Payments Area
3. The net debt to EBITDA ratio at the start of an LBO is:
- always below 5x
- always above 6x
- varies depending on the sector
4. The margin required by banks on the Tranche A of a senior debt in an LBO is generally:
- between 175 and 225 basis points
- above 250 basis points
- below 150 basis points
5. To qualify for listing on the London Stock Exchange, a firm must:
- be headquartered in the UK
- have a share capital of at least €1,000,000
- have financial records going back two years
6. When adjusting capital employed to equity, a firm's net debt on its seasonal activity corresponds to:
- net debt on December 31
- net debt on June 30
- average net debt over the year
7. According to Modigliani and Miller, increasing the gearing ratio:
- changes the WACC
- does not change the WACC
- increases the cost of equity and the WACC
8. Under IFRS, inventories should be valued:
- using the LIFO method
- using the FIFO method
- using the identified purchase cost method
9. In Islamic finance:
- in theory, interest at a fixed rate cannot be charged on a bank loan
- in theory, the interest rate on a bank loan must be fixed
- in theory, the duration of a bank loan should not exceed seven years
10. In the consolidated financial statements of a listed German company:
- goodwill must be booked as a fixed asset and depreciated over a maximum of 40 years
- goodwill must be booked as a fixed asset and written down if necessary
- goodwill is systematically set off against shareholders' equity
11. The value of a put option rises:
- if the exercise price is low
- if the volatility of the underlying asset is low
- if interest rates are low
12. What percentage of bank loans do banks in Europe sell on, directly or indirectly, to institutional investors?
- Less than 20%
- Around 40%
- Over 60%
13. EVA stands for:
- European Value Appraisal
- Enterprise Value Added
- Economic Value Added
14. Company A, with a P/E ratio of 12 acquires Company B on the basis of a P/E ratio of 25. The acquisition is fully financed using debt at 3% after tax.
- This acquisition will have no impact on Company A's EPS
- This acquisition will be accretive to Company A's EPS
- This acquisition will dilute Company A's EPS
15. A firm carrying debts with an overvalued share price can create value for its existing shareholders:
- by buying up its own shares at market price
- by carrying out a capital increase
- by buying up its own shares at a premium to the market price
16. The weighted average cost of capital of a diversified company is:
- identical for each of its divisions
- specific to each division and each geographical region
- the same regardless of geographical region
17. An increase in the share of debt in the financing of a company:
- reduces the cost of equity
- raises the company's breakeven point
- lowers the beta coefficient of its shares
18. A company is more sensitive to changes in the economic situation if:
- it is a long way from breakeven
- its fixed costs (as a proportion of total costs) are high
- it is carrying little debt
19. Who said ‘you can never spoil your shareholders enough’?
- John D. Rockefeller
- Albert Frère
- Warren Buffett
20. Which of the following shares do you expect to be more volatile?
- Cisco
- Imperial Tobacco
- BNP Paribas
21. The interest rate curve in the USA is currently:
- relatively flat
- sharp and rising
- sharp and falling
22. The vertical integration of a company within its sector:
- has no impact on its working capital requirements
- reduces its working capital requirements
- increases its working capital requirements in relation to sales
23. The yield to maturity on a loan with an interest rate of 6% paid quarterly will be:
- 6%
- 6.14%
- 6.66%
24. The leverage effect cannot be computed if the company has negative net debt.
- True
- False
- Partially false, because it depends on the level of interest rates
25. If the spot exchange rate is €1=$1.2700, if the three-month interest rate on the dollar is 5.30% and if the three-month interest rate on the euro is 3.60, then the forward dollar/euro exchange rate is:
- 1.2647
- 1.2753
- 1.2725
26. A tag along clause enables:
- a lender to enjoy the same guarantees as those granted to another lender on a subsequent loan
- a minority shareholder to sell his or her shares at the same price as the majority shareholder
- a majority shareholder to force minority shareholders to sell their shares when he or she sells his or hers
27. The equity risk premium in Europe is around:
- 3%
- 4.5%
- 6%
28. In an LBO, the second lien is:
- more risky than the senior debt
- more risky than equity
- never used
| Questions | Answers |
| 1 | 3 |
| 2 | 3 |
| 3 | 3 |
| 4 | 1 |
| 5 | 3 |
| 6 | 3 |
| 7 | 2 |
| 8 | 2 |
| 9 | 1 |
| 10 | 2 |
| 11 | 3 |
| 12 | 2 |
| 13 | 3 |
| 14 | 2 |
| 15 | 2 |
| 16 | 2 |
| 17 | 2 |
| 18 | 2 |
| 19 | 2 |
| 20 | 1 |
| 21 | 1 |
| 22 | 3 |
| 23 | 2 |
| 24 | 2 |
| 25 | 3 |
| 26 | 2 |
| 27 | 2 |
| 28 | 1 |
1. If there is no corporate income tax, cash flow depends on the depreciation policy. Why?
2. If corporate income tax is payable, cash flow depends on the depreciation policy? Why?
3. The ability of a firm to repay its debts is first of all measured by its ability to generate free cash flows. Why?
4. If the purchase of a 10% stake in another firm is financed by short-term bank borrowing, working capital will change.
5. The book value of a 100% fully consolidated subsidiary is equal to the book value of its equity plus goodwill not yet depreciated if any. Why?
6. The ratio financial debt/equity does not measure the liquidity a firm. Why?
7. If there is no corporate income tax, the leverage effect of debt does not exist. Why?
8. The closer the firm is to its breakeven point, the more sensitive are its profits to changes in sales.
9. Negative working capital and no cash or cash equivalent on the balance sheet means the firm is engaged in financial intermediation.
10. Profitability is equal to the income divided by the capital invested to produce this income.
11. An increase in value added does not affect working capital. Why?
12. A financial director does not create value. He or she just shares the wealth created by the firm among investors (shareholders and lenders) that provided the firm with its financial resources.
13. Higher indebtedness results in a … beta coefficient? Why?
14. Higher fixed costs result in a … beta coefficient? Why?
15. Are you speculating when you buy risk-free bonds?
16. Arbitrage is impossible without liquidity.
17. Diversification reduces risk but also eliminates the opportunity to cash in on a sudden rise in a share price.
18. Arbitrage serves no useful purpose.
19. If the required rate of return is met, the funds available to a firm are unlimited.
20. The risk of a well-diversified portfolio with a beta coefficient of 2 is twice as high as the market risk.
21. If the market capitalization of a firm is higher than the book value of its equity, can we say that the firm is overvalued? Why?
22. If the market capitalization of a firm is higher than the book value of its equity, can we say that its beta is higher than 1? Why?
23. If the market capitalization of a firm is higher than the book value of its equity, can we say that the firm is extremely profitable? Why?
24. If the market capitalization of a firm is higher than the book value of its equity, can we say that the accountants forgot something? Why?
25. If the market capitalization of a firm is higher than the book value of its equity, can we say that the markets are inefficient? Why?
26. In a securitization transaction, does a firm transferring its assets to an SPV run any risk should these assets be insufficient to cover the debts of the SPV?
27. In the area of off balance sheet financing, is the predominance of form over substance a feature of IAS or US GAAP?
28. Under IAS norms, can a firm consolidate another firm, in which it does not own a single share?
29. Should long-term debt and long-term rental contracts be treated the same way?
30. What do you think of the following: non-fraudulent off-balance sheet financing fools only those who want to be fooled?
1. If there is no corporate income tax, the depreciation policy does not influence the cash flow position, because the depreciation charge is just an accounting entry.
2. If corporate income tax is payable, cash flow is indirectly influenced by the depreciation policy, because the depreciation charge, a purely accounting entry, reduces the taxes due.
3. Even if the elements of working capital are short term (usually a few months, hence liquid), they are renewed permanently; hence, the working capital is permanent.
4. This operation is purely financial and it does not impact on operating activities. In particular, it has nothing to do with inventories, payables, and receivables.
5. True. By construction.
6. This ratio measures only the relative weight of debts in all sources of funds. Liquidity is best measured by the current ratio which is the ratio of short-term assets to short-term liabilities. It checks that short-term assets (less than one year) are bigger than short-term liabilities and hence allow debts to be paid off in due course, thanks to the progressive monetization of current assets.
7. The leverage effect exists whenever there is a difference between return on capital employed and the cost of debt. Taxation increases the leverage effect by reducing the cost of debt.
8. A firm close to its breakeven point shows very small profits. Hence, an increase in sales will translate in a considerable increase in profits. Profits being close to zero, any increase will seem considerable.
9. Financial intermediation consists of financing long-term investments with short-term borrowings. Negative working capital means that assets with maturities longer than one year are not fully covered by liabilities due in more than one year and are thus financed by short-term liabilities, at least partially. This is financial intermediation.
10. Don't mix up margin with profitability. Margin is income divided by sales or production. Profitability is income divided by capital invested.
11. If the percentage of value added in sales increases, this means that the firm passes the product through more transformation stages, that it buys its raw materials at an earlier stage of the value chain and sells its goods at a later stage of the value chain. It means that inventories decrease, payables are smaller (the firm now buys less from its suppliers) and receivables are bigger (the firm now sells more to its clients). Hence, working capital increases.
12. The financial director cannot influence operating profits, which depend on the quality of assets only. His or her role is to distribute this profit among the various providers of funds, which financed these assets.
13. Higher indebtedness increases financial expenses and raises the firm's breakeven point. Profits will be less stable; hence, the share price will become more volatile (= increase in beta).
14. Higher fixed costs raise the firm's breakeven point. Profits will be less stable; hence, the share price will become more volatile (= increase in beta).
15. When you buy risk-free bonds (meaning there is no risk that the issuer will default), you are potentially speculating on a fall in interest rates. Such a fall would raise the price of your bonds.
16. An arbitrage is composed of several transactions that must be done simultaneously. Liquidity is thus necessary.
17. By diversifying your portfolio you eliminate the specific risks and run the market risk only. Therefore, profits from a sudden rise in a share price will be diluted in the overall performance of your portfolio.
18. It guarantees that the markets are always in equilibrium.
19. At least in theory. Still, it is necessary to have enough sufficiently profitable industrial projects to absorb all these funds!
20. The total risk breaks up into a market risk related to the beta coefficient and into a specific risk. This specific risk can be eliminated, especially in a well-diversified portfolio that we have here. Therefore, the only remaining risk is that of the market. This residual risk is twice as high as that of the market, since the beta coefficient of the portfolio is equal to 2.
21. It simply means that its return on equity is higher than the rate of return required by its shareholders.
22. It simply means that its return on equity is higher than the rate of return required by its shareholders. It has nothing to do with the beta.
23. It simply means that its return on equity is higher than the rate of return required by its shareholders.
24. It simply means that its return on equity is higher than the rate of return required by its shareholders.
25. It simply means that its return on equity is higher than the rate of return required by its shareholders. It has nothing to do with the efficiency of the financial markets. However, it shows that the industrial markets are less efficient than financial markets, because over certain periods, industrial markets can offer abnormally high returns.
26. No, the SPV is protected by insurance. In general an insurance technique is put in place to cover this risk.
27. US GAAP. American norms are based on rules, international norms (IAS) on principles.
28. Yes, if it exerts economic control.
29. Yes.
30. It is true. The notes to the accounts give enough information to avoid being fooled by non-fraudulent schemes. The notes are produced to be read!

Horizontal
1. Difficult to keep them constant in the current environment.
2. Tours that take CEOs and CFOs of listed companies to London, Edinburgh, Geneva, Paris, Boston and New York once or twice a year.
3. Provided too much credit enhancement so that most of them are now bankrupt or in bad shape.
4. Only Fidel Castro believes it has a role in the current financial and economic turmoil.
5. Financial divisions that do not create value.
6. Weapon of mass destruction according to Warren Buffett.
7. Has lost his bonus and sometimes his job too.
8. Some countries are lamenting their failure to adopt it as their currency earlier but it's too late now!
9. If you were …… . on real estate you will have lost a pretty large amount of money!
10. Life would be a lot more serene today if they'd never existed.
11. The opposite of unfair.
12. Return on investment.
13. The yield … .. is now steep, with the right slope to help bankers restore their margins.
14. Could have succeeded in ousting the CAPM but never became very popular with professionals.
15. No longer a bad word, especially in the UK.
16. If you do not … .., you will not find, except of course if you just stumble onto it.
17. …… . is king.
18. A British economist who married a Russian dancer and who is once again back in favor.
19. 7 usually does more than one per day.
20. You cannot do without it when computing the value of a share using a P/E ratio.
21. Same as definition 7.
22. Finance is all about it.
23. Has considerably increased for car manufacturers since the end of 2008.
24. We now know that it can be plentiful and then vanishes in a matter of days if not hours.
25. Until mid 2007, the sky seemed to be its only limit. Now people are treating it with more caution.
26. You should at least be able to keep it when your house is seized because you have stopped paying your monthly payments on your subprime loan.
27. Have plenty of work ahead of them.
28. Return on assets.
29. Sale of unexercised warrant
30. With 62, one of the two main culprits responsible for the current situation.
31. What most stock prices are now.
32. An option or a phone conversation.
33. Could it do a worse job?
34. They take place once a year, generally at this time of the year.
35. Single Euro Payment Area.
36. They are being progressively replaced by IFRS.
37. If you're on the dole then you're no longer on it.
38. This is what the Vernimmen is all about!
39. Earnings before interest, tax, depreciation and amortization.
40. Most non US groups are listed in the USA through them.
41. Adjusted Net Asset Value.
42. In three words; the best investment choice criteria.
Vertical
43. Will rise from the dead, just like Jesus did, but it will take more than three days!
44. Cannot go bankrupt but has clearly failed.
45. Was very much sought after when markets were up but proved to be illusory when markets turned down.
45. Same as 41.
46. A very regular guy who turned out to be a crook.
47. So are you if you have lost everything on the stock market including your shirt.
48. A booming area.
49. A barbarian relic according to 18.
50. They have so poorly performed recently, especially on structured products, that they have been deprived of their first N; two words.
51. The P/E ratio is one of them.
52. When I learned that most of my assets were placed with Madoff, I decided to drown my sorrows by drinking a whole bottle of it!
53. Useful for speculating, hedging or for arbitrages.
54. Widely used to compute the cost of equity or the cost of capital.
55. The one between Daimler and Chrysler was a disaster and ended up being unraveled.
56. A Spanish car trademark or the asset of a stockbroker.
57. The American equivalent of the AMF, CONSOB, CNMV or FSA.
58. If at end of the summer of 2008 you were …… on volatility you made a killing!
58. Enterprise Resources Planning.
59. Same as 14, created by Stephen Ross.
60. Computed in London and widely used in banking worldwide.
61. Has dramatically increased over the last 18 months but the impact of its increase on borrowers was mitigated by interest rate falls.
62. With 29, one of the two main culprits responsible for the current situation.
63. Cannot be increased forever without increasing risk taken.
64. A worthy successor to Nick Leeson even if he didn't bring his bank down.
65. Return on capital employed.
66. The option market in London.
67. Measure the market risk of an asset.
68. Companies are always reluctant to cut it but sometimes they simply have to in order to save cash.
69. Same as 51.
70. Has unwillingly illustrated that there may be exceptions to the ‘too big to fail’ rule even if everybody regrets it now.
71. Net Asset Value.
72. Same as 8.
73. No longer as popular with managers as before mid 2007.
74. Some companies are merging to achieve the right. …
75. A product that allows you to exchange a fixed rate for a floating one, a dollar for a euro, etc.
76. Net Operating Profit After Tax.
77. Most asset managers say they are pursuing it, very few deliver it constantly.
78. If you focus too much on this then you forget all about risk, and you are dead.
79. The missing brother of ROI, ROCE and ROA.
80. Can be normal, inverted or flat; two words.
81. Return On Equity.
1 This topic has been written by Massimo Mariani, Associate Professor of Corporate Finance, Jean Monnet University, Italy.
2 This topic has been written by Massimo Mariani, Associate Professor of Corporate Finance, Jean Monnet University, Italy.