
CHAPTER
16
Monitoring and Tuning Oracle VM Servers
Once the virtual machine environment has been configured and deployed, it should be monitored and managed to provide an efficient and well-performing system. An overloaded Oracle VM server and I/O subsystem result in a poorly performing virtual environment, which in turn results in unhappy customers and users. There are two parts to tuning and monitoring the virtual environment: monitoring and tuning Oracle VM servers and monitoring and tuning the virtual machines themselves. This chapter covers monitoring and tuning Oracle VM servers.
Performance Monitoring
Performance monitoring can be done via Oracle Enterprise Manager Cloud Control and several tools that are available within the Oracle VM system. Remember, the domain-0 (dom0) system is not a normal virtual machine, though it has some of the properties of a virtual machine. For example, running top, sar, or vmstat (Linux monitoring utilities) in dom0 only provides statistics for dom0 itself. To determine what is happening on the entire Oracle VM server, you must use other utilities. Let’s look at a couple examples.
Running top (Display Top Linux Tasks) in dom0 gives you information on the dom0 system only. You can see this in Figure 16-1. In this figure, top shows a system with 12 CPU cores and 3214404k (3GB) of total system memory. The VM server used in this example actually has 120GB of RAM and 12 CPU cores. What Figure 16-1 reveals is the performance and resources that have been allocated to dom0.

FIGURE 16-1. Example of running top in dom0
By using xm top (a Xen command), you can gather information from the hypervisor and display it within dom0. The information from xm top in Figure 16-2 shows five domains: dom0 and four virtual machines. In addition, the summary information at the top of the display gives configuration information for the entire Oracle VM server with 120GB of RAM and 12 CPUs. The xm top command is one of several xm commands that provide performance and configuration information.

FIGURE 16-2. Running the xm top command in dom0
You can use most of the xm commands to manage the Oracle VM server, but there are several that you can use to monitor the Oracle VM guests, including the following:
![]() xm list Lists the virtual machines.
xm list Lists the virtual machines.
![]() xm top Displays performance usage of virtual machines.
xm top Displays performance usage of virtual machines.
![]() xm uptime Displays the uptime of all the virtual machines on the Oracle VM server.
xm uptime Displays the uptime of all the virtual machines on the Oracle VM server.
In addition to the xm commands used for monitoring, a number of xm commands provide specific information about devices and resources, including the following:
![]() xm vcpu-list Lists the virtual CPUs (VCPUs) for domains.
xm vcpu-list Lists the virtual CPUs (VCPUs) for domains.
![]() xm info Provides information on the Oracle VM Server system (not dom0). This command provides information about the resources available to dom0 and the hypervisor. (xm info output is shown later in this section.)
xm info Provides information on the Oracle VM Server system (not dom0). This command provides information about the resources available to dom0 and the hypervisor. (xm info output is shown later in this section.)
![]() xm log Prints the Xen error log.
xm log Prints the Xen error log.
![]() xm block-list Lists the block devices for the virtual machines.
xm block-list Lists the block devices for the virtual machines.
![]() xm network-list Lists the virtual machine networks and their MAC addresses.
xm network-list Lists the virtual machine networks and their MAC addresses.
Examples from some of the commands are provided in the upcoming sections. These commands are useful for monitoring the Oracle VM server and the virtual machines. In addition to these commands, you can also monitor from within the virtual environment, but monitoring within the virtual machine only gives you performance and resource utilization from the perspective of the virtual machine itself and does not provide information on the entire environment.

CAUTION
Statistics gathered from a virtual machine itself (including dom0) are, by their very nature, not accurate because a virtual machine is only allocating a part of the actual resources. For example, within the virtual machine, it might appear that the CPU is 100 percent busy, but that 100 percent might be physically only 50 percent of the CPU. Therefore, be skeptical of any statistics gathered from within the virtual machine itself.
The xm top Command
As mentioned earlier in this chapter, the xm top command shows a different perspective. In the upper part of the screen, the resources for the entire Oracle VM server are listed, as shown in Figure 16-2. You can see the number of domains (including dom0) and what state they are in, as shown here. In addition, the memory and CPU information reflects the entire VM server, not just dom0.

Below the information about the Oracle VM server, you’ll see information on each of the virtual machines, including information on how much activity is happening in that particular domain. Note that this information includes dom0 as one of the domains.

The xm top command is very useful for finding out which domains are the busiest and contributing the most to the Oracle VM server’s load.
Unfortunately, the domain name is truncated; therefore, all of the virtual machines appear to have the same name. You might be able to correlate by using the NET field and xm list.
Also note that although Domain-0 is allocated all of the CPUs, it is only allocated a small amount of memory.
The xm list Command
The xm list command lists the virtual machines that are currently running, how much memory they are allocated to use, the number of virtual CPUs, the state, and the length of time that they have been running. This output is shown here:

The xm list command does not show significant information about system performance, but it does provide a quick way to determine which virtual machines are running and how many resources have been allocated to each.
The ID is important when coordinating with other xm commands, because the name may or may not be truncated in those outputs. Also take note of the number of virtual CPUs as well as the amount of memory allocated to the VM. Domain-0 has access to all the CPUs, but as a virtual machine it’s not allocated very much memory. Oracle has carefully given Domain-0 what it needs to do the job optimally.
The xm uptime Command
The xm uptime command does not provide significant information and is redundant with xm list, but with less information. The xm uptime command basically lists how long each virtual machine has been running, as shown here:

As you can see, this command only provides minimal information.
The xm info Command
The xm info command provides a great deal of information about the Oracle VM server:

This command does not provide specific performance information, but it can be used to provide significant information about the resources used by the system as well as about the system’s configuration.
The xm vcpu-list Command
The xm vcpu-list command provides information about CPU allocation and affinity, which can be useful in determining which physical CPUs a virtual CPU is running on. This command will be shown in further detail later on in this chapter in the section “Tuning Virtual Machines.” The xm vcpu-list command is shown here:

This command also gives the CPU time accumulated by the virtual machine, not the clock time that the virtual machine has been running. This is an especially important view when considering CPU pinning, also known as hard partitioning. In this example, you can see where the virtual CPUs from each of the VMs share the same physical CPUs in some cases, and in other cases they might be alone on a physical CPU. Note that CPU Affinity shows that the virtual CPUs can run on any physical CPU. If CPU pinning or hard partitioning were used, you would see virtual CPUs locked down to specific CPUs. This is shown later in the chapter.
The xm log Command
The xm log command is simply a shortcut to the Oracle VM server console log. Running this command prints the Xend log (/var/log/ovm-consoled.log) to the screen. Beware: the log can be quite long. This command prints out /var/log/ovm-consoled.log, but really the more important log is going to be /var/log/ovs-agent.log. There is not a command to print out this log.
The xm block-list Command
The xm block-list command lists the virtual block devices that have been allocated to a domain. The xm block-list command requires a domain name to be passed to it. This domain name is a long, hexadecimal name that was generated by OVM.
Find the domain number using xm list. Then run xm block-list 1, for example. Domain names can get long and confusing in Oracle VM 3 because it sets each domain name to a unique number rather than a name, as was done in previous versions.

The xm block-list command provides some information but is usually not that helpful to the OVM administrator.
The xm network-list Command
The xm network-list command lists the virtual network devices that have been allocated to a virtual machine, including the MAC address of the virtual adapter, as shown next. This command can be very useful for troubleshooting network problems, configuring DHCP, and so on. It also uses the OVM-generated name of the virtual machine.

Most of these commands provide information only and not performance data; however, some of this information can be useful when tuning the system. You might find more information by using the brctl command, as will become evident in the next sections.
Tuning the Oracle VM Server System
There really isn’t a lot that you have to tune in the Oracle VM Server system. In fact, as you will see, tuning the Oracle VM Server system actually involves monitoring and adjusting the resources rather than tweaking parameters and settings. The Oracle VM Server system is based on Xen, with Oracle enhancements, and as such is set up and ready to go when installed. Dom0 is based on a stripped-down version of Linux that Oracle calls a “Just enough OS” (JeOS). The next few sections provide tips on tuning the OS, network, and I/O subsystem. In this case, OS tuning includes not only software (Linux and Oracle VM tuning) but also hardware. The out-of-the-box OVM system is typically tuned well enough. It is unusual that you will need to make any changes.
Tuning the OS and CPUs
From a software perspective, there really aren’t any OS tuning changes that can be made. In fact, making changes to the OS should only be done after careful consideration because it could cause more harm than good. Hardware tuning at the OS layer consists of CPU and memory. As shown earlier in this chapter, you can monitor memory and CPU utilization via several Xen commands, such as xm top. If additional memory and/or CPUs are needed, you can add them (depending on your current hardware configuration).
You can do a few things at the virtual machine level to tune the CPUs. Virtual CPUs can run on one or more physical CPUs. The physical CPUs are the actual hardware running on the Oracle VM server, whereas the virtual CPUs are the CPUs that are seen by the virtual machine. The virtual machine’s virtual CPUs can run on one or more physical CPUs. Oracle VM allows virtual CPUs to be pinned to physical CPUs. This gives you a lot of control over how the system resources are used. This topic is covered in the Oracle whitepaper “Hard Partitioning with Oracle VM Server for x86,” which can be found at http://www.oracle.com/technetwork/server-storage/vm/ovm-hardpart-168217.pdf.
When you’re configuring a VM to use multiple CPUs, it is important that the CPU core or thread that is being allocated to the virtual machine resides on the same CPU socket (if possible). The CPU socket is the actual CPU chip. A core is a CPU within the CPU, and a thread is a portion of a core. The more you can keep things together, the better.
In order to determine which CPU thread is on which core and which CPU (and node if using non-uniform memory access, or NUMA), you can run xenpm get-cpu-topology. This will provide information on the core, socket, and node for each CPU. An example is shown here:

As you can see, there are two sockets with six cores each. Note that hyperthreading is not turned on. Here is an example with hyperthreading enabled. Notice that there are two CPUs per core (not all rows are shown).

You have a few ways to allocate CPU resources: by using the xm vcpu command, by configuring the vm.cfg file, and by using ovm_vmcontrol (part of the OVM Utilities). Each of these methods is described in this section, but using ovm_vmcontrol is the preferred method. Remember that only the vm.cfg file and ovm_vmcontrol utility methods are permanent. If the Oracle VM server were to restart, all changes made with xm commands will be lost.
NOTE
Only ovm_vmcontrol is supported for CPU pinning. It is covered here as well as in Chapter 15. Also note that live migration is not supported with hard partitioning unless you are using an Oracle Private Cloud Appliance (PCA).
Pinning CPUs Using xm vcpu Commands
Three commands are used to configure CPU affinity on a live system. These commands are xm vcpu-list, xm vcpu-pin, and xm vcpu-set. Each command serves a slightly different purpose. These commands for pinning vCPUs have been replaced by the use of the OVM Utilities, which is the preferred way of managing hard partitioning.
NOTE
Any changes made using the xm cpu commands are lost when the virtual machine is restarted.
The xm vcpu-list command lists the virtual machines (domains) and their current CPU settings. This command takes the domain ID as an optional qualifier. If the domain or set of domains is not provided, all of the domains on the system will be displayed, as shown here:

Optionally, you can provide a domain ID as a qualifier. In this case, the xm vcpu-list command provides only CPU information about the requested domain. This command as well as others can be qualified by either the name or the ID of the virtual machine. Each provides an equivalent output.

Notice in this example that the four virtual CPUs allocated to the domain named 4590_pvtest2 are configured to run on any of the physical CPUs in the system.
To pin a virtual CPU to a physical CPU, use the xm vcpu-pin command. The syntax is as follows:
![]()
For example, to pin the four virtual CPUs just shown on physical CPUs 2, 3, 7, 9, and 10, you would use the following commands:

NOTE
You would want to pin all CPUs, not just a few, as was done in this example.
Use the xm vcpu-set command to limit (set) the number of virtual CPUs that a domain can see. The number of VCPUs can be decreased from the limit that’s originally set, but it cannot be increased above that number.
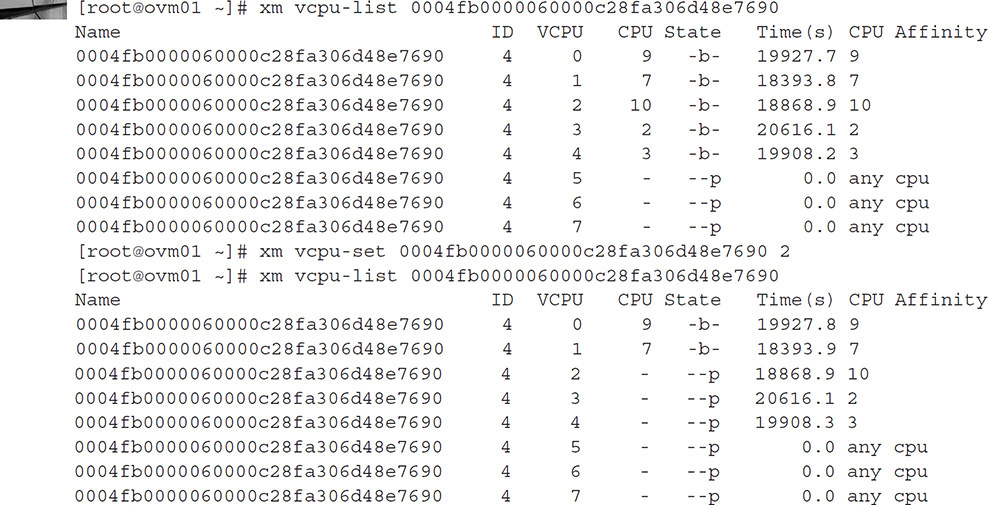
You can then re-enable the virtual machine by using the xm vcpu-set command again, but this time with the number of CPUs set to 4:

Using CPU affinity can be a good way to prioritize specific virtual machines. Note that it is possible (and likely) to have two virtual CPUs sharing the same physical CPU. In fact, with xm vcpu-pin, you can set all of the VCPUs to the same physical CPU.
NOTE
The State field in xm vcpu-list can have one of several values:
r running
b blocked
p paused
s shutdown
c crashed
d dying
The virtual CPUs must exist in one of these states.
In addition to the xm commands. CPUs can be configured in the vm.cfg file as well.
Pinning CPUs Using the vm.cfg File
In addition to using the xm commands, you can configure the number of CPUs and their affinity within the vm.cfg file. The vm.cfg file has two pertinent parameters. The vcpus parameter specifies the number of CPUs used by the VM. In addition, an optional cpu parameter can be added, specifying the physical CPUs that the virtual CPUs can run on. This parameter takes single quotes, as shown here:
![]()
A vm.cfg file generated by the VM Manager only has the vcpus parameter specified. Setting the cpu parameter, as shown here, locks the virtual CPUs to physical CPUs 2, 4, 6, and 8. If you want to set a specific order, put it in the cpu variable, as shown here:
Oracleimage code art.jpgcpu = '9,7,10,2'
![]()
The resulting configuration locks the CPUs, as shown here:

As mentioned earlier, you can also lock one or more virtual CPUs to the same physical CPUs. The cpu variable will take either a specific set of CPUs that are comma separated or a set of CPUs with a range. The result differs based on the configuration, for example:
![]() Specifying a range of CPUs, as in cpu = '1-2', locks the four virtual CPUs to physical CPUs 1 and 2; however, they will be able to move between those CPUs.
Specifying a range of CPUs, as in cpu = '1-2', locks the four virtual CPUs to physical CPUs 1 and 2; however, they will be able to move between those CPUs.
![]() Specifying a single CPU, as in cpu = '1', locks all four virtual CPUs to the same physical CPU.
Specifying a single CPU, as in cpu = '1', locks all four virtual CPUs to the same physical CPU.
![]() Specifying a specific list of CPUs that has the same number of CPUs as specified in the vcpus parameter locks each virtual CPU to a physical CPU, as shown previously.
Specifying a specific list of CPUs that has the same number of CPUs as specified in the vcpus parameter locks each virtual CPU to a physical CPU, as shown previously.
CPU affinity is presented in this chapter because it is not just a tool for tuning the virtual machine; it is also a tool for tuning the Oracle VM server as well by specifying the load on the Oracle VM server’s CPUs.
Pinning CPUs Using ovm_vmcontrol
One of the new features of OVM 3 is the OVM Utilities, which can be downloaded from Oracle Support as patch number 13602094. The OVM Utilities comes with a number of OVM command-line utilities, including ovm_vmcontrol, ovm_reporestore, ovm_vmdisks, ovm_vmhostd, and vm-dump-metrics. In order to pin CPUs, we will be using vm_vmcontrol.
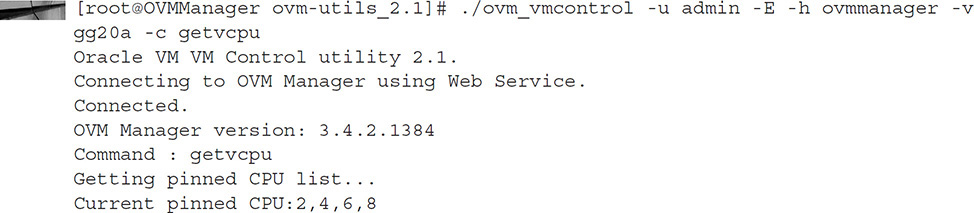
The ovm_vmcontrol utility can be used to display and configure CPU pinning. In order to view any pinned CPUs, use ovm_vmcontrol with the getvcpu parameter, as shown here:

NOTE
The -E option uses the environment variable OVMUTIL_PASS to store the OVM Manager password so it does not show up in the command.
Unlike the xm commands, because this command is going through the OVM Manager, you will use the name that was provided when you created the VM, rather than the OVM-assigned hexadecimal value.
To pin CPUs (also known as hard partitioning), use ovm_vmcontrol with the setcpu and cpulist parameters, as shown here:

Once you have pinned the CPUs, you must stop and start the virtual machine in order for the change to take effect. A restart is not effective for pinning CPUs, it must be a stop and start. After starting the VM, you can verify by running getvcpu again:
The ovm_vmcontrol utility easily allows you to pin and unpin VCPUs.
Whether you pin via the xm commands or via ovm_vmcontrol, the outcome is the same: VCPUs will be pinned to physical CPUs.
Tuning the Network
As with the OS, from a software standpoint, there really isn’t much to tune in the Oracle VM Server. The network is tuned via what I like to refer to as “hardware tuning.” Hardware tuning involves properly allocating the hardware resources to take advantage of these resources and to not overload them. Because the network devices are physically limited to a specific speed (for example, Gigabit), the only way to improve network performance is to add more network interfaces. Fortunately, Oracle VM is perfectly suited for that.
NOTE
See the Oracle whitepaper “Oracle VM 3: 10GbE Network Performance Tuning” for more information on tuning the 10GbE network with OVM 3.4 on NUMA systems. This whitepaper is available at http://www.oracle.com/technetwork/server-storage/vm/ovm3-10gbe-perf-1900032.pdf.
The network can be configured for Jumbo Frames using a 9000-byte maximum transmission unit (MTU). This works well for large payloads, but care must be taken that the MTU for both guests and dom0 are set the same.
You can monitor the network using the built-in Linux command sar. In addition, the OVM server comes with the iperf utility, which allows for testing the bandwidth between any two servers. Both methods are described here.
Monitoring the Network with sar
You can monitor network utilization via the sar command. The sar –n DEV command presents information on the utilization of each network device. The sar command takes two parameters that specify the time interval and the count of the results. For example sar –n DEV 10 100 displays results every 10 seconds, 100 times. This is shown here:

This information is very useful for determining whether a specific network adapter is saturated. However, you cannot take this information at face value. A 1GB adapter can become saturated at less than 1GB of traffic if the packets are small. If you see the receive and transmit packets per second getting close to 80 percent of the limit, it is time to get concerned. In this case, some of the load (some of the virtual machines on that adapter) should be shifted to another adapter.
Testing the Network with iperf
If you think you are having a network problem or if you just want to test the performance of your network, you can use the iperf utility, which is included with Oracle VM Server. The iperf utility allows you to test the performance of the network and to see if any errors show up under load. In order to run iperf, you must first set up a listener server.
To run the listener on one of the systems to be tested, run iperf -s, as shown here:

Once the listener is running, run iperf -c <host> to invoke iperf. By default, iperf will run for 10 seconds, but that is configurable via the command-line options. You should see something similar to this on the source system:

You will see this on the target system where you are running iperf -s. In order to check for network errors, you can run ifconfig, which will show you all the network controllers and any errors that might have occurred on those network controllers.

The iperf utility provides the ability to check the network between any two systems, thus not only testing performance, but checking for errors as well.
Tuning the I/O Subsystem
As with the other components mentioned in this chapter, the I/O subsystem cannot be tuned per se. Rather, you tune it by spreading out the load or by using “out-of-the-box” solutions for solving this problem. I/O performance is probably the most common performance problem associated with virtual machines. The most common solution to this problem is to create the system with sufficient I/O performance to handle the load of multiple virtual machines. In existing systems, you might need to add more I/O storage to improve I/O performance to an acceptable level.
In addition to the more traditional storage systems, newer technologies can be used to vastly improve the I/O performance of virtual machines. These include solid-state disks (SSDs) and other more powerful solutions such as the IODrive by FusionIO. These memory-based solutions provide much higher throughput and response time. Because I/O is such a critical resource in a virtualized environment, it is well worth the investment.
Testing the I/O subsystem is important if you think you are having an I/O problem. Tools available to do this include ioperf and vdbench. Both can help you determine the performance of your I/O subsystem. However, neither dd nor scp is a good tool for measuring I/O performance.
Tuning Virtual Machines
Within the virtual machine, you tune the OS like any other Linux or Windows system. You can modify the parameters and configure the system as necessary to support the application being run on that server. As mentioned earlier in this chapter, you can manage the number of VCPUs and their placement on physical CPUs at the Oracle VM server. In addition, you can configure the priority of the virtual CPUs as well.
When you’re configuring the virtual machine, it is very important to provide sufficient memory. A virtual machine with insufficient memory configured will perform poorly. Memory has become less expensive and is more readily available, so don’t skimp on it.
In general, there is not much to tune at the OS level. Most of the tuning efforts are geared toward proper sizing and planning of the system. Most of the tuning changes that must be made to the OS are to support applications such as Oracle, so that large amounts of shared memory can be allocated, and to support large numbers of semaphores and such. Other configuration changes in the OS are to support the addition of new hardware.
As mentioned at the beginning of this chapter, it is a good idea to monitor each of your virtual machines using Oracle Enterprise Manager Cloud Control. Treat each virtual machine as if it were a standalone machine running on actual hardware. Monitor the OS as well as the applications. If you see excessive paging or memory issues, it is time to add more memory to the virtual machine or reduce the amount of memory being used.
In addition to monitoring the virtual machine OS, it is also important to monitor the applications running within the virtual machine. This is especially true of databases and application servers. Oracle Enterprise Manager Cloud Control is an excellent way to monitor the entire stack.
Summary
This chapter covered the steps and tools necessary to monitor the Oracle VM server itself. Because the Oracle VM Server OS that is visible from a user’s prospective is actually dom0, traditional methods of monitoring, such as using sar, top, and vmstat, don’t work. This chapter covered some of the utilities that can be used to monitor the hypervisor and VM server as a whole, such as the xm tools. Tuning the actual I/O subsystem and network involve what I refer to as “hardware tuning,” which involves allocating the right resources to the right need.
In the following chapters, the focus changes from the Oracle VM Server system to the virtual machines themselves. The next chapter starts by showing the process of creating templates that can then be used to create virtual machines.
