
CHAPTER
28
Oracle VM Troubleshooting
T hings do not always go as planned, and when that happens, you, the administrator, need every tool available to troubleshoot your systems. This chapter covers troubleshooting tools and logs for the Oracle VM Server and the Oracle VM Manager.
When you’re troubleshooting issues, it is best to follow a systematic method. Randomly making changes, installing patches, and not documenting changes will quickly lead to an unstable environment with any technology. Good troubleshooting practices are summed up in the six steps shown in Figure 28-1 and detailed in the following list:

FIGURE 28-1. Troubleshooting process flow
1. Identify the problem. Question the obvious: Is this a virtualization problem? Is the storage problem an OS issue? Many factors are in play, and often a problem in one part of the stack can manifest as a symptom in an entirely different area. Verify where the errors are, and do not only look in one location. When you’re dealing with error logs, modern tools that leverage machine learning to analyze logs (such as Oracle Management Cloud Log Analytics) can save you hours of effort when running down the root cause.
2. Establish a hypothesis. Generally in technology, when something breaks it’s because a change was made. Identify all the changes made before the error occurred. Combine the changed data with the logs and develop a hypothesis on what is broken and why.
3. Test the theory. Once you have a working hypothesis, test whether it is the cause of the problem. Just because a log showed that the ssh daemon was restarted five minutes before the VM crashed does not mean there is a direct relationship between the two. Complex problems should be verified through testing whenever possible. This eliminates the danger of performing unnecessary changes that can introduce new problems into the environment. Use the test to generate a plan of action and a test plan. The plan of action is the change to be made to resolve the problem, and the test plan is how you verify that the problem is resolved.
4. Act. Once you have a validated plan of action, implement the plan, and only make that one change. Making multiple changes at one time can complicate troubleshooting in the future.
5. Test. After the change is made, test the systems using your test plan. Verify the entire functionality of the technology stack when feasible. Often, using automated test tools helps not only in the speed at which systems can be tested but also the consistency of the tests.
6. Report and prevent. Document the findings, actions, and results. Then use this knowledge to prevent future issues.
The next few sections cover troubleshooting resources and tips for the Oracle VM Server and the Oracle VM Manager.
Oracle VM Server
The Oracle VM Server is the heart of your virtualized cloud. Troubleshooting in this system usually requires looking in log files as well as diagnosing network issues, storage issues, and hypervisor issues.
Directories and Log Files
Four critical directories contain configuration files and logs for Oracle VM Server. These are described in Table 28-1.

TABLE 28-1. Oracle VM Server Directories
Each of these directories contains log files, as detailed in Table 28-2, that are helpful in troubleshooting any issues experienced with Oracle VM Server.

TABLE 28-2. Useful Log Files for Oracle VM Server
Command-Line Tools/Networking
Although almost all the management of Oracle VM is performed from within Oracle VM Manager or Oracle Enterprise Manager, you will occasionally need to access Oracle VM Server directly to troubleshoot issues. Table 28-3 details several commands in Oracle VM Server that can assist you in troubleshooting issues.

TABLE 28-3. Oracle VM Server Troubleshooting Commands
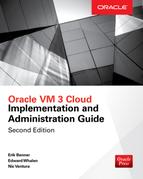
Most of these commands are simple to run and should not need more detail; however, the xentop command warrants a deeper look, as much of the information displayed is not well documented. xentop displays real-time information about the Oracle VM Server domains (see Figure 28-2).
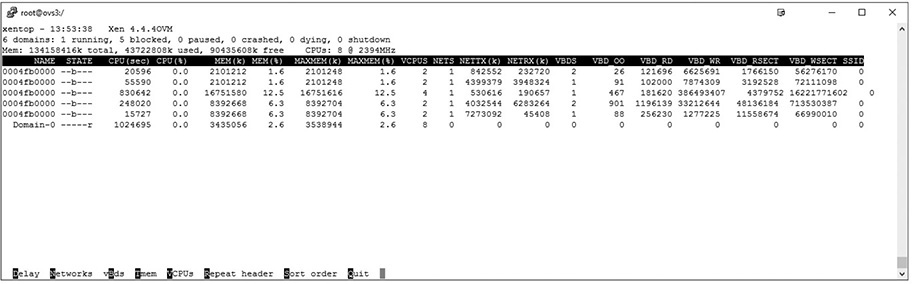
FIGURE 28-2. xentop

NOTE
To run the xentop command, ssh into the Oracle VM Server as root, and simply type xentop and press enter.
The xentop output displays the performance information described in Table 28-4.

TABLE 28-4. xentop Columns
When xentop is running, you can also display more detailed information about the Networks, VBDs (Block devices), VCPU, and Tmem (memory). To add in any additional details, select the corresponding letter when xentop is running, so V will show more information about the VCPUs, T will show memory information, and so on. The R will also repeat the header for each domain. This can be seen in Figure 28-3.

FIGURE 28-3. xentop expanded details
Troubleshooting networking on Oracle VM Server is almost the same as on a normal Oracle Linux system. Common commands used to troubleshoot the network are listed in Table 28-5.

TABLE 28-5. Common Troubleshooting Commands
The main difference is that on Oracle VM Server, almost all physical interfaces (such as eth0m, eth1, and so on) are normally added to bond devices (bond0, bond1, bondX.VLAN, and so on) and then presented to a domain as a virtual interface (vidX.0), also known as a netback device when you’re looking at the network from Xen.
The netstat command shows interface statics when run with the -i option, as shown in Figure 28-4. This shows all the physical and logical components and their details.

FIGURE 28-4. Network information via netstat -i
When you’re troubleshooting network issues, looking at the ERR and DRP columns is important. These columns show the number of good and bad packets:
![]() RX-OK Correct packets received on this interface.
RX-OK Correct packets received on this interface.
![]() RX-ERR Incorrect packets received on this interface.
RX-ERR Incorrect packets received on this interface.
![]() RX-DRP Packets that were dropped at this interface. When configured for an active-backup bond, the standby bond will show 100 percent dropped packets.
RX-DRP Packets that were dropped at this interface. When configured for an active-backup bond, the standby bond will show 100 percent dropped packets.
![]() RX-OVR Packets that this interface was unable to receive.
RX-OVR Packets that this interface was unable to receive.
A high number of bad packets can point to a network issue. In this case, eth1 is using a CAT5 cable but supporting 10G traffic. This is introducing network errors into eth1 and bond0, which uses the eth1 port.
CAUTION
The cable type matters on high-speed networks. When running high-speed networks, verify that the correct category of cable is being used. 10G requires CAT6 for short runs under 40 meters, and CAT7 is needed for runs up to 100 meters.
The running configuration of each bond can be found in the /proc/net/bonding directory. Each bond will have a file in this directory that shows the running configuration of the bond. This includes the type of bond as well as connection information for each member of the bond. In the following example, we can verify that bond1 is a Link Aggregation Control Protocol (LACP) bond (dynamic link aggregation) using the physical eth2 and eth3 ports on the server. Each port is linked at 10G.


Additional information about the physical ports on the server can be discovered using the ethtool command, which shows the link status and port type: TP (twisted pair), FIBER SFP+ interface, and so on. To use the ethtool command, pass the name of the port for which you need additional information, as shown in this example:

The brctl command shows the Linux bridge devices, which are the bonds in the environment. This command shows each bridge and what MAC addresses are being used on each one.
To show all the bridges on an Oracle VM server, run the command brctl show:

This example shows two bridges: 10dbdbbf7a and c0a8c800. The c0a8c800 bridge uses the bond0 interface, and the 10dbdbbf7a bridge uses the bond1.200 interface, which is VLAN200 on bond1. Also, four virtual interfaces are attached to the bridge driver; these will start with “vif.”
Using brctl, you can see a list of all the MAC addresses used on a bridge. This command also requires the command showmacs and the name of the bridge, as shown here:

In this example, two MAC addresses are local to the bridge, and a third MAC address is external to the Oracle VM Server.
DNS is often critical for the network to function correctly, so Oracle includes the dig command in the distribution. This is the replacement command for nslookup, and it’s easier to use. (The nslookup command has been deprecated, and although it is included in Oracle VM Server, it is no longer included in many Linux distributions.) To check the resolution of a name (such as the 10G interface name on a storage array), simply use the command dig with the DNS name, as shown in the following example:

Not only do we see that the name is resolving to the 192.168.210.10 interface, but we see the DNS server of Authority (192.168.200.11) and DNS record information.
Multipathing
The Linux multipathd daemon provides a critical role by enabling support for multiple paths between the Oracle VM server and the storage. Having multiple paths working protects against the failure of a storage array controller, as the Oracle VM server will automatically route the storage requests to the surviving controller. This provides storage high availability for block devices.
NOTE
Make sure you download and install the latest multipath.conf file from Oracle Support when adding new arrays. The Oracle-supplied configuration is validated for Oracle Storage products. Although Oracle includes stanzas for non–Oracle Storage technologies, these configurations are not validated and may need to be updated based on the individual storage vendor’s requirements.
Troubleshooting this setup requires some basic understanding of the tools. The multipathd –k command starts an interactive console. After entering this command, you can enter help to get a list of available commands, you can enter a command, or you can press ctrl-d to quit.
The multipathd interactive console can be used to troubleshoot problems you may be having with your system. For example, the following command sequence displays the multipath configuration, including the defaults, before exiting the console.

In the following example, only one LUN is working with the multipathing: the dm-3 LUN. The dm-1 and dm-2 LUNs are not multipathed and should have their configuration checked on the storage array.

CAUTION
Linux DM-X names can, and will, change over time. Do not use them to identify a LUN; instead, always use the World Wide ID (WWID).
NFS
The Network Filesystem (NFS) is also commonly used, and although a very reliable technology, it occasionally has issues with connecting to arrays that are not configured correctly. Before troubleshooting any NFS issues, first make sure each Oracle VM server can ping the NFS server.
Next, verify that NFS v3 or v4 is supported by the array. This can be done by running the rpcinfo command, pointing to the storage array. In this example, both NFS version 2 and version 3 are supported:

The next step in troubleshooting NFS shares is to use the showmount command to see what NFS shares are available. If showmount does not see the NFS export, Oracle VM will not see the export.

Next, you can use the command nfsstat to check all the mount options for all NFS shares, as shown here. Verify that the NFS version used is 3 (using the mountvers option) and that the IP address is the one expected for the NFS server. With multihomed NFS servers, if you are not careful, the wrong IP can be accidently used.

Oracle VM Manager
Even though the Oracle VM Manager has fewer components to manage, it is a critical part of the Oracle VM environment because it’s the management control. However, even if the Oracle VM Manager fails, the VMs running on the Oracle VM servers will continue to run and automatically fail over if their HA flag is set. Troubleshooting the Oracle VM Manager is focused on its log files. It is also important to watch the tasks being performed in Oracle VM Manager by monitoring the Jobs panel. Finally, you should be aware that each entity in Oracle VM Manager has its own event history that can be accessed from the Oracle VM Manager.
Log Files and Directories
Oracle VM Manager error messages are displayed in the Jobs tab and in the object’s Events list, and they are also available in log files. Log files are stored in the following directory on the Oracle VM Manager host computer:
![]()
Here are a few files that are helpful when troubleshooting Oracle VM Manager:
![]() access.log This log tracks HTTP access to the web interface of the Oracle VM Manager. This includes any calls to the WebLogic server’s HTTP interface. This log can be used to track access and HTTP operations within Oracle VM Manager to help debug access issues and to audit access to the Oracle VM Manager. Login messages will contain the test “/ovm/console/faces/login.jspx.”
access.log This log tracks HTTP access to the web interface of the Oracle VM Manager. This includes any calls to the WebLogic server’s HTTP interface. This log can be used to track access and HTTP operations within Oracle VM Manager to help debug access issues and to audit access to the Oracle VM Manager. Login messages will contain the test “/ovm/console/faces/login.jspx.”
![]() AdminServer.log This log contains the events from the WebLogic Server framework, including events triggered by Oracle VM Manager. This is one of the most useful logs when you’re looking for SSL/TLS certificate issues and file permission issues. It also contains actions performed within Oracle VM Manager that are usually identifiable by searching for items containing the string com.oracle.ovm.mgr.
AdminServer.log This log contains the events from the WebLogic Server framework, including events triggered by Oracle VM Manager. This is one of the most useful logs when you’re looking for SSL/TLS certificate issues and file permission issues. It also contains actions performed within Oracle VM Manager that are usually identifiable by searching for items containing the string com.oracle.ovm.mgr.
![]() AdminServer.out This log file contains the output from the WebLogic server, including the startup and shutdown messages. This log file is very useful for detecting problems when the Oracle VM Manager will not start, and it’s helpful for troubleshooting database connectivity issues and other errors. Search for <Critical> text to rapidly find significant errors.
AdminServer.out This log file contains the output from the WebLogic server, including the startup and shutdown messages. This log file is very useful for detecting problems when the Oracle VM Manager will not start, and it’s helpful for troubleshooting database connectivity issues and other errors. Search for <Critical> text to rapidly find significant errors.
![]() AdminServer-diagnostic.log The file contains exceptions from the Oracle WebLogic server, including events triggered by Oracle VM Manager such as login failures due to incorrect credentials.
AdminServer-diagnostic.log The file contains exceptions from the Oracle WebLogic server, including events triggered by Oracle VM Manager such as login failures due to incorrect credentials.
Because the log file format is determined by Oracle WebLogic, many of these files may be difficult to read. One option is to leverage a log analytics tool such as Oracle Management Cloud Log Analytics, which both parses logs and leverages machine learning to correlate events between logs in all tiers of the IaaS Cloud. Another option is to use the log-parsing tool included with Oracle VM Manager. This tool is named OvmLogTool.py and is located at
![]()
OvmLogTool.py can perform the following three useful tasks:
![]() Convert and combine all the AdminServer log files into one file.
Convert and combine all the AdminServer log files into one file.
![]() Create a filtered summary log file that only lists errors.
Create a filtered summary log file that only lists errors.
![]() Display the latest contents of the AdminServer log, applying the filtering on the fly.
Display the latest contents of the AdminServer log, applying the filtering on the fly.
Usually analysis of the logs starts by generating an errorpwds summary log. The summary file can act as an index into the filtered file to investigate and analyze errors, providing you with timestamps and a shortened summary of each error that may need further investigation. To generate a summary log file, run python OvmLogTool.py -s -o summary, as shown here.

This generates a file named “summary” in the local directory that can then be analyzed for any errors. However, it will only contain error messages, which at times can limit your ability to understand the context of the errors. To get a full log of all events and errors within Oracle VM Manager, run the command python OvmLogTool.py -o filteredlog, as shown here.
This generates a file named filteredlog in the local directory. You can use this to look for all events that occurred within Oracle VM Manager.
Finally, you can use OvmLogTool.py to filter results on the fly while tailing the log, as shown in Figure 28-5.

FIGURE 28-5. Using OvmLogTool in real time
Entities
Each entity in Oracle VM Manager has an Events tab that shows all the events and errors for a target. On the Entity, where it is a VM, Repository, Server, and so on, you can right-click the entity and select Display Events, as shown in Figure 28-6.

FIGURE 28-6. Display Events
This displays the events for the entity, as shown in Figure 28-7, where you can see that a VM was purposely crashed several times while performing some storage testing.

FIGURE 28-7. Event history
Jobs
Oracle VM Manager also displays most errors in the jobs. The Jobs panel appears in the bottom section of the screen. When each job runs, the system will notify you if there is an error with the job, as you can see in Figure 28-8, where one job has failed.

FIGURE 28-8. Job list
If there is an error, click the Details button to see the error, as shown in Figure 28-9. From here, you can see the job details, the queued info that’s applicable, and also the individual job events.

FIGURE 28-9. Job error details
Summary
This chapter covered the basics of the troubleshooting process—from identifying the problem to resolving the problem, documenting the issues, and implementing future actions to prevent the problem from happening again. We reviewed the common directories for Oracle VM Server as well as the critical log files and several commands that can help you gather the data needed to troubleshoot issues. We covered the Oracle VM Manager and its critical files, as well as the included Python script that can help you analyze the log files. As a reminder, although troubleshooting can be a difficult process, it does eventually get easier, especially if you follow the process, do not make multiple changes at the same time, and document what changes you made.