
6.1
MARK-TO-MARKET ACCOUNTING

Purpose
This chapter describes the concepts behind mark-to-market and fair value accounting.
Summary
Mark-to-market is a type of fair-value accounting that applies to financial investments. It is the most common valuation standard used for energy transactions. Accounting policies around mark-to-market define what is meant by a trading price. As a result, mark-to-market affects anything that uses prices as an input (like risk management and financial reporting). The primary alternative to mark-to-market accounting, historical cost accounting, applies to physical assets like buildings and equipment. With a few exceptions, this type of accounting values assets at their acquisition cost and this value does not change over time.
Key Topics
• Mark-to-market is the standard accounting applied to energy trading.
• Mark-to-market depends on trading markets for prices. This doesn’t always coincide with the reality of energy markets since many markets are illiquid or intermittent.
• Accounting recognizes that not all prices are equally visible and has developed a fair value hierarchy for companies to report illiquid or heavily modeled prices to shareholders.
Mark-to-market is a type of fair-value accounting that applies to financial investments—anything that is considered a derivative needs to use this standard. As a result, mark-to-market is the most common valuation standard used for energy transactions. This has a cascade effect on many areas since accounting policies around mark-to-market define what is meant by a trading price. Consequently, this standard affects anything that uses prices as an input (like risk management and financial reporting). Sometimes this creates unexpected consequences.
The primary alternatives to mark-to-market accounting are hedge accounting and historical cost accounting. Historical cost accounting applies to physical assets like buildings and equipment. Hedge accounting applies to derivatives that are used to hedge physical assets. Hedging is discussed in its own chapter.
Mark-to-market is not always easy to implement for energy transactions. One reason it is difficult is a lack of potential trading partners. Sometimes there is no counterparty willing to transact a particular commodity at a specific location. In other cases, a contract might not be easily assignable to another party. For example, a power purchase agreement (PPA) might obligate a utility to purchase power and various nontradable items like capacity and ancillary services from a specific electrical generation unit. If this contract specifies the generation facility, it might not be possible to sell the contract to anyone else without selling them the physical unit at the same time. This might result in a gray area where accountants would need to determine which accounting rules might apply to a particular investment.
Even so, there is a big advantage to using mark-to-market accounting—it is fairly intuitive for most assets. If an asset is purchased for $100 and the same asset starts selling for $120, under mark-to-market accounting, it will show a $20 profit. The alternative, historical cost, keeps assets marked to their purchase price until they are actually sold. Historical cost accounting can be misleading in the cases of long-dated assets because the value of those assets isn’t regularly updated. Typically, there is little choice about which type of accounting can be applied—accounting rules will specify the type of accounting that must be used.
• Mark-to-Market Accounting. Mark-to-market accounting uses recent prices quoted in the financial markets to determine the value of investments. Any contract that can be traded (futures, swaps, options) will typically be subject to mark-to-market accounting.
• Historical Cost Accounting. Historical cost accounting uses the purchase price of assets to determine the value of investments. This is most commonly used for physical investments (buildings, equipment) that can’t easily be traded.
Fair Value
Fair value accounting, which includes mark-to-market, is used to value many tradable assets. The general premise behind this approach is that trading is possible—that cash can be paid or received to transfer the item being valued to another person. If cash would be received to transfer the item to someone else, that item is called an asset. If cash has to be paid, the item is called a liability. The act of transferring either an asset or a liability for cash is called liquidation. For instruments that get traded regularly, the mark-to-market price is usually the last reported trade price.
There is often a symmetric relationship between the value of assets and liabilities. For example, if one person has an asset (perhaps owning title to a undelivered barrel of oil) there might be an equal and opposite liability (like someone’s obligation to deliver that barrel of oil). In common usage, the price of the asset, as in “the price of a barrel of oil,” is used to describe the price of both the asset and liability. In other words, there is typically a single price used to value both assets and liabilities. When a single price is used, this is often an approximation. For example, if valued for trading, an actual transaction might need to incorporate bid/ask spreads, transaction costs, and (if payment isn’t in cash) the credit quality of the participants.
Relationship with Risk Management
Many risk management policies will trigger events, like forcing a trader to liquidate, as a result of prices reaching a certain level. Mark-to-market accounting is closely related to risk management because it determines the primary input into that process—the prices. The exact mechanism for risk management triggers can vary between market participants. For example, this can be done directly (a stop-loss if prices fall below a specific amount) or indirectly (a risk limit based on volatility, where a large price change will increase volatility).
Mark-to-market does address one specific type of risk. One of the primary drivers behind the adoption of mark-to-market was to prevent accounting fraud. It does this by forcing everyone in the market to use visible, recently updated prices. Most commonly, these prices are obtained from brokers, exchanges, or similar data providers that are independent of the group using the data. This reduces the need for traders to mark their own books and prevents them from adjusting prices to smooth out earnings.
On the downside, reducing one type of risk (accounting fraud) has created a new set of risks (exposure to bad prices) that has to be managed. Some of the problems associated with mark-to-market accounting are an increased likelihood of market panics, a temporary disappearance of liquidity, and bank failures. The underlying reason for these problems is that only a fraction of the total assets that exist in tradable form are bought or sold on any given day. As a result, a small number of transactions will determine the value of an entire industry. Additionally, since risk management limits margin, and capital requirements for banks all incorporate prices as their primary input, problems can cascade very quickly. This can turn a small issue into a major crisis.
Another problem with mark-to-market is that prices are not necessarily rational. Financial analysis makes a lot of assumptions about markets. For example, some common financial assumptions are that the time value of money links current and future prices, that markets are efficient, and so on. However, when everyone’s prices are based on a very small volume of trades, those assumptions can fail. Traders can agree to transact at any price that they want.
For example, on a Friday before a long holiday weekend, a trader might be finishing up a large transaction before going on vacation. Due to some news event, concerns are raised that there is too much supply of the product being traded by the trader and prices start to decline. Selling into a falling market, the trader runs out of buyers who are willing to buy enough of the asset. Not wanting to deal with trading while on vacation, and with only minutes left to finish the transaction before the end of the day, the trader agrees to sell the final 1,000 contracts at a substantially lower price than the earlier trades. Because this happens right at the end of the day, this is highly likely to be the last trade that gets reported. As a result, everyone who owns the asset will have to mark a substantial loss on their balance sheets.
Even though selling at the last minute was perhaps an irrational decision since it did not maximize the firm’s profit, the trader’s decision to finish up before leaving on vacation wasn’t indication of a distressed market. The market was operating normally and the transaction occurred between two willing market participants in the normal course of business. However, because of mark-to-market accounting, the trader’s final transaction price will be used for everyone in the market.
If the impact was limited only to the transacting firm, this would not be a big deal. However, since everyone in the market is affected by this price, there is the potential for systemic problems that could cross multiple industries. For example, a bank might be required by its regulator to maintain a minimum level of liquid assets to be able to provide depositors ready access to their money. If one of their assets were to lose value, they would need to sell other assets to obtain more cash. This could cause a market contagion where prices in other markets are driven down.
Alternately, a large loss in value of an asset might trigger a margin call for other traders holding that asset as collateral. Those traders would then be required to obtain additional money, or sell assets, over a holiday weekend when doing so will be difficult. This can spiral out of control, when additional assets start being sold to cover losses, creating a sell-off crossing several markets. Ultimately, this can snowball into a market crash.
Fair Value Accounting
Businesses often are required to use mark-to-market accounting due to accounting regulations. For example, in the United States, the U.S. Financial Accounting Standards Board (FASB) defines fair value as part of its accounting standards codification 820 (ASC 820). Internationally, the International Accounting Standards Board (IASB) defines fair value as part of the International Financial Reporting Standards topic 13 (IFRS 13). The definitions in the two standards are similar and define fair value on the basis of a price to liquidate a transaction under typical market conditions, called an exit price. Both standards also incorporate a way to describe the precision of the fair value estimate through the use of a fair value hierarchy, which ranks the accuracy of a fair price.
In some cases, there are multiple ways to liquidate an asset or liability. If a single market exists where a majority of trading occurs, a primary market, prices from that market should be used to calculate the exit price. Otherwise, accounting standards typically specify that companies should use an approach that maximizes the value of an asset. This is called the highest and best use or most advantageous market for an investment. Although these are distinct concepts, it should be noted that the primary market is very commonly the most advantageous market.
If a primary market exists for an asset or liability, prices from that market should be used to mark the asset or liability to market. Otherwise, traders should try to identify the highest and best use or most advantageous market.
It should be noted the exit price is based on the definition of an orderly market rather than an active market. As a result, it may be necessary to mark-to-market assets and liabilities where pricing data are not regularly available.
Additionally, the terms orderly and active typically relate to the market in a particular asset or liability (like a natural gas futures contract) rather than a trading venue (like a commodities exchange). A commodities exchange will have markets in a variety of different commodities, some of which will be active markets and some inactive.
Prices published by the primary market must typically be considered for fair value with a few exceptions. The primary exception is when transactions were not orderly. There are two types of disorderly prices—distressed transactions and forced sales. In a distressed transaction, the company is in or near bankruptcy, experiencing a severe cash shortage, or having assets repossessed by creditors. In a forced sale, the trader is being required to sell to meet legal or regulatory requirements. A company’s internal policies, like forcing traders to liquidate when risk limits are exceeded, or a trader rushing to finish a large number of transactions before a long weekend, are not considered disorderly transactions.
It is also important to note that the market as a whole will never be considered distressed. In other words, as long as the market is open and some market participants could be transacting, then the published prices have to be used. Accounting guidance has specifically stated that even when the market is crashing, it is not acceptable to calculate the value of the asset based on a hold-to-maturity approach (by discounting expected future cash flows) or use assumptions based on normal market conditions.
Even if there has been a significant decrease in the volume and level of activity for the asset or liability and regardless of the valuation technique(s) used, the objective of a fair value measurement remains the same. The FASB defines fair value as the price that would be received to sell an asset or paid to transfer a liability in an orderly transaction (that is, not a forced liquidation or distressed sale) between market participants at the measurement date under current market conditions.
(Source: FASB ASC 820-10-35-51D)
Fair Value Hierarchy
Because exit prices are based on the definition of an orderly market rather than an active market, it is often necessary to mark-to-market assets and liabilities even if pricing data are not regularly available. Accounting guidance recognizes that pricing is less certain for these assets and liabilities. As a result, accounting guidance requires companies to report the size of illiquid investments to shareholders.
To standardize reporting of illiquid investments, a significant element in both ASC 820 and IFRS 13 is the use of a three-level fair value hierarchy. This hierarchy differentiates the types of inputs, like prices, that are used to value investments. Inputs are separated into three categories ranging from highly liquid level 1 inputs to extremely illiquid level 3 inputs (Figure 6.1.1). Level 1 fair value inputs are highly observable inputs—typically prices directly from an exchange. Level 2 inputs are more subjective and often result from fragmented markets where trading is spread out between multiple venues. Level 3 inputs are unobservable and associated with markets with limited liquidity.

Figure 6.1.1 Fair value inputs
Assets and liabilities are described as level 1, level 2, or level 3 securities depending on the market data used during their valuation. Level 1 securities are based exclusively on level 1 inputs. In a similar manner, level 2 securities can use a combination of level 1 and level 2 inputs. Finally, level 3 securities incorporate at least one level 3 input (Figure 6.1.2).
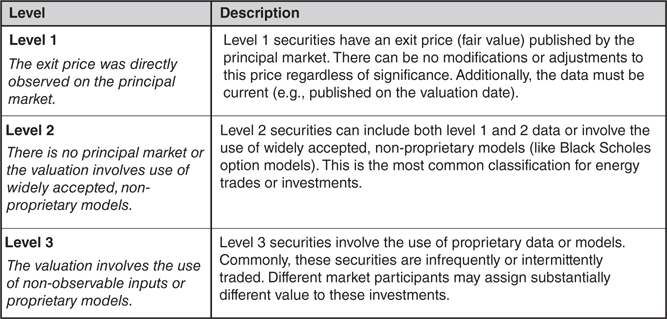
Figure 6.1.2 Fair value levels
For example, the price of natural gas at Henry Hub is the benchmark natural gas price in the United States. It is the delivery point for U.S. natural gas futures. Prices at this location would be considered level 1 inputs, and natural gas futures settling at Henry Hub would be considered level 1 securities. Natural gas prices in Texas are priced as a spread to Henry Hub prices, typically within a couple of cents of the Henry Hub price. This spread is primarily quoted by brokers and is a level 2 input. Natural gas swaps settling in Texas would be level 2 securities since they incorporate both a level 1 input and a level 2 input. These swaps are considered level 2 inputs even if the basis spread happens to be zero at the valuation date—to be considered level 1 securities, all of the data have to come directly from the primary market.
The determination on how to level a particular security needs to be made by the management of each firm. This designation depends on the market data the firm has access to and can change over time.