
6.6
WEATHER DERIVATIVES

Purpose
This chapter introduces a type of financial instrument based on published weather data like average daily temperature and rainfall called weather derivatives.
Summary
Weather derivatives are financial products whose payoff is tied to weather conditions. These derivatives are used by utilities to protect against volumetric risk. Volumetric risk is the risk that consumers served by a utility will use more of an energy product when prices are high and use less when prices are low. This will force the utility to purchase more supply at high prices and dump excess supply at low prices.
Key Topics
• Weather derivatives have payoffs linked to some type of weather data (like average temperature or rainfall).
• There are many types of weather derivatives including swaps and options.
• Weather typically behaves differently than prices. Valuing weather derivatives requires examining historical weather data to quantify what an expected or typical temperature might be in some area.
Weather derivatives are financial products whose payoff is tied to weather conditions. These derivatives are usually bilaterally negotiated between market participants who want protection from or exposure to weather events. The most common weather derivatives are based on temperature. However, derivatives can also be constructed on average rainfall, snowfall, hurricanes, or similar weather data. Typical users of weather derivatives include utilities and insurance companies.
Weather presents an unusual set of risks to energy companies because it affects both volume and prices. This makes it difficult to hedge using typical financial products. For example, an uncharacteristically cold winter might lead to natural gas companies depleting their stored natural gas because more heating is required. At the same time, natural gas prices can spike due to utilities competing to acquire dwindling reserves of fuel for their customers at progressively higher prices.
Weather derivatives are similar to insurance but there are differences (Figure 6.6.1). First, weather derivatives tend to deal with events that happen with a reasonably high degree of probability. Second, weather derivatives tend to deal with less extreme events than insurance. For example, insurance might be purchased to protect against flood or hurricane damage (involving a very large loss that might only happen once every 100 years). Weather derivatives might be purchased to protect an airline from lost business if rainfall is 10 percent more than average (a smaller loss, but one that might happen several times over a 10-year period).
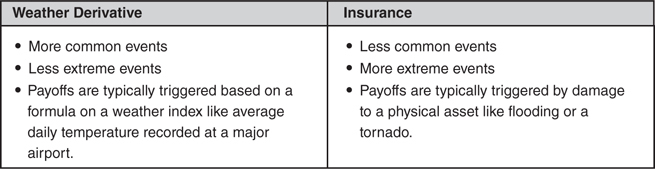
Figure 6.6.1 Differences between weather derivatives and insurance
Weather derivatives can be found in both swap and option forms. With a weather swap, both parties to the contract are at risk and entering the contract won’t cost either any money. With a weather derivative option, the buyer will pay a premium to the seller and only the seller will be at risk. This premium will typically be quite large—often about 20 percent of the maximum payout. It is fairly common for these derivatives to cap the maximum profit or loss associated with the derivative.
Heating and Cooling Degree Days
The most common weather derivatives are heating degree day (HDD) or cooling degree day (CDD) contracts. Heating degree days occur when temperatures are cold (when heating is required). CDDs occur during hot weather (when air conditioning is required). The payoff of these contracts is based on the accumulated difference in daily temperatures relative to some baseline over some period of time. Commonly observed baselines are 18°C (in Europe) or 65°F (in the United States). For example, an average daily temperature of 85°F would contribute 20 CDD (since 85 minus 65 is 20). The HDDs or CDDs are then accumulated over some period of time to compare to a strike price.
• HDD = Max(Baseline – Average Temperature, 0).
• CDD = Max(Average Temperature – Baseline, 0).
For example, a weather derivative might pay $1,000 for every HDD in excess of 100 HDD for the first week of January 2016. The first step to determining the payoff would be to calculate the number of heating degree days in the week. First, it is necessary to find the average temperature reported each day. The official source for the weather data, the location, and the baseline temperature for the HDD calculation will all be found in the contract. Then, an HDD is created for each degree that the daily temperature is cooler than the baseline temperature. Finally, the weekly HDD can be found by summing the daily HDD (Figure 6.6.2).
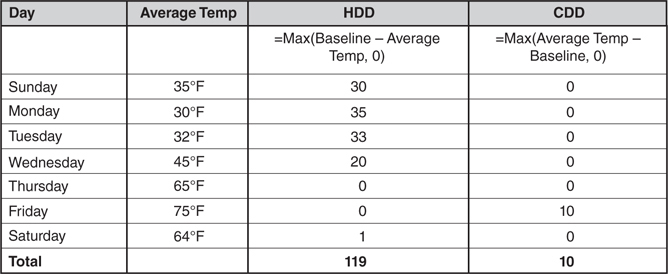
Figure 6.6.2 HDD and CDD calculations
Weather Contracts
Like most other derivatives that are traded under master netting agreements, there will typically be a trade confirmation that defines all of the terms of the transaction (Figure 6.6.3).
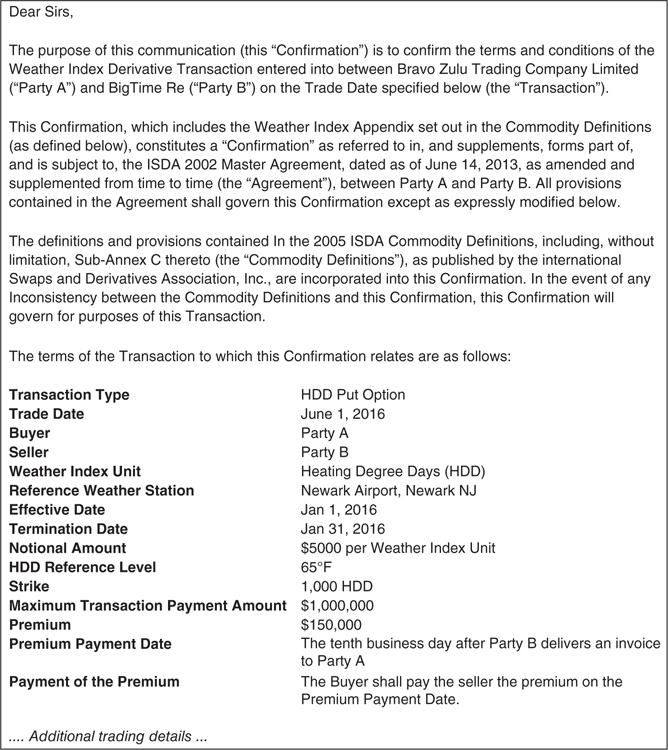
Figure 6.6.3 Example weather derivative confirmation
Temperature Modeling
Prior to expiration, the expected payoff of a weather derivative is typically based on observing historical data. This is different than how forward prices are created for most other financial products. For example, most forward commodity prices are developed through trading markets (for nonstorable energy products) or buying the product today and storing it (for stocks, bonds, and storable commodities).
One problem with using historical data is that weather data appear to trend over time. The data do not consistently revert to an expected temperature. This makes it very difficult to describe an “expected temperature” that might occur in the following year (Figure 6.6.4).
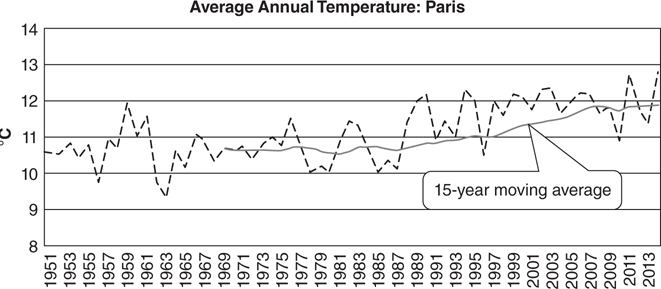
Figure 6.6.4 Average annual temperature: Paris
Because there is no typical or average temperature that can be observed historically, this means that anyone trading or valuing weather derivatives needs to make assumptions. Two of the most important decisions are whether to trend adjust or truncate the data set.
• Trend Adjustment. One important modeling decision is whether the data be trend adjusted. If it is trend adjusted, a second important decision is when to start the adjustment calculation. In the Paris example, starting the trend adjustment in 1958 (a very warm year) will give a different result than starting the trend adjustment in 1963 (a very cold year).
• Data Truncation. Another modeling decision is choosing the length of the data set that should be used to model temperatures. Based on visual inspection, there appear to be multi-year periods of relatively stable temperatures followed by trending data. This raises the possibility that older data may not be as predictive as more recent data.