
1.1
AN OVERVIEW OF THE ENERGY MARKETS

Purpose
This chapter summarizes the most important points in the book. It provides an introduction to the energy market and an overview of energy trading. It is structured identically to the entire book, and is intended as a summary of the major topics that will be discussed in detail.
Summary
The energy market is a collection of interrelated businesses focused on delivering electricity, petroleum products, and heating fuel to consumers. One set of businesses finds and develops new sources of power—drilling for new fuel reserves or developing better solar panels. Another group transports these sources of power closer to end users using pipelines or cargo ships. Some businesses generate power, like power plants, wind farms, and solar installations, and others convert raw materials into finished products. Additional businesses, like public utilities and gas stations, are responsible for actually distributing power and natural gas to consumers. The energy sector affects almost every facet of the U.S. economy.
The fragmented nature of the energy market means that most people only see a small portion of the whole market. The energy market is shaped by the details of its subindustries. Ultimately, the market revolves around drilling for fuel reserves, building power plants, and running power lines. Each of these subindustries has unique aspects that need to be understood by decision makers. However, it is also important to understand how the entire market fits together.
The major commodities in the energy market are petroleum, natural gas, and electricity. Coal, carbon emissions (greenhouse gases), nuclear power, solar power, and wind energy are also part of this dynamic market. Energy has always been a major industry, but with deregulation allowing more active trading, it has also become a major financial market. It now stands alongside stocks, bonds, and other commodity markets as an equal. With the influx of Wall Street and financial interests, there is now a large body of people involved in energy trading.
Many complex aspects of energy trading are due to the physical characteristics of energy commodities. Energy is hard to transport and store. Like other commodity markets, a portion of energy trades are settled by the physical delivery of a commodity. For example, this might require taking delivery of a million barrels of crude oil. When delivery or receipt is required as part of a trade, it is called a physical trade. When a trade involves only the transfer of cash—without a physical delivery—it is called a financial trade. Physical trading is both more complex and potentially more financially rewarding than financial trading.
Several major energy products (electricity and heat) can’t be easily stored—they must be generated as they are needed. They are also expensive to transmit over long distances. Because of this, power and heat are typically generated close to the consumers that need those products. As a result, the energy market is further divided into another two pieces—a collection of small local markets concerned with today’s activity (spot markets) and a separate market concerned with national expectations of the future (the forward market). Unlike the stock or bond market, the energy spot and forward markets aren’t closely linked. This is because it is impossible to buy electricity at one point in time, store it, and deliver it at a later point in time.
The more markets that traders can access, the higher their potential profits. Being able to transact in a variety of different energy markets allows traders to benefit from a variety of opportunities. In most financial markets, it is very unusual to find profitable trades with no financial risk. These types of trades are called arbitrage. Energy markets will have many more of these opportunities, although they will often substitute operational risk, like figuring out how to take delivery of thousands of gallons of oil, for financial risk.
Another complication facing traders in the energy markets is the difficulty finding trading partners in some markets. Traders describe the ease or difficulty of finding trading partners with the term liquidity. A liquid market is one where it is easy to find trading partners and the cost of trading is low. An illiquid market is one where it is difficult to find trading partners and the cost of trading is relatively high.
From a trading perspective, the spot markets are complicated. They are full of local regulations and subject to a laundry list of physical constraints. The most liquid markets are the forward financial markets. It is tempting to ignore the physical markets in favor of the easier to understand financial markets. However, this is a mistake. The financial markets contain hundreds of features that are inexplicable unless the physical markets are understood. The complexity of the physical spot markets defines energy trading. None of these issues are individually difficult to understand—but there are a lot of distinct issues to keep track of.
The major commodities in the energy market are petroleum, natural gas, and electricity. Coal, carbon emissions (greenhouse gases), nuclear power, solar power, and wind energy are also all part of this dynamic market. Energy has always been a major industry, but with deregulation allowing more active trading, it has also become a major financial market. It now stands alongside stocks, bonds, and other commodity markets as an equal. With the influx of Wall Street and financial interests, there is now a large body of people involved in energy trading.
The energy market is composed of many separate products concerned with the production and delivery of electricity and fuel to consumers. Of these, the most important energy markets are for crude oil, natural gas, and electricity. Coal, carbon emissions, refined petroleum products, and alternative energy are examples of some secondary commodities in the energy market.
Major Players
To deliver electricity and fuel to consumers, someone has to locate the fuel, get the fuel to where it needs to go, and turn the fuel into something useful. The start of the process—finding fuel—is usually performed by exploration companies. The fuel has to be extracted and prepared for transport by a drilling company. In specialized parts of the market like solar power, manufacturing solar panels replaces exploration and mining. Likewise, hydroelectricity requires a civil engineering firm to construct a dam.
Next, the fuel needs to be transported somewhere useful. Natural gas can be transported as a gas in a pressurized pipeline or it can be turned into a liquid and transported by cargo ship. If liquefied, the natural gas needs to be returned to gaseous form after transportation. Coal is transported on trucks and railroads. Oil is transported by tanker ship and liquid pipelines. Of course, not all portions of the market require transportation—the sun handles delivery of solar energy by itself.
Finally, useful products must be produced and distributed to end users. Public utilities and merchant power operators generate electricity at power plants. Then, they transmit their power to customers over a power grid maintained by a Transmission System Operator (TSO). Natural gas is moved out of transcontinental pipelines and into the systems of local gas utilities. Local gas utilities distribute natural gas to consumers through their own pipeline networks. Petroleum products need to be refined and transported to local residences and gas stations via pipelines and trucks.
The energy market is largely composed of three groups—energy companies, regulators, and traders. Energy companies typically are involved in some physical aspect of the energy industry. Oil exploration companies, power grid operators, and pipeline operators are all examples of energy companies. Regulators are government agencies that have been given oversite of some part of the energy market. Traders and financial companies make up the last part of the industry.
Each industry will have its own structure. For example, in the electrical power industry, the companies that manage the power grid, TSOs, are often run by local governments. When a TSO is unaffiliated with the local government, it is called an Independent System Operator (ISO). An ISO that crosses state boundaries is also commonly referred to as a Regional Transmission Operator (RTO). Most electricity trading occurs on power grids run by RTO/ISOs operating in deregulated markets, i.e., markets that allow free trading of electricity. Local rules vary between power grids. However, most deregulated power markets are still highly regulated. In this book, TSO is used to describe any power grid operator, and RTO/ISO is used to describe the operator of a power grid in a deregulated market.
Each energy market also has its own history. For example, allowing anyone to trade electricity is a relatively new concept. Prior to deregulation, only power plants owned by utilities could sell power into a power grid. After deregulation, anyone could build a power plant, produce power, and offer that power for sale. In deregulated markets, utilities have shifted away from running power plants to concentrating on operating transmission grids. Power plants started being owned by power traders and operated by specialized service companies. These changes revolutionized the power industry—they created a market for electrical power.
The last groups of market participants are the traders, investors, and marketers. Financial trading has grown up around the physical trading business. Funding exploration or building new manufacturing plants isn’t cheap—it requires raising capital from investors. Local utilities need to use financial contracts to guarantee a steady supply of fuel and electricity for their customers. Power plants need to buy fuel and sell their electricity. Major industrial facilities might want to guarantee future supplies of affordable power. Financial firms might wish to speculate on the price of power. To do this, any of these parties can enter into transactions. These transactions can be done directly between two parties. This is called bilateral or over-the-counter trading. Alternately, trading can be done using an intermediary organization (often an exchange). Energy products are commonly traded on the New York Mercantile Exchange (NYMEX) and the Intercontinental Exchange (ICE).
Natural Gas
Natural gas is a fossil fuel used for heating and producing electricity. It is a combination of colorless, odorless gases composed primarily of methane (CH4). It often contains substantial amounts of other hydrocarbons, like ethane (C2H6), propane (C3H8), and butane (C4H10). The composition of natural gas varies from location to location. It is often found mixed with nitrogen, carbon dioxide, and other trace gases. Natural gas is considered “dry” when it is almost pure methane, and “wet” when it has substantial quantities of the other hydrocarbons. Its central role in the energy industry is due to its role as a clean, comparatively inexpensive fuel—almost all of the electrical power generators that have been built in the United States for the past 20 years use natural gas as a fuel.
Natural gas is extracted from underground wells and transported to customers through pipelines. End users of natural gas are often called the burner tip. At one point, gas appliances were fitted with special dispersing heads to make natural gas suitable for lighting, cooking, and heating. Modern appliances no longer use burner tips, but the nickname has stuck.
Natural gas pipelines are located throughout the country and are capable of providing a constant supply of gas to consuming regions. Natural gas hubs are located at the interconnection between major pipelines. The most important natural gas hub, Henry Hub, is located on the U.S. Gulf Coast, about halfway between New Orleans and Houston. Henry Hub is the delivery location for the NYMEX natural gas futures contract and it is used as the benchmark for all natural gas sold throughout the United States.
Like many other energy products, the forward and spot markets for natural gas are distinct from one another. There is an extremely well defined seasonal component to forward prices. Prices in the forward market tend to mirror consumer demand—both are high in the winter and fall dramatically in the spring of every year. Spot prices don’t show the same kind of predictability—spot prices are heavily influenced by supply and demand. However, despite the different behaviors, arbitrage between the two markets is impossible without a physical storage facility. It is possible to make a profit buying gas on the spot market, storing the gas, and selling it for future delivery. However, this requires an ability to make physical trades—to take delivery and store large quantities of a gas—which many market participants lack.
The natural gas industry is undergoing a major shift in how natural gas is extracted from the ground. Through a process known as hydraulic fracturing, or fracking, natural gas has become very cheap to remove from certain types of rock formations. Hydraulic fracking tends to produce a large percentage of the lighter, more valuable, hydrocarbons (like methane, propane, and naphtha) than other technologies. It is also relatively abundant—large shale deposits containing hydrocarbons are located in politically stable regions, like the United States.
Electricity
Generating electricity is one of the major purposes of the energy market. Electricity is used to power a large variety of modern devices. Electricity is so common that it is hard to imagine life without it. Unfortunately, electricity can’t be easily stored and it’s very expensive to transmit over long distances. Consequently, there is no national electricity market—it’s a collection of small regional markets each having unique characteristics and regulations. In each of these markets, supply and demand must constantly be matched. This results in a highly volatile spot market.
The most important physical markets are the daily power auctions held in each region. These auctions allow power producers to sell their electricity to consumers on their local power grid. Typically these auctions allow the sale of power by hourly increments on a day-ahead basis or in five-minute increments during the day that power is to be delivered. These auctions are the mechanism for setting the price of power in a region. Most speculative power trading goes on in forward markets that are separate from the daily power auctions. The forward markets are typically based on the price of delivering power at a major hub. Time horizons for forward trades range from the rest of the current month to approximately five years out.
As a general rule, on the day of delivery, the price for electricity is the same for all the participants in a local market. All producers receive the same price per megawatt and all consumers pay the same price per megawatt. This is called the clearing price for power. In deregulated markets, the clearing price is based upon bids submitted by power producers. These bids contain a price schedule, matching volumes of power to prices. Power plants are activated in lowest cost to highest cost order until the consumer demand is met. The clearing price of power is set by the cost of the most recently activated power plant. The cost of bringing the last unit of electricity into the market is called the marginal price of power, and the most recently activated plant is the marginal power plant. In general, the clearing price is set by the marginal price of power.
Electrical demand changes constantly. Every time a light is turned on or a computer is turned off, the load on an electrical system changes. Since electricity can’t be stored, this changing demand must constantly be matched against supply. There is a huge infrastructure built to manage the real-time balancing of electricity supply and demand. Being able to estimate average demand is a critical part of both the physical and financial energy markets.
Power usage is cyclical. The demand for power varies by the season, day of week, and time of day. Daytime power is a different product from nighttime power. August power is a different product than January power. This has a big effect on the trading of power—there isn’t a single electricity product. Instead there are hundreds of separate electricity products that differ based on location, month or season, and time of day.
Daytime hours (usually 7 a.m. until 11 p.m.) are called peak hours. Nighttime hours are called off-peak hours. Every region of the country uses slightly different definitions for their power products. As a result, power products are commonly described in shorthand. This abbreviation is always weekdays by hours. For example, 7×24 refers to power 7 days a week, 24 hours a day. Peak power is 5×16 or 7×16 (depending on whether weekends are included). If weekends aren’t included in peak power, there will be a separate 2×16 product. Off-peak hours are typically 7×8 or an off-peak wrap that combines 2×16 and 7×8 hours.
It is also important to understand that electrical supply and demand are regional phenomena. Each area of the country has an electrical market with unique features. These differences can make trading electricity between adjacent power grids profitable. Transporting power is called wheeling. For example, the Pacific Northwest contains abundant hydro plants that produce extremely cheap electricity when there is sufficient water flow on local rivers. Sometimes after a major snow melt in the spring months, the price of electricity can fall to zero or negative since the dams can’t be closed and every other power plant needs to be incentivized to shut down. Because this power is inexpensive, transporting it into Northern California can be profitable even though a lot of the power is lost in transport.
The Physics of Electricity
Electricity is a term used throughout this book to mean power obtained through the movement of charged particles, most commonly electrons, through some type of conductive material like a metal wire. A more precise term for this quantity is electrical current. Electricity is actually a general term that can refer to a number of different types of electromagnetic forces.
Electromagnetism is one of a couple fundamental forces that hold the universe together. For the purpose of energy trading, the most important property of electromagnetism is that magnetic fields can create electric currents in metals, and vice versa. By using this relationship, it is possible to move charged particles, like electrons, by manipulating magnetic fields. The combination of motivating force (a spinning magnet), along with a supply of electrons (found in conductive metal wires), and a closed path for them to move around (a circuit) is the basis for the electrical power industry.
One way to think about electricity is like water moving through a river. The amount of water that moves through the river determines how much work can be done. Unless it evaporates along the journey, the amount of water will be the same throughout the river’s length even though the pressure and width of the river might change in places. In some places, the river might be wide and slow and at other places narrow and fast. In a power line, voltage and current work much the same way. The voltage of an electrical line is similar to water pressure and electrical current is similar to the size of the channel. For a fixed amount of power, voltage and current are inversely proportional. Just like water pressure will increase if the nozzle of a hose is narrowed, voltage will increase if electrical current is reduced.
Just as evaporation reduces the water in a river, friction can cause wasted energy on a transmission line. More water is lost when a river is wide and slow than when it is narrow and fast. Electricity works the same way. The amount of power lost during transmission is proportional to the length of the power line and the speed of the electrical current—high voltage/low current lines lose less power than the other way around. As a result, power grids typically convert electricity to high voltages for long-distance transmission and then lower the voltage just before it is delivered to consumers.
Another concept is that electrical power needs to flow in a loop. It needs to flow in and out of every location—it can’t stop anywhere. Continuing the pipe example, water flowing through a channel can only produce work when it is flowing (like a river powering a sawmill). If the flow of electricity is ever stopped, an electromagnetic field will build up resulting in a potentially dangerous shock when it is reconnected. A related problem is a short circuit. Short circuits are like poking a hole in a straw and then trying to use the straw to drink.
Electrical Generation
Although there are many ways to produce electrical power, most power plants use a similar technology—electromagnets rotated by super-heated steam. Fossil fuel plants burn oil, natural gas, or coal to produce this steam. All of these fossil fuels produce greenhouse gases like carbon dioxide (CO2) when they are burned. Compared to the other fuels, coal-fired generation produces two to three times the pollution of the other fuels. Nuclear generators use nuclear fission to turn water into steam. Nuclear fuel provides a lot of electricity per weight—a pound of highly enriched uranium is approximately equal to a million gallons of gasoline. But, enriched uranium is subject to severe shortages and is difficult to store safely once it is discarded.
A lot of modern research is exploring alternative energy sources. Geothermal power plants tap into steam released from the Earth as part of a standard steam turbine. Geothermal power is efficient, but it is extremely limited to specific geographic areas. Wind power plants use the wind to directly spin the copper wires inside a generator to create an electric current. Hydroelectric dams use falling (or flowing) water to spin the generator. Solar power facilities turn the sunlight directly into electricity.
In many power plants, superheated steam is a byproduct of producing electricity. A recent trend in power plants is to reuse this steam instead of releasing it into the atmosphere. This is called cogeneration. If a power plant can sell steam in addition to its power output, it becomes much cheaper to operate. As a result, the final products of a cogeneration plant are often described as both heat and electricity. Topping cycle plants produce electricity first, and then use the exhausted steam for heating. In contrast, bottoming cycle plants first produce heat for an industrial process and then use the leftover heat to power a steam generator.
The efficiency at which a plant converts fuel into electricity is called its heat rate. The heat rate is typically expressed as a ratio of heat input to work output (e.g., Btu/kWh or MMBtu/MWh). A lower heat rate implies a more efficient power plant.
Electrical Transmission and Distribution
Once power is generated, it needs to be brought to the customer. Transmission refers to the bulk transfer of power from the power plant to a substation via high voltage lines. Distribution refers to the transfer of power from a substation to various consumers using much lower voltages.
Power plants, transmission lines, and substations form the power grid—a set of interconnecting power lines that provide multiple ways to route power between any two locations. The redundancy of a power grid is crucial for reliability—it prevents any single line from overloading. This helps to prevent blackouts due to a single point of failure.
Most power lines are overhead lines. They are attached to tall poles suspended safely above ground level. In urban areas, electrical power lines are sometimes buried. However, burying lines makes them much less reliable and harder to maintain. Burying power lines is uncommon in suburban and rural areas.
The choice of voltage and location for power lines is a trade-off between safety, reliability, and efficiency. As part of the transmission process, power is wasted—it’s converted into heat that must be dissipated on the power line. This waste can be reduced by using higher voltages. However, higher voltage lines are more dangerous than lower voltage ones. As part of delivering power to consumers, power plants use transformers to increase voltage for long distance transmission, and then decrease voltage for local distribution.
AC and DC Power
Most power is transmitted using alternating current (AC) power lines rather than direct current (DC) lines. With AC power, the voltage and current on the power line alternate directions making an oscillating wave. The terminals have no fixed positive or negative voltage. The primary advantage of AC power is that it’s simpler to build an AC transmission system since the voltage can be easily scaled up or down to match a specific voltage.
Both types of currents are created by placing a conductive wire into an electromagnetic field. When this happens, the electrons are pushed away from the negative part of the field and toward the positive side of the field. If the magnetic field stays constant, all the electrons will move in the same direction.
Placing a negative charge at one end of the wire will start to accelerate the electrons close to that point away from it. The electrons closest to the point will be accelerated faster than electrons farther away. Because it is moving fastest, the last electron in line will slam into the electrons ahead of it. This creates a chain reaction as each subsequent electron is pushed into the next electron in line. This is similar to a multicar collision on a highway where a shockwave moves between cars although the cars don’t move very far. Creating a shockwave at the other end of the wire will return all the electrons back to their initial state.
There are two ways of getting power through a power line. The first way to pass power through an electrical line is through the movement of electrons. This is DC power. Another way is through the shockwave caused by the collision of electrons. This wave, properly called an electromagnetic wave, propagates down the wire much faster than any of the individual electrons can move. This is AC power. It is possible to transfer energy through a power line using electromagnetic waves rather than the motion of individual electrons.
On a DC power line, whenever the line is used to provide power to some point, the voltage on the line will decline after that point. For a power grid serving variable consumer demand, this means that it will be very hard to predict the voltage on certain parts of the power grid. However, when they produce DC electricity, power plants do not need to worry about synchronizing themselves with other power plants.
The challenge with AC power is different. Although it is easy to change the voltage on the power line, it is necessary that every power generator oscillates their voltage at precisely the same time. Otherwise, the shockwaves from different power generators will collide and cancel out. AC power creates a synchronization problem that gets progressively more complicated with a large number of power providers.
Congestion
Given sufficient transmission capability, the price of power throughout a grid will be the same cost everywhere. It will be equal to the cost of the most recently activated generator. However, in periods of peak demand, the power lines connecting low cost generation plants to consumers may become overloaded. To relieve that overloading, power plants closer to the actual demand will need to be activated out of the usual order of cheapest to most expensive. Rather than spreading that higher cost between all members of the power grid, only those customers in the congested area will pay higher prices. Because this price only occurs for a single location, this is known as the locational marginal price (LMP). Most of the United States is moving toward this model of allocating costs to consumers.
To help customers manage the price risk of having purchased power at a major node and then paying a higher price for power due to congestion, a financial instrument, financial transmission rights (FTRs), can be traded. FTRs are contracts between two parties. The two parties take opposite sides of an obligation to pay or receive the difference in price between two nodes. If there is no congestion, the price at the two nodes will be the same. However, if there is congestion, one party will need to pay the other. This payment can go either way—either party can end up paying or receiving cash. Sometimes, that isn’t what is desired, so these contracts can be structured as options. FTR options allow one party to pay an upfront fee (a premium) to avoid paying on the FTR at a later point. Essentially, buying an FTR option is like buying insurance against bad prices due to congestion.
Mechanics of the Physical Electricity Market
In the United States, the physical energy markets are run as daily auctions by ISOs. Usually, there are two auctions—a day-ahead auction and a real-time auction. The day-ahead auction is an hourly auction for the following day. The real-time auction occurs throughout the day whenever extra generation is required. Generators participate in the auctions by submitting offer curves (their generation levels associated with prices) and their technical constraints (startup costs, minimum up time, etc.). After collecting offers from generators, the ISO selects the winning generators in a manner that minimizes the cost to the market.
The two auctions are distinct from one another. When creating a bid, a generator needs to decide whether to attempt to sell all of its power in the day-ahead market or to reserve some capacity to sell into the real-time market. There are potentially greater profits in the real-time market, but the risk of being inactive is also higher. In most cases, the bidding strategy used by a power plant will be dictated by its physical characteristics—how quickly it is able to come online and its efficiency at converting fuel into electricity. If a generator is not selected to operate in the day-ahead market, it is still eligible to participate in the real-time market.
However, since these are physical markets, the generators participating in the real-time auction need the ability to deliver power. Because of this, usually only generators that can start up quickly or have excess capacity participate in the real-time auction. Primarily for this reason, most of the generation capacity is allocated in the day-ahead market—the real-time market is used for balancing short-term fluctuations and unexpected demand.
Oil
Oil, or petroleum, is a liquid fossil fuel formed when decaying plant life becomes trapped in a layer of porous rock. After millions of years, heat and pressure convert decaying plant life into hydrocarbons. Some of these hydrocarbons are gases, others are solids, and still others are liquids. Petroleum is the generic name for any hydrocarbon that is liquid under normal temperature and pressure conditions. Like other fossil fuels, the mixture of hydrocarbons in petroleum can vary widely. When petroleum is first extracted from the ground, it is called crude oil. After crude oil is distilled, there are specific names for each liquid (gasoline, heating oil, etc.). The term petroleum refers to crude oil and all of the products refined from it.
The liquid properties and high energy density of petroleum make it a popular fuel for vehicles. Compared to hydrocarbon gases like methane or propane, petroleum contains a lot of energy per unit of volume. For example, a tank of a hydrocarbon gas, like propane, will only fuel a backyard grill for a couple of hours. However, the same volume of gasoline will be sufficient to drive a car for several hundred miles. Additionally, compared to solid hydrocarbons like coal, liquids are much easier to move around inside an engine.
Crude Oil Markets
The trading of crude oil is dominated by the relationship between suppliers and consumers. The major consumers of crude oil are the industrialized nations in North America, Europe, and the Asian-Pacific region. The major exporting regions are less developed countries in the Middle East and South America.
From a trading perspective, crude oil is the most important petroleum product. Historically, major oil refiners have considered it less risky to be located near consuming areas in industrialized countries rather than near the producing areas. As a result, there is an active global trade in transportation of crude oil. The refiners trade for and transport crude oil over long distances. Then, it is refined near the consuming region where it is sold to customers. Although there is some international trading of refined petroleum products like gasoline and diesel, it is much smaller than the crude oil market. Typically, the prices for refined petroleum products are regional in nature—they are determined by local regulations, supply, and demand.
There are many varieties of crude oil. The three most common crude oil benchmarks are WTI and Brent contracts. WTI crude is a common benchmark for crude oil produced in the United States. Brent crude is a common benchmark for oil delivered by ship in the northern Atlantic Ocean. There are no similar liquid trading contracts for the third common benchmark, Persian Gulf crude oil, although spot prices from Oman and Dubai are commonly available.
Crude oils are typically described by their density and sulfur content. Low density (light) crude oils have a higher proportion of light hydrocarbons that can easily be converted into high value products like gasoline. In contrast, heavy crude oils contain a larger portion of low value products that require additional downstream processing to be valuable. The density of crude oil is fairly apparent by visual inspection—light crude oil will flow freely while heavier crude oil will be more viscous. High sulfur content is highly undesirable for crude oil. Sulfur is a major pollutant and can only be removed through expensive processing. Sweet crude oil has low sulfur content, while sour crude oil contains a much higher amount.
The most valuable types of crude oil are light, sweet crudes. Both WTI and Brent crude fall into this category. These are commonly called premium crude oils.
Distillation and Crack Spreads
Refined petroleum products are created by separating crude oil into various pure liquids. Crude oil contains a variety of different liquid hydrocarbons mixed together—everything from gasoline to asphalt. To create useful products, it is necessary to separate these liquids from one another. This is done through distillation. Since each type of liquid hydrocarbon turns into a gas at a different temperature, the most common way to separate mixed liquids is to place them into a large container and heat them. As the temperature rises, the liquids will turn into a gas one at a time. This gas can be suctioned off and then returned to liquid form in a separate container by cooling. It is often necessary to go through this process several times before a sufficiently pure end product is created.
A single barrel of crude oil is turned into a large number of separate refined products. Of these, the most valuable products are gasoline, diesel fuel, and heavy fuel oils. It is impossible to produce just one distilled product without producing the others. The process of converting crude oil into gasoline involves creating every refined petroleum product at the same time. If a refiner wants to produce more gasoline, it is also necessary to produce more of the other distillates like diesel fuel, home heating oil, and asphalt.
The process of distillation links the prices of refined petroleum products to crude oil prices. If the price of crude oil rises, all of the refined products will become more expensive. However, there is a different type of link between the prices of the refined products. If a gasoline shortage forces refiners to increase their gasoline production, the market may become glutted with the other petroleum products. As a result, there is often a negative correlation between the prices of the refined products. The relationship between crude oil and distilled products is known as the crack spread.
Coal
Coal is a solid hydrocarbon fuel that is readily available throughout the world. It is easy to store, and relatively inexpensive to extract from the ground compared to the amount of electrical power that it can generate. Except for the pollution that it produces, coal is in many ways the perfect fuel for generating electricity. Unfortunately, coal is a major source of carbon (CO2) and sulfur (SO2) emissions. The pollution that results from burning coal has made it unpopular among consumers.
Coal is traditionally a low cost way to generate electricity. However, it has the drawback of being the most polluting fossil fuel. The competing desires for cheap electricity and less pollution are at odds with one another. Global efforts to reduce carbon emissions have typically deadlocked on the issue of coal-powered generation. Most countries want to use coal-fired power plants for cost reasons and would like other countries to stop using them because of pollution concerns.
Because the price of coal is generally low, transportation makes up a much higher percentage of the delivered cost of coal than other fossil fuels. As a result, most coal is used within a couple hundred miles of where it is mined. By far the biggest application for coal is electrical generation. Electrical power plants and coal mining companies are often located close together. As a result, there are relatively few people buying or selling coal on the open market. Coal is important to electrical generation, but not a heavily traded financial product by itself.
Emissions Markets
Motivated by signs of global climate change, countries have begun taking steps to reduce global levels of carbon dioxide, sulfur dioxide, and nitrogen dioxide emissions. The two most popular ways to limit pollution are through taxes and cap and trade systems. Of the two, only the cap and trade system is a trading market.
A cap and trade system sets a limit on the amount of a substance that can be produced. Everyone producing that substance is required to have a license for their production. This has the advantage of ensuring a cap on pollution levels. When licenses are freely tradable, anyone with an ability to shift to a less polluting technology can do so and make a profit by selling their licenses. By reducing the amount of licenses over time, a free market encourages that the most economical changes be made first. The two main problems facing cap and trade systems are how to distribute licenses and how to enforce compliance.
Because emissions markets create a valuable good from nothing, there is an intense debate over how licenses should be initially distributed. There are drawbacks to every approach, whether they are public auctions, assigning rights based on historical usage, or assigning rights based on population.
Tracking carbon dioxide emissions is also complicated. Lots of activities—everything from breathing to burning fossil fuel—produces carbon dioxide. Many activities remove carbon dioxide from the air as well—everything from planting a garden to injecting carbon dioxide into an underground storage facility. It is impossible for governments to monitor, require licenses, or provide carbon credits for all of those activities. This makes enforcement of carbon markets problematic.
The emissions markets are also closely linked to the use of coal to generate electricity. Although it produces more pollution, coal historically was able to produce electricity for a fraction of the cost of any alternative fuel.
The increased popularity of natural gas fracking has largely derailed carbon legislation in the United States. It has done this by making natural gas cheaper than coal. Since the primary goal of emissions markets was to remove coal as a major electrical generation fuel, many of the objectives of this legislation have been achieved at little or no cost to consumers.
Natural Gas Liquids
Natural gas liquids (NGLs) are combustible gases heavier than methane (natural gas) but still light enough to exist in a gaseous state at standard temperature and pressure. There are five NGLs: ethane, propane, butane, iso-butane, and pentane.
Compared to natural gas, the heavier NGLs, like propane and butane, are much more easily liquefied by compression. Converted to a liquid, NGLs are approximately 270 times more compact than when they exist as a gas. Since the compression for these gases can be done under only moderate pressure, this allows these gases to be transported and stored in a liquid state. A typical use for these products is as a fuel for cooking (like a backyard grill). For this use, propane might be stored in a pressurized container that will start to evaporate (convert to a gas) when a valve is opened to release it.
NGLs are commonly found dissolved within crude oil or natural gas. They are abundantly found in shale deposits that can be developed through the use of natural gas fracking. NGLs are separated from natural gas at natural gas processing plants or from crude oil at refineries. A related term, liquefied petroleum gas, refers to a mixture of two of the heavier NGLs (propane and butane).
TECHNICAL PRIMER
The technical primer is a brief introduction to some of the more complicated parts of energy trading. The goal of this section is to provide a more intuitive understanding of these topics.
Pollution
The combustion of fossil fuels produces a substantial amount of greenhouse gas emissions and other pollution. There are a number of different types of pollution. The first general category of pollution is caused when impurities or small particles trapped in the fuel are released into the air when the fuel is burned. The second type of pollution is an intrinsic part of combustion—the creation of greenhouse gases. Greenhouse gases don’t present a health hazard and are generally safe. However, when large quantities of greenhouse gases are released into the atmosphere, they have the potential to change the world’s climate.
Carbon dioxide is an odorless, nontoxic gas that is formed by the combustion of organically derived fuels. Organic fuels are composed of long chains of carbon molecules that can be broken down by combining them with oxygen. A spark is required to kick off combustion, but afterward, it is a self-sustaining process that produces more heat than is required to start the fire. The process of combining carbon with oxygen produces carbon dioxide. It is impossible to burn carbon based fuels (which encompass nearly all fuels) without producing carbon dioxide. Large amounts of CO2 can strengthen the greenhouse effect (Figure 1.1.1).
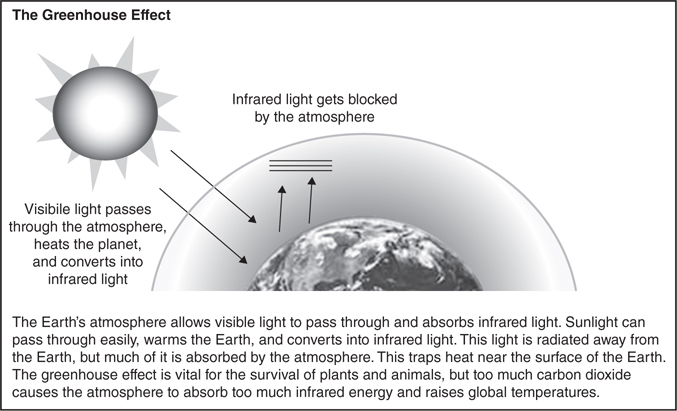
Figure 1.1.1 Graphic depiction of the greenhouse effect
Nitrogen and sulfur oxides are also produced during combustion. Nitrogen is present in the atmosphere and trace amounts of sulfur are commonly trapped in fossil fuels. When these oxides combine with water, they form acid rain. Acid rain is a regional problem that can kill vegetation and wildlife. Although most rain is slightly acidic, when large amounts of acid build up in a small area, it is poisonous.
Heavy metals like mercury, lead, and plutonium are often trapped in fossil fuels and released in the combustion process. When these metals build up in the body, they don’t decay. A large enough accumulation of these substances is toxic to humans and wildlife.
Fly ash and soot are general terms for inert particulate matter trapped in fossil fuels. Commonly, these are supersmall grains of sand or coal that were not completely burned. When suspended in the air, it is easy for these particles to get caught inside someone’s lungs. This will create breathing problems and can lead to lung damage and diseases like silicosis.
Gas, Liquids, and Solids
All substances have two major types of properties—chemical properties and physical properties. The chemical properties of a substance determine how it combines with other substances. For example, combustion is a chemical reaction between a fuel and oxygen. Physical properties involve changes in substances that don’t represent a chemical change in a substance. Water turning into steam when heated is an example of a physical phase shift. Physical phase shifts are generally reversible.
Another important physical property of materials is that if you compress a gas, it gets hot. If you want to compress it enough to make it into a liquid, you need to cool it substantially. If you don’t keep it cool, it will start to expand again. The ability to shift substances between liquid and gas forms and compress gas is the key to air-conditioning and refrigeration systems.
Physical phase shifts are the reason that distillation works. Gases and liquids will separate at certain temperatures. This is helpful for distillation, but problematic for other processes. For example, the temperature in pipelines isn’t constant. As a result, liquids often condense inside a pipeline when natural gas cools down. This causes a problem because these pipelines are air-tight so the liquids can’t evaporate.
Statistics
Statistics is the branch of mathematics focused on organizing, analyzing, and summarizing data. A substantial amount of trading vocabulary comes from the mathematical discipline of statistics. Two of the most important terms are volatility and correlation.
Volatility is used by traders to describe the risk of holding an asset. It measures the likely dispersion of prices between two periods of time. Mathematically, it is defined as the standard deviation of continuously compounded returns. A highly volatile asset is one that commonly experiences large price changes. The term volatility does not describe the investment merit of a trade.
Correlation is used by traders to describe how closely two things are related. When two assets are highly correlated, their prices tend to move together. There may or may not be a causal relationship between the two assets. Correlation can result from either random chance or a shared cause for behavior.
Financial Options
An option is a contract between two people. It gives the buyer of the contract the right, but not the obligation, to buy or sell property at some future date at a fixed price. The right to buy is called a call option. The right to sell is called a put option. Options have an up-front cost, called a premium, which is paid when the buyer purchases the option. For the buyer, options have limited downside risk. Buyers will either lose their premium or they will make a profit.
An option is an all-or-nothing type of instrument. It is possible to buy millions of dollars of options and lose the entire investment if the options expire worthless. Buying an option contract is similar to buying insurance. Most often, the purchaser will pay a premium and have the option expire worthless. Occasionally, the option will pay off big. Even though the size of the downside is small (losing the premium) compared to the potential upside (a big profit), the odds of making a profit are stacked against the option buyer. The option seller is taking on a risk from the buyer, and needs to be compensated for taking that risk.
Two common applications for options are risk management and modeling energy investments. In the energy market, there are a lot of physical decisions that need to be made on a daily basis. Do I turn the power plant on and convert my fuel into electricity? Do I lock in a fuel supply for the winter now or should I wait a little longer? Should I invest in building a new power line between Oregon and Northern California? Option theory provides a way to quantify those decisions.
From a transaction standpoint, option trading requires both a buyer and a seller. The seller takes on the possibility of a big loss in exchange for money up front. The buyer pays a premium to the seller for that service. If the option pays off, the seller will need to find the cash to pay the buyer. With options, money is not magically created; it is simply transferred between the two parties. The option buyer is described as being long the option or being long volatility (since rare events will mean a big profit). The option seller is described as being short the option or being short volatility (since rare events will mean a big loss).
When the option expires, the amount of money that needs to be transferred between the buyer and seller is determined by the payoff of the option. Every option is assigned an exercise or strike price. This is the fixed price at which trading can occur in the future. For example, a call option involves the right to buy an asset at a fixed price. The owner of a call option benefits when an asset price rises above the strike price. This allows the owner to buy at a lower price than is otherwise available. The owner can also make an immediate profit by reselling the asset at the current price.
Call_Payoff = Asset_Price – Strike_Price
if the Asset_Price > Strike_Price at expiration
A put option works similarly. A put option gives the owner of the option the right to sell an asset at a fixed price. If the asset price is greater than the fixed price, a put option is worthless. No one will willingly sell at a lower price than necessary. However, if the fixed price is higher than the asset price, the put buyer makes a profit by selling at a higher price.
Put_Payoff = Strike_Price – Asset_Price
if the Strike_Price > Asset_Price at expiration
Option Valuation
Options theory has simultaneously revolutionized the financial markets and caused a huge number of financial collapses. The mathematics behind option pricing can be very complicated. However, the basic principles are straightforward. Options prices are calculated by approximating their actual behavior.
Using models to value options isn’t a perfect process. Real life is more complicated than any model. As a result, option models are not a substitute for understanding what is actually going on. Very complex models usually mean that few people actually understand what is going on. As a result, simple models, even when they have flaws, are usually preferred over complex models. The more people who understand a model, the less chance it has of failing disastrously. It is often easier to address weaknesses in option models by making observation easier than it is to create more complicated models.
Option models are based on assumptions about asset prices. A standard set of assumptions define commonly traded, or vanilla, options. When the standard assumptions work reasonably well to describe the behavior of the underlying prices, option valuation is easy. It is possible to plug numbers into a well-known option pricing formula. In other cases, the standard assumptions don’t work so well. In those cases, it is necessary to use a more complicated approach to calculating option prices.
Options that use nonstandard assumptions about prices are commonly called exotic options. Knowing when to use an exotic option model requires understanding what is going on in real life. Option formulas basically say that “I can be used if X, Y, and Z are true.” It is up to the user of an option to determine if X, Y, and Z are true in their specific case. If not, some other formula needs to be found. There is a substantial amount of academic literature describing nonstandard option models.
While it is possible for model assumptions to change over time, option models seldom experience a catastrophic failure overnight. Usually, problems in an option model start to show up years before there is an economic impact. It is up to the people using the model to identify when things aren’t working and make sure problems are fixed quickly.
Modern option trading sprung out of research by Fischer Black, Myron Scholes, and Robert Merton in the late 1960s and early 1970s. Their research combined earlier ideas of dynamic hedging, price diffusion, and put/call parity into a continuous time framework. This allowed the creation of easy to use option pricing formula. That formula, the Black Scholes formula, opened up option trading to the masses. The Black Scholes formula and related work on continuous time finance revolutionized the financial markets and won a Nobel Prize. The most widely used option models are variants of this work and are known as Black Scholes genre option models.1
The concept behind option pricing is counterintuitive to many. Options are priced by replicating their payout by continuously trading the underlying product. Generally, the approach that was first developed by the 1970s, dynamic hedging, still works well today. The general concept of dynamic hedging was that it is possible to duplicate the payoff of a stock option by constantly trading the stock and a risk-free investment (usually a government bond). This concept has been carried into the energy market.
Options are also closely associated with volatility. Since there is an asymmetric payout for holding an option, a large price move that has a 50/50 chance of going up or down helps the buyer of the option more than the seller. The potential losses of the buyer are limited, but the potential profit is not. An option buyer benefits from large price moves, and an option seller benefits from price stability.
Deltas, Gammas, and Other Greeks
When evaluating option positions, traders often need to answer questions like “Do I expect to make or lose money if the price of oil continues to rise?” or “How much money do I expect to make or lose if an unlikely event becomes more likely?” These types of questions can be answered by sensitivity analysis. This analysis estimates the sensitivity of a trading position to something else. Most commonly, traders want to estimate the profit or loss that will occur when some benchmark goes up or down. In other cases, they will want to know how their risk will change if some type of event happens.
Many questions about risk are common enough to have acquired a well-known name, usually a letter in the Greek alphabet. These questions can be expressed as the sensitivity of one quantity to changes in another. Because they are commonly represented by Greek letters, these factors are collectively called the Greeks. A Greek is never a stand-alone piece of information like a price. Greeks are always a comparison between two assets (one of which is usually called an asset and the other an underlying). The value of the asset is sensitive to changes in the underlying.
There are five common measures of sensitivity (collectively called the Greeks):
1. Delta. The profit or loss (P&L) that occurs when the underlying changes in price.
2. Gamma. The change in an asset’s Delta when the underlying changes in price.
3. Vega. The P&L that occurs when the volatility of the underlying changes.
4. Theta. The P&L that occurs from the passage of some period of time (usually one day).
5. Rho. The P&L that occurs when the interest rate changes.
Spread Options
A specific type of option—a spread option—is especially common in the energy market. Spread options are used to price a large variety of physical energy deals. With these options, the owner of the option benefits when the difference between two prices is above a certain level. This is like a normal option except with two asset prices. Alternately, this can also be thought of as an option with a variable strike price. A spread option can be constructed to look like a standard option payout in a couple of ways. One way is to set the “price” of the option equal to the spread between the two assets:
Call_Payoff = (Asset_Price1 – Asset_Price2) – Strike_Price
Another way is to lump the second asset price into the “strike price”:
Call_Payoff = Asset_Price – (Asset_Price2 + Strike_Price)
The prevalence of spread options in energy deals is a result of the way the energy market operates—there is a focus on moving energy from one location to another, storing it for sale at a later point, and converting it from one form to another. The profitability of doing these actions depends upon the spread between two prices compared to the cost of doing the conversion—the price here versus the price there compared to transportation costs, the price now versus the price later compared to storage costs, and the price of fuel versus the price of electricity compared to conversion costs.
Valuing spread options is substantially more complicated than valuing options on single assets. In the two-asset case, the correlation between the two assets is very important. The spread between the prices of two highly correlated assets will behave differently than the spread between two uncorrelated assets. In fact, the correlation between the two assets becomes the single most important factor in the option valuation. There often isn’t a good way to estimate this correlation either—historical data may be misleading, and there isn’t usually a liquid enough market to determine the correlations being used by other people in the market.
Because of correlation’s effect on the price of spread options, and the difficulty in estimating it, correlation requires a lot of scrutiny. Managing the risk of an options portfolio requires building an infrastructure to examine correlations between products. Incorrectly estimating correlation is the single easiest way to mess up an option valuation. This estimate isn’t just important when a spread option trade is initiated—it needs to be monitored over the entire life of the trade.
ELECTRICITY MODELS
Various aspects of the electricity market are complicated enough that they merit individual discussions.
This section starts by examining the supply and demand of electricity. These topics are covered in reverse order starting with an examination of consumer demand. In most regions, there is a relatively constant baseline demand for electricity. Most of the variability in demand is a result of the weather. Over very long time frames, a decade for example, economic growth and residential trends also become important.
The next section examines the electrical supply—specifically, how ISOs pick which power plants will operate each day. Power plants must submit quotes to the ISO. Power plants are continually activated and deactivated depending on the demand for electricity. The power plants willing to offer power at the lowest cost are selected before the higher cost units. However, all power plants get paid the same price for their power. Every operating power plant gets the price submitted by the marginal power plant—either the last one activated or the next one to be turned off (depending on whether demand is increasing or falling).
After that, several important electricity trading topics will be examined in detail—models of power plants, long distance transmission lines, and various electrical generation technologies.
Forecasting Demand for Electricity: Spatial Load Forecasting
Spatial load forecasting is the study of where and when power will be required. Since power can’t be stored and must be generated on demand, it is necessary to anticipate changes in demand. In the context of this book, load is synonymous with demand for electrical power. Load is an electrical engineering term referring to the power consumed by a circuit or drawn from a power line. In the short term, load forecasts are used to schedule power plants for operation and maintenance. In the long run, load forecasting is used to construct new power lines, build new power plants, and build infrastructure projects.
One of the most important characteristics of a region is the minimum amount of power that has to be supplied at any given time to a power grid. This minimum level of power is called the base load power. It sets a threshold on the number of power plants that will be operating full time the entire year. On the other end of the extreme is predicting the maximum amount of energy that will be required at any given time (the peak demand). Power grids use estimates of peak demand for capacity planning to ensure sufficient power to meet any demand in a region. However, traders can use the same information to predict how often power prices will spike and when those spikes will occur.
Forecasting the Supply of Electricity: The Generation Stack
Power prices are set by nondiscriminatory auctions—every power producer is allowed to submit bids, the lowest bidders become the winners, and all winners receive the same price for their power. Usually there are two auctions. Most power grids hold an initial auction the day before delivery (a day-ahead auction), and then use real-time auctions to fill in unexpected shortfalls.
Because of the nature of the auctions, certain power plants tend to be very influential in setting the price of power. The most influential power plants are the ones on the margin—either the last generators selected for operation or those that just missed being selected. As the bidding strategy for power generators is often largely determined by the physical characteristics of the power plant, it is possible to group power plants into general categories. Baseload generation plants produce power cheaply, are expensive to shut down, and want to run continuously even when demand is at its lowest level. Peaking generation plants provide short bursts of power in periods of maximum demand—they are cheap to keep inactive, start up quickly, and don’t need to be very efficient. Mid-merit generation fills the gap between the two extremes. Demand for power will determine which of these general categories is on the margin.
Baseload generation plants are defined by being relatively inexpensive to operate and expensive to start up or shut down. Hydro, nuclear, and coal plants fall into this category. Hydro plants don’t have any fuel costs and may not be able to shut down without flooding nearby communities. Nuclear plants require the use of control rods to slow down the nuclear reaction—without cooling the nuclear reaction keeps on going at maximum capacity. The effect is that nuclear plants need to spend money (use control rods) in order to slow down. Coal plants are easier to shut down but can be expensive to restart if allowed to cool down completely. Most of these plants run full time. They try to avoid being on the margin, and may offer power at low costs in order to avoid going offline.
The other extreme, peaking generation, provides short-term electricity during periods of peak demand (typically summer afternoons). The primary consideration is that these plants need to start up quickly and be cheap to maintain. They don’t need to be cheap to operate—conserving fuel is an afterthought. Many of these power plants are essentially jet engines. Fuel is pumped in and ignited; there is a minimum of moving parts and there is a lot of wasted heat energy. Many of these plants only operate a couple hundred hours a year. In order to recover costs, these plants will charge very high prices for electricity.
Mid-merit plants are somewhere between the two extremes. In many cases, these plants are older, less-efficient baseload plants that are no longer cost effective enough to run full time. In other cases, these are highly efficient natural gas plants that are easier to cycle than the baseload generators. These generators are commonly on the margin and show a lot of variability in their bidding strategies. Baseload generators are always going to bid low—they need to operate full time. Peaking generators are always going to bid high—they are extremely expensive to operate. Most of the time, mid-merit plants are going to control how power is priced in a region.
There is a fair amount of gamesmanship in setting these prices. On one hand, power plants want to get the highest price possible for their product. On the other hand, since there is a single price for power in a region, it isn’t important to be the top bidder. As long as a power plant is operating, it is getting the same price as the highest bidder. There is no downside to bidding a zero price if someone else sets the price at a higher level. The marginal power plants—the ones actually setting the price—have the most complicated task. The most common strategy among mid-merit power plants is to bid some capacity at or slightly below cost and then offer progressively more capacity at higher prices.
Tolling Agreements
A tolling agreement is an arrangement where a power marketer (someone who trades electricity) rents a power plant. These agreements are for any length of time (often 20 or 30 years) and divide the job of running a power plant between two parties. One party maintains the power plant for a pre-established fee while the other party, the trader, makes all of the economic decisions. The trader (the power marketer in a tolling agreement) is responsible for supplying fuel to the plant and selling the resulting electricity into a competitive market. The trader takes on all of the economic risks and earns most of the profits (everything above the fixed maintenance fee).
A common approach to modeling both power plants and tolling agreements is to price them as a series of spread options. The power plant operator can produce electricity by burning fuel. The payoff is the difference between the two prices less the operating cost of the plant. In general, when the price of power is above the generator’s cost of production, the generator can run profitably. Otherwise, it can shut down and receive nothing. A spread model of a power plant is called a spark spread model.
There are dangers to using options to approximate physical behavior—a spread option model can ignore important physical aspects of generation like the time it takes to turn on (ramp up or cycle) and variable costs (like startup and cooling that vary based on the ambient temperature). A generator might take longer to start in the winter than during the summer. An option based model may assume power plant decisions can be made instantaneously. No matter how quickly a power plant can be cycled, it is going to be slower than instantaneous decisions implied by a spark spread model. Other real-life issues—like the effect of local regulations regarding grid reliability—can also be difficult quantify.
Because spark spread option models are less constrained than actual generators, they run the risk of overestimating profitability. This over-estimation can be as high as 20 percent to 30 percent. This can result in large errors in profit estimates and value-at-risk calculations. Since the magnitude of this error depends on local characteristics, there isn’t a rule of thumb that can be used as a “correction factor.”
Another criticism of spark spread option models is that they are reactive—in essence, they assume that a generator simply turns on or off in response to the current price. In reality, the optimal schedule for a generator must anticipate price changes, perhaps incurring a loss in some periods in order to position the generator to capture higher expected profits later on. Again, there is no one-size-fits-all rule for this. The relative importance of this problem is different for each generator.
Finally, it is far easier to price a power plant if each decision to produce power is independent of earlier decisions. In some cases, power plants are path dependent—whether the power plant was operating yesterday will factor into the decision on whether it operates today. This means that the simpler models may not be appropriate. More complicated models are harder to verify, take longer to run, and are more likely to be invalidated over time. Under most circumstances, using simpler models is preferable to using complicated models. However, because simple models are not always appropriate, it is necessary to test them regularly.
Wheeling Power
Wheeling refers to the long distance transmission of power. The cost of electrical power depends on both generation and transmission costs. Minimizing the total cost for power involves balancing these two requirements. Transmission costs are lowest if electricity is produced where it is used, while generation is often much more efficient at larger power plants. Historically, there has been a trade-off between large centralized power plants and less efficient local plants. Wheeling models analyze the trade-off between generation and transaction costs.
The purpose of wheeling is to get low cost power into an area of high prices. If allowed as a free market activity, wheeling can help lower the cost of power for consumers. As a result, wheeling is one of the primary reasons why the electrical markets were deregulated. There are a number of practical applications of wheeling models. They can be used to examine construction of new high-efficiency power plants or long distance transmission lines.
High-efficiency power plants and alternative energy plants often have specific locations where they need to be located. Their lower cost of power needs to offset the cost of transmitting power from that location. For example, a cogeneration plant needs to be located adjacent to a large user of its steam output. A hydroelectric plant needs to be located on a river at a dam, and solar facilities need to be located in sunny areas.
Another application for wheeling models is analyzing transmission of power between two power grids. There are three major interconnected groups of power grids in the United States—the Eastern Interconnect (east of the Rocky Mountains), the Western Interconnect (west of the Rocky Mountains), and ERCOT (Texas). Within each of these groups, it is possible to transmit power between the constituent power grids. For example, it is possible to purchase power in the Midwest and transmit it to the Gulf Coast. Since the Midwest tends to have coal power plants on the margin, and the Gulf Coast has natural gas plants on the margin, this provides a way to profit from any divergence in the price of coal and natural gas. This behavior also looks like an option—a fixed cost is paid to rent capacity, and there is a payoff if the prices diverge.
Financially, wheeling deals are interesting because they allow traders to buy an option based on the construction costs of the equipment rather than on the financial value of the option. This is a key aspect of trading physical products—option premiums can be extremely expensive. If the construction costs are affordable, physical investments provide an alternate way to get the financial exposures at a lower cost. Of course, the trader can lock in a profit by selling off the financial option and pocketing the difference in costs as a profit.
Solar Power
Solar power is one of the most promising sources of renewable energy. There are two main types of solar power, photovoltaic (PV) solar power and thermal solar power.
PV power converts solar power into electricity. It is produced by solar panels exposed to sunlight. The type of equipment and the intensity of the sunlight directly affect the amount of power that is produced by a solar panel. Correctly estimating the amount of power that will be produced by a solar installation is critical to its successful adoption. If estimates are too conservative, solar power will be deemed uneconomical and bypassed for other technologies. If estimates are too high, there will be a power shortfall and the economic goals of an installation won’t be met.
Thermal solar power uses sunlight to produce heat. In many cases, this heat can be used to produce electricity by powering steam turbines or replace electricity that would have been used to produce heat. There are many types of thermal solar installations. They can be anything from small-scale systems to heat outdoor pools to electrical generation facilities. A big advantage of solar power is that heat is relatively easy to store, and this allows these facilities to operate around the clock. Although they can only store heat during the day, they can use the stored heat any time.
Solar radiation varies throughout the year—it is affected by weather, the changing location of the sun, and the amount of daylight. The angle of the solar panel, its efficiency of handling direct and diffuse light, and surrounding environment all impact how much power is collected. To analyze solar installations, historical averages of solar radiation are used. These averages are collected by the regional or national governments, and provided for the purpose of estimating solar installations.
Wind Power
The wind is another source of renewable energy. It has been used for thousands of years as a pollution-free way to power windmills and sailboats. Since the 1970s, specialized windmills, called wind turbines, have been built to harness the wind as a source of electrical power. These windmills are typically grouped into wind farms and located in areas exposed to sustained high winds.
Wind is inherently unpredictable. Not only does it blow irregularly, but the amount of energy in wind is related to the cube of the wind speed. Fast gusts contain far more energy than slow steady breezes. As a result, the wind supplies irregular bursts of power. Occasionally, wind energy will provide a lot of energy. But, much of the time, it may not provide much energy at all.
Wind turbines can be expensive to install and maintain due to the constant stress that the wind places on their moving parts. When exposed to high winds for prolonged periods, a substantial amount of torque is placed on the frame of the wind turbine. This can cause the superstructure of the wind turbine to break down and deform over time. This is especially a problem when there are a number of wind turbines in close proximity. When a wind turbine is alone, the air flow around its fan blades is fairly predictable. However, when there are a large number of wind turbines together, the turbulence from the blades of the upwind units can cause chaotic air flow over the downwind units. This puts unpredictable stresses on the superstructure of wind turbines and can lead to sudden equipment failure.
The two most common reasons for consumer opposition to wind farms are the danger they present to migratory birds and aesthetic considerations. Wind turbines are often placed on major migration corridors due to the steady sustained winds in those areas. As birds fly past the wind turbines, they can be hit by the spinning blades and killed. Environmental groups are concerned that if wind power becomes common, the wild bird population will be decimated. Other protests are caused because people think that wind farms are ugly and don’t want them destroying the scenic beauty of nature.
Nuclear Power
Although it is not a renewable fuel, nuclear power is an alternative to fossil fuel–based electricity generation. Nuclear power plants, like coal-fired power plants, operate by producing superheated steam to drive electrical turbines. Both coal and nuclear plants benefit by operating at extremely high temperatures. The higher the temperature that these plants can operate at, the more efficient they become. A low temperature plant might return 25 percent of its heat energy as electricity. A larger, hotter plant might return 50 to 60 percent of its heat energy as electricity.
The primary difference between nuclear and coal plants is the way that they generate heat. Nuclear power plants generate heat through nuclear fission. Nuclear fission breaks protons and neutrons free from the nucleus of the nuclear fuel. This isn’t a combustion process, so no carbon dioxide is produced. However, nuclear power produces a different type of pollution—radioactive waste.
When concentrated, uranium, the fuel used in most nuclear reactors, is highly toxic. The fuel can also be very difficult to obtain. Although there is a lot of uranium in the Earth’s crust, it is seldom found in large deposits. There are a limited number of areas where sufficient quantities can be found to make its extraction economically feasible. Another worry is that the refining process is often identical to the process needed to make fuel for nuclear weapons. As a result, concerns of nuclear weapon proliferation are closely linked to the construction of nuclear reactors.
Energy Storage
Electricity can be stored by converting it into another form of energy, like kinetic energy or heat, and then using that energy to generate electricity. Even though efficiency of these conversions is usually low, there are cases where it becomes economically worthwhile. For example, any time electricity can be obtained for very low cost, even inefficient storage systems are economical if they were inexpensive to build. There are a large number of ways to store energy. One of the primary ways to store electricity is to use chemical energy to store energy in a battery or to use a capacitor to store voltage directly. Other ways to store energy are through the use of pressurized gas, kinetic energy, and gravity.
Levelized Cost of Entry
To forecast power prices over a very long horizon, it is often useful to examine the price at which developers might willingly build new generation in the future. If prices rise above that point, new generation will be built and push prices lower. As a result, it is possible to estimate an upper bound for power prices that might exist over a long horizon. This can be done by dividing the cost of building the unit by its expected generation volume adjusted by the time value of money. This value is called the levelized cost of entry (LCOE). This analysis can be expanded by incorporating the fixed and variable cost of running a unit (fuel, maintenance, and operations overhead). This approach is commonly used to estimate prices in both capacity markets and power purchase agreements (PPAs). Some uses for LCOE analysis include:
• PPA
• Fundamental forecasts
• Capacity markets
• Renewable energy certificate markets
The LCOE is also a convenient way to compare the overall competitiveness of different generating technologies. It represents the cost of building and operating a generating plant over a typical life span and duty cycle. Key inputs into this type of model include an estimate of the cost needed to construct new units, called the cost of new entry (CONE). This cost is spread across the expected life of the facility using a discounted cash flow (DCF) analysis to calculate the amount of daily revenue (in units of $/MW-Day). Mathematically, the analysis is very similar to the calculation of an annuity (a fixed income product often used as an example in finance or MBA classes).
Secondary Electricity Markets
There are a variety of markets that have developed around the edges of the electrical market. Three of these markets—ancillary services, capacity markets, and PPAs—help power grids reliably deliver power to consumers. Ancillary services and capacity markets are typical features of a deregulated market. PPAs are features of a power grid operated by a regulated utility. Another market, FTRs help traders manage congestion risk.
• Ancillary Services. Ancillary services markets allow a power grid to pay generators to stay partially unused so that the generator can increase or decrease production to match the changing consumer demand.
• Capacity Markets. Capacity markets help power grids ensure that they have an ability to meet the consumer demand for electricity several years into the future. Capacity markets pay money to generators to incentivize new construction and ensure that generators don’t close down too many underutilized generation units.
• Power Purchase Agreements (PPAs). In regulated markets, the regulated utility can ensure that it obtains a sufficient supply of renewable power by signing PPAs with third-party generators.
• Financial Transmission Rights (FTRs). These rights are a hedge for congestion costs. They give market participants the ability to offset the cost of transmitting power over the power grid. In most cases, they can result in both positive and negative outcomes to the owner.
NATURAL GAS MODELS
This section introduces transportation and storage models of the natural gas market. The key to understanding these models lies in understanding the physical nature of gases. Since it is a gas, transporting and storing natural gas requires different technologies than those used for solids (like coal) or liquids (like oil).
Gas isn’t very dense—it contains substantially less energy per volume than either solids or liquids. Natural gas (methane) is one of the least energy dense hydrocarbon gases—it has much less energy per volume than a gas like propane. As a result, it isn’t practical to use tanks to transfer natural gas for heating or industrial use. Because natural gas needs to be kept at supercold temperatures (−263°F) to remain a liquid, it is also impractical to distribute natural gas to consumers in that form.
Because of these constraints, natural gas is typically moved through the country via gas pipelines. Pipelines are a very efficient way to transport gas, but they do have some limitations. Gas needs to be continually injected into the pipeline from a well or storage facility and removed at the burner tip. The burner tip is a term that means a natural gas consumer. Since gas moves from areas of high pressure to areas of lower pressure, it is important that the pipeline maintains the proper ratio of pressure throughout its length. If the pressure at the burner tip were to be higher than the pressure at the well head, gas would flow back into the well.
In practical terms, this means that if a pipeline is operational, neither the injections nor removal of gas can be allowed to stop. If gas isn’t added continuously at the injection point (to create a high pressure zone) and removed at the burner tip (to create a low pressure zone), gas won’t flow in the proper direction, and the pipeline won’t operate. This is a very important concept—for a pipeline to operate, neither injections nor removals can stop just because they are uneconomical. Gas pipelines provide a public service—sometimes they can’t be turned off. If no consumer is using the gas at the burner tip, and there isn’t any storage available, it might be necessary to burn off the excess gas or make otherwise uneconomical decisions.
To prevent wasting gas, a popular solution is to store it in a storage facility. Unused oil wells, salt mines, and aquifers have all been modified for storing natural gas. Typically, these have to be kept at a higher pressure than the pipeline—this allows gas to eventually flow out of the storage facility and back into the pipeline.
Natural Gas Transportation
Compressor stations are the key to transporting natural gas through pipelines. Compressor stations create suction on one side (the intake side) and high pressure on the other side (the discharge side). Gas flows by expanding. It moves from the high pressure discharge point of one station to the low pressure suction point of the next station. Choosing the right number of compression stations to ensure reliable service is a key aspect of the pipeline business.
When arranging transportation on a pipeline, there are two major levels of service—firm service and interruptible service. Firm service is offered with a guaranteed availability except when prevented by acts of Force Majeure.2 Firm service is highly reliable but also highly expensive compared to interruptible service. Interruptible service is offered on a “best efforts” basis and is relatively cheap. However, it can be interrupted for any reason and may not be available at all. There are a number of valid reasons why interruptible service might be disrupted. The most common reason is to balance the flow of gas on a pipeline. Because of the nature of gas, its movement can never be precisely controlled. Optimizing even a relatively simple pipeline can get very complicated. Although firm and interruptible are commonly used general descriptions of service levels, each pipeline company will have a slightly different definition for the types of services that are offered.
Pipelines get paid substantially more for guaranteed levels of service than for service that is likely to be interrupted. The economics of a pipeline are based on balancing the need for redundancy in the system (allowing the sale of higher margin guaranteed service) against the cost of additional compression stations and pipes.
Natural Gas Storage
After gas is transported, it may not be necessary to use it right away. Fortunately, it is possible to store natural gas for extremely long periods of time. Most natural gas is already millions of years old. Pipelines need to keep operating around the clock, but demand is more cyclical, and natural gas must either be stored or burned off. Storage facilities help to smooth out these periods of short-term supply and demand. These facilities are located on both ends of pipelines.
Demand for natural gas is highly seasonal—the highest demand comes during the winter (for heating) and during the summer (to provide electricity for air conditioning). Storage facilities allow stockpiling of gas during periods of low demand for use in higher demand periods. This storage also provides a crucial margin of safety for short-term regional changes in demand. Storage facilities differ by the quantity of gas that can be stored and how quickly it can be removed.
All storage facilities work in a similar fashion—a large volume suitable for storing natural gas is found and connected to a gas pipeline. Unless it is nearly empty, the pressure in the storage facility will be higher than the pressure of a pipeline. Gas will need to be compressed to get it into the storage facility. This compression is done by applying suction to a pipeline (similar to attaching a vacuum cleaner to it). As long as the suction is stronger than the pressure in the storage area, the gas will flow into the storage area and not back into the pipeline. When the suction is turned off, the connection between the storage facility and pipeline will need to be closed.
The speed at which gas can be extracted will depend on the pressure of the storage facility. As a result, the extractable gas is generally divided into two pieces—base gas (or cushion gas) and working gas. The base gas is used to create sufficient pressure to get the working gas out of the storage facility in a reasonable amount of time. Base gas is usually never removed during normal operation. Operators of a storage facility have to trade-off having a large volume of working gas that can only be removed slowly or a smaller volume of working gas that can be removed quickly. During periods of peak demand, some of the base gas can be removed from the facility and delivered as working gas. However, over the long run, since removing the gas cushion slows down the speed at which gas can be removed (because removing gas lowers the pressure of the storage facility), keeping a fixed cushion of gas is required to meet ongoing operational requirements.
This last major physical constraint on a storage facility is its maximum pressure. Higher pressure means that you can store more gas in a given volume and that you can get the gas out more quickly. However, higher pressure can also cause structural problems—more stress on the facility—and a greater possibility of gas escaping into the environment. Since there are a fairly limited number of locations suitable for the storage of natural gas, the pressure constraint is usually a function of what can be found, rather than what is desired.
For a particular area, there is a limited inventory of possible locations suitable for storing natural gas. The cheapest and most reliable storage is depleted gas reservoirs. The highest performance facilities are converted salt caverns. In areas where neither of those two is available, aquifers can be used. Aquifers are permeable layers of underground rock often containing ground water. From a performance perspective, salt caverns are far superior to the other options—they can stand up to significantly higher pressures.
Liquefied Natural Gas
Another major trend in the natural gas market is to import it from other countries. It isn’t feasible to build pipelines across the ocean. Instead, natural gas is transported as a liquid. Natural gas turns into a liquid at −263° F and becomes 600 times denser than its gaseous form. Specially insulated tanker ships can be used to transport the natural gas across long distances. When the liquefied natural gas (LNG) tanker reaches a port, the LNG can be turned back into a gas by heating it. At that point, it can be placed into a pipeline for delivery to consumers.
From an environmental perspective, transporting natural gas is fairly safe. Other than being freezing cold, it is nontoxic and noncorrosive. When it is left exposed to the atmosphere, perhaps by a spill, LNG will rapidly evaporate without leaving a residue. Because of the speed at which it evaporates, natural gas also does not pose a large explosion risk. Natural gas is only explosive in concentrations between 5 and 15 percent of air. This can occur when gas is trapped in an enclosed space like a house or a storage facility. But, in any other concentrations, it will not ignite. Any time a large amount of flammable substance is in one place, there is some fire risk. However, there is much less risk with natural gas than with either oil or coal storage facilities.
There are no LNG contracts currently being traded. However, being able to transport LNG around the globe makes the natural gas market into a global market rather than a set of regional ones. For example, without LNG, the natural gas markets in Europe and the United States are completely separate. However, with the ability to transfer supply from one region to another, prices will start to converge toward a single global price.
RISK MANAGEMENT
Modern financial risk management is largely a combination of two practices—mark-to-market accounting and an analysis of earnings volatility. Supporting activities associated with risk management are an analysis of credit risks, an analysis of trading of unusual or stressed conditions, using financial transactions to reduce risk (hedging), and managing modeling risk.
Mark-to-Market Accounting
Mark-to-market is a type of fair-value accounting that applies to financial investments. It is the most common valuation standard used for energy transactions. Accounting policies around mark-to-market defines what is meant by a trading price. As a result, mark-to-market affects anything that uses prices as an input (like risk management and financial reporting). The primary alternative to mark-to-market accounting, historical cost accounting, applies to physical assets like buildings and equipment. With a few exceptions, this type of accounting values assets at their acquisition costs and this value does not change over time.
Mark-to-market is not always easy to implement for energy transactions. One cause of difficulty is a lack of potential trading partners. Sometimes there is no counterparty willing to transact a particular commodity at a specific location. In other cases, a contract might not be easily assignable to another party. For example, a PPA might obligate a utility to purchase power and various nontradable items like capacity and ancillary services from a specific electrical generation unit. If this contract specifies the generation facility, it might not be possible to sell the contract to anyone else without selling them the physical unit at the same time. This might result in a gray area where accountants would need to determine which accounting rules might apply to a particular investment.
Even so, there is a big advantage to using mark-to-market accounting—it is fairly intuitive for most assets. If an asset is purchased for $100 and the same asset starts selling for $120, under mark-to-market accounting, it will show a $20 profit. The alternative, historical cost, keeps assets marked to their purchase price until they are actually sold. Historical cost accounting can be misleading in the cases of long-dated assets because the value of those assets isn’t regularly updated. Typically, there is little choice about which type of accounting can be applied—accounting rules will specify the type of accounting that must be used.
Mark-to-Market Accounting. Mark-to-market accounting uses recent prices quoted in the financial markets to determine the value of investments. Any contract that can be traded (futures, swaps, options) will typically be subject to mark-to-market accounting.
Historical Cost Accounting. Historical cost accounting uses the purchase price of assets to determine the value of investments. This is most commonly used for physical investments (buildings, equipment) that can’t easily be traded.
On the downside, mark-to-market accounting assumes there is a liquid, fair market for price discovery. It can fail catastrophically when markets can be manipulated or are illiquid. Most of the models discussed in this book—power plants, storage facilities, and almost everything modeled as an option—are not actively traded in a liquid market. This lack of liquidity can lead to large gains and losses occurring for very little reason. For example, maybe only one trader was trying to transact on that day and had to pay a large premium to get someone to do a transaction.
From a risk management perspective, there are many issues that can be caused by mark-to-market. For example, many investment funds force a mandatory liquidation when prices drop below a certain point (this happens because a risk limit that uses price as an input is activated). In an illiquid market, it may not be possible to sell an expensive asset immediately. This can affect an investor even if they are not doing the transaction. If another trader holding an illiquid asset needs to sell (maybe they need the cash for a better opportunity), this can cause havoc in the marketplace. The other trader might end up selling an asset at low prices. This can cause a chain reaction if the price triggers risk limits at other firms. This can cause traders at those other firms to sell their investments. This will drive prices lower and cause more selling. The falling prices will force more and more traders to sell and prevent anyone from buying the cheap assets. This can trigger or exacerbate a market crash.
Finally, mixing mark-to-market instruments with historically priced instruments also creates problems. An extreme example might be a power plant that has completely locked in fuel supplies and sold its power for the next 20 years using OTC forwards. The power plant is hedged—there should be limited market risk or cash flows prior to the date of electricity delivery. However, if the power plant receives historical cost accounting and the hedges are mark-to-market, daily profits and losses in the OTC forwards will make the combination of investments look substantially riskier because the power plant does not change in value at the same time. There are special accounting rules that cover this situation called hedge accounting rules.
Value at Risk
Value at risk (VAR) is a risk management statistic that describes the size of an investment. It was originally developed to combine different types of investments into a single measure of size. For example, describing the combined size of a million-dollar stock investment and 15,000 crude oil futures is difficult. It isn’t clear which of the two investments will result in greater earnings or losses. VAR addresses this by describing the combination of investments by something that they have in common—daily changes in value. Daily changes in value are also known as earnings or profit and loss (P&L). While risk management practices vary widely, size is one of the most important components of risk, and almost all risk management is at least partially based around a VAR methodology.
Mathematically, VAR summarizes the risk of a portfolio by predicting the size of P&L movement that will occur with some frequency. For example, it is possible to calculate an estimate of the largest P&L move that will occur approximately once a month. VAR simplifies a large distribution of possible earnings into a single point. Not everyone uses the same frequency for VAR—some people prefer points that are more likely to be accurate and can be checked commonly while others prefer numbers that are more representative of a worst-case scenario. There are two main steps to calculating a VAR number (Figure 1.1.2). First, it is necessary to construct the possible P&L movements by simulation or examination of historical data. Next, it is necessary to find the value corresponding to the desired probability of occurrence.
Figure 1.1.2 Calculating VAR
By picking a single point, VAR produces a simpler estimate of risk than having to use entire distribution of predicted results. VAR gives up accuracy for simplicity. In many cases, different assets can have the same VAR (Figure 1.1.3).

Figure 1.1.3 VARs for two assets
The methodology for calculating the percentile also can vary between firms. Some risk managers prefer to examine only losses, others prefer to look at the volatility of both profits and losses. If only losses are examined, the VAR is called a one-sided VAR. If both profits and losses are examined, it is called a two-sided VAR (Figure 1.1.4). One-sided VAR is more commonly used than two-sided VAR.
Figure 1.1.4 One-sided and two-sided VARs
Because VAR is a single number, it has some limitations—it abstracts away the fundamental behavior of a portfolio. It also has many of the weaknesses associated with other measures of size. For example, it is better at indicating commonly observed changes. For instance, a 95 percent 1-day VAR of $1,000,000 doesn’t give substantially more information about a worst-case scenario loss than knowing that it is based on a $20 million stock portfolio.
VAR often assumes that most losses follow a statistical distribution. However, future events are often difficult to describe statistically. For example, P&L is not usually normally distributed—there isn’t always an equal chance of making and losing money. Many energy assets—particularly the ones that can be modeled by options—also have asymmetrical payoffs. For instance, a peaking power plant is going to lay idle for most of the year—it will lose money regularly whenever it is inactive. In all but the summer months, small operational charges will accumulate daily. A couple times a year—usually hot summer afternoons—the power plant will have the opportunity to make large windfall profits as it is pressed into duty (Figure 1.1.5).

Figure 1.1.5 An investment that benefits from volatility
With this kind of seasonal effect, it might be possible to have season-specific VAR distributions, but that isn’t a general solution to the problem. A gas pipeline that is selling firm delivery will make steady profits until a problem is encountered. Then, the pipeline will hemorrhage money. There might be some seasonality to equipment failures—but the pipeline’s is not going to show nearly the seasonality as a peaking power plant P&L where the price of power is determined almost exclusively by a seasonal factor—temperature.
Ultimately, VAR is an approximation; being simple means that it gets implemented and examined regularly. However, it is not going to handle all types of portfolios well. Sometimes additional analysis will be required. There are so many possible special cases that no general model will be able to address them all. This doesn’t make VAR worthless, just limited. It is useful precisely because it is a simple measure.
Counterparty and Credit Risk
The energy market is full of agreements made directly between two counterparties. Assessing the ability of counterparties to meet their contractual obligations is crucial to the energy business. There are two parts to examining credit risk—establishing the magnitude of the risk (the credit exposure) and the likelihood of the risk (the credit quality). Getting this information correct is important; firms will have hard limits on how much exposure they can have to a single counterparty. If estimates of loss are too high, business will be hurt and it won’t be possible to make trades. If the estimates are too low, there is risk of a catastrophic counterparty collapse.
Credit exposure identifies how much money could be lost in the event of a default. At its simplest, calculating credit exposure can assume a complete loss on every contract. This does place an upper bound on the potential loss but also tends to overestimate its severity. A more accurate estimate must include the probability of recovering assets through a bankruptcy proceeding. Certain debts (preferred debt) have priority over other debts. It is important to understand where the contracts in question fall in the recovery order.
Credit quality is the other aspect of modeling credit risk. It attempts to describe how likely a firm is to default on its payments. This is a forward-looking measure—many energy contracts last several years. There are a number of ratings agencies that provide credit ratings. These ratings can be augmented by in-house research focusing on a couple of key counterparties. There can be several layers to this analysis—a counterparty’s credit risk will depend on the credit quality of its own clients. Finally, a company is less likely to default if its large trades have moved in its favor, and more likely to default if trades have moved against it.
As a summary, credit risk can’t be eliminated, but it can be mitigated through the use of collateral and managed through supervision. If controls are too strict, it will be impossible to conduct an ongoing business. The possibility of missing trading opportunities and damaging relationships because of counterparty exposure limits needs to be balanced against the need to protect against a huge loss. Neither extreme is good—a happy medium needs to be found.
Managing Model Risk
Another type of risk is model risk, the risk that either the methodology or assumptions used to value assets becomes invalid. Poor assumptions and incorrectly designed models cause risk management problems in every financial market. However, the complexity of energy models and their extended lifetimes, make these problems especially common in the energy markets.
The energy market is full of nonstandard instruments and models of physical assets. Many energy companies will use models to value assets with lifetimes of 20 years or longer—things like power plants, pipelines, and natural gas wells. Even if a model was sufficient when first developed, it can still fail before its lifetime is up. Assumptions made 15 years earlier are often invalidated due to regulatory changes, population shifts, and technological changes. Exacerbating this problem is the problem of employee turnover—commonly, the original developers of the models have moved to another job before problems develop. After a number of years, organizations need to take steps to ensure that someone still understands every model that is in production.
Another issue common across many energy products is that many physical trading points aren’t very liquid. These trading points often need to be approximated by prices at a nearby hub. The implicit assumption is that the actual price will experience the same changes as the local hub. Sometimes, this is a good assumption. Other times, the expected relationship between the two points breaks down after a couple of years.
Another assumption that can cause problems is the correlation between two assets. The importance of spread options in energy was discussed earlier. The value of these deals is incredibly sensitive to the correlation between the two underlying assets. In these cases, the correlation can’t be readily determined from an independent source; it must be estimated and reviewed regularly.
Hedging
A hedge is a type of trading position that is intended to lock in profits or losses associated with another investment. The contract associated with a hedge is called a hedging instrument, and the other investment (the one being hedged) is called the hedged item.
Hedging transfers risk from one trader to another. Traders often use hedging to protect against risks when liquidating their trading position would be undesirable, difficult, or impossible. For example, the bondholders who lent to a wind farm might require that the owners of the wind farm lock in future income by hedging as a requirement for their money. This would guarantee that the wind farm could meet its bond payment obligations. Since the wind farm will generate power that it needs to sell, the sale price could be locked in by selling forward contracts. On the downside, locking in prices would prevent the wind farm owner from benefitting if prices rose in the future.
Although it is often hidden, there is generally a cost associated with hedging. Many producers would like to fix a price for their products. This would allow them to finance projects with other people’s money (e.g., bondholders), since production and locked-in prices would present a very safe cash flow. The issue is that there are only a limited number of counterparties who would have an incentive to arrange purchases. Most commodities are ultimately purchased by consumers (individuals or small companies) that don’t lock in prices for more than a year or two at the most.
Hedging also presents a substantial number of risk management issues. Although a hedge is equal in size (and risk) to the original investment, it generally receives much less scrutiny. This can create its own set of risks where a company will have hundreds of people agree that the original investment is worthwhile, and then under the guise of risk management, make an equally large investment exactly opposite of the investment that everyone thought was good.
Hedging also presents specific accounting issues since it often involves both tradable and nontradable investments. The hedged item (e.g., power that a power plant might produce in the future) may not be valued the same way as the hedge (the futures). Hedge accounting rules allow the hedger to avoid mark-to-market accounting for the hedged item as long as it and the hedge pass certain tests.
Weather Derivatives
Weather derivatives are financial products whose payoff is tied to weather conditions. These derivatives are usually bilaterally negotiated between market participants who want protection from or exposure to weather events. The most common weather derivatives are based on temperature. However, derivatives can also be constructed on average rainfall, snowfall, hurricanes, or similar weather data. Typical users of weather derivatives include utilities and insurance companies.
Weather presents an unusual set of risks to energy companies because it affects both volume and prices. This makes it difficult to hedge using typical financial products. For example, an uncharacteristically cold winter might lead to natural gas companies depleting their stored natural gas because more heating is required. At the same time, natural gas prices can spike due to utilities competing to acquire dwindling reserves of fuel for their customers at progressively higher prices. The combination of price and volume risk is difficult to hedge with standard financial instruments.
Weather derivatives are similar to insurance but there are differences. First, weather derivatives tend to deal with events that happen with a reasonably high degree of probability. Second, weather derivatives tend to deal with less extreme events than insurance. For example, insurance might be purchased to protect against flood or hurricane damage (involving a very large loss that might only happen once every 100 years). Weather derivatives might be purchased to protect an airline from lost business if rainfall is 10 percent more than average (a smaller loss, but one that might happen several times over a 10-year period).
1 The Bank of Sweden Prize in Economic Sciences in Memory of Alfred Nobel, 1997 was awarded to Robert Merton and Myron Scholes who developed, in collaboration with the late Fischer Black, a pioneering method of determining the value of stock options.
Black, F. and M. Scholes, 1973, “The Pricing of Options and Corporate Liabilities,” Journal of Political Economy, Vol. 81, pp. 637–654. Merton, R.C., 1973, “Theory of Rational Option Pricing,” Bell Journal of Economics and Management Science, Vol. 4, pp. 141–183.
2 Force Majeure is French for “greater force.” This is a common clause in contracts that frees both parties from liability in cases of wars, natural disasters, and other extraordinary events. Typically these events are outside the control of either party, which would prevent one or both of the parties from fulfilling their obligations under the terms of the contract.