Chapter 11
Understanding Your Financial Position
In This Chapter:
• Working with the Portfolio view
• Using the Portfolio X-Ray
• Studying your performance
• Exploring asset allocation
• Updating your investments
• Working with reports
• Utilizing Investing tab tools
• Using asset allocation
• Analyzing your portfolio
• Previewing your buy/sell decisions
• Estimating capital gains
• Setting investment alerts
As you enter your investing transactions into Quicken, whether manually or automatically via Transaction Download, Quicken builds a portrait of your investment portfolio and performance. If you’re serious about investing, you can use this information to evaluate your investing position and fine-tune your portfolio to diversify and maximize returns.
Quicken’s Investing tab offers a wide range of tools, including reports, graphs, alerts, analysis tools, and reference materials, that you can use to evaluate and strengthen your investment positions. This chapter takes a closer look at the features that can make you a better investor.
 Using the Investing Tab
The Investing tab should be your first stop for evaluating your investment position. Each of its views includes snapshots with calculated information and links to more information within Quicken and on the Quicken.com Investing page. Because the Investing tab always displays the most recent information it has, its windows are most useful immediately after downloading quotes, news, and research information, as discussed in Chapter 9. If you are using Quicken Premier or a higher version, you can tell Quicken to download quotes for you every 15 minutes. To do so, select Edit | Preferences | Investment Transactions | Automatically Update Quotes Every 15 Minutes. And even if you are downloading quotes every 15 minutes, the quotes are still 20 minutes delayed. If you need your quote data that up to date, you are better off using your broker’s site, which likely gives you real time quotes for free.

Quicken must be the active window for this to work. If you are using another program or have minimized Quicken, Quicken will not update quotes until you make it the active window.
Click the Investing tab to open the Investing tab window. By default, the first time you open the Investing tab, the Portfolio view appears, as seen in Figure 11-1. If you have visited the Investing tab before, you may need to select the Portfolio view, as Quicken remembers the last view on the Investment tab you visited. Additional information is available in the views found by clicking the Portfolio X-Ray, Performance, Allocations, or Tax Optimizer button as discussed later in this chapter.
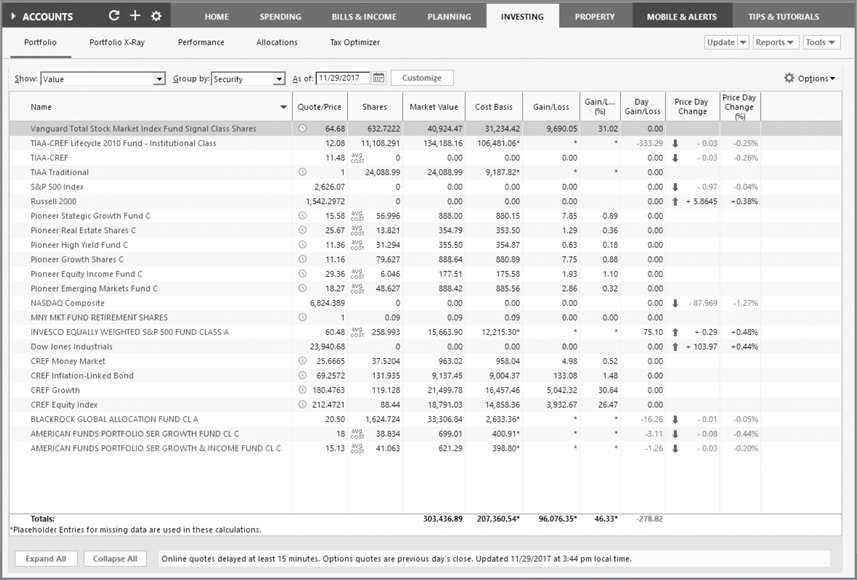
Figure 11-1 · Use the Portfolio view in your Investing tab to see your current investment holdings.
If you don’t want to wait for the Portfolio X-Ray to load each time you click the Investing tab, do not leave the Investing tab before clicking another view within it.
This part of the chapter takes you on a guided tour of Quicken’s Investing tab so you know exactly how you can use it to monitor your investments.
Working with the Portfolio View
The Portfolio view of the Investing tab displays all of your investments in one place. You can view your information in a wide variety of ways to show exactly what you need to see to understand the performance, value, or components of your portfolio. You can open the Portfolio window by clicking the Portfolio button in the Investing tab or by pressing CTRL-U from any location in Quicken. You can also add the Portfolio button to the Quicken Toolbar.
Using Portfolio View Options
You can quickly customize the Portfolio window’s view by using the Show, Group By, and As Of drop-down lists right beneath the Portfolio, Portfolio X-Ray, Performance, and Allocations buttons, seen next. You can further customize the view by clicking the Customize button. There are many view combinations—far too many to illustrate in this book. Here’s a brief overview so you can explore these options on your own.

Using Show Options The Show drop-down list enables you to specify the view by which you want the information displayed. You can customize each of the nine predefined views and have nine additional customized views as shown here. You can use the Customize button, discussed later in this section. You can also create nine “custom” views to see data in ways most useful to you.
Using Group By Options The Group By options enable you to select the order in which securities appear. The drop-down list offers six options: Accounts, Industry, Security, Security Type, Investing Goal, and Asset Class. These options correspond to information entered as part of a security’s definition, either manually when you add the security to Quicken or automatically when you download asset class information. Learn how to add securities and how to download security information in Chapter 9.
Using Portfolio Date Use the As Of drop-down list to set the date for which you want to view the portfolio. For example, suppose you want to see what your portfolio looked like a month ago, before a particularly volatile market period. You can either enter that date in the text box or click the calendar button beside the text box to display a calendar of dates, and then click the date you want to display. The view changes to show your portfolio as of the date you specified.
You can use several date keyboard shortcuts in the date field or you can use the small calendar at the right of the As Of field. When the calendar is active, press M for the beginning of the month and H for the end of the month. Find more keyboard shortcuts in Appendix A or search Help using the phrase “keyboard shortcuts.”
Customizing a View
Quicken offers an incredible amount of flexibility when it comes to displaying information in the Portfolio window. In addition to the nine pre-configured views found in the Show drop-down list, you can quickly customize any of the existing 18 views. However, you cannot delete or hide any of these views.
To customize a view, begin by using the Show drop-down list to choose the view you want to customize. Then click the Customize button to the right of the Show, Group By, and As Of drop-down lists. The Customize Current View dialog appears with the Available and Displayed Columns lists displayed, as shown next. Note that the definition for the item chosen in the Available Columns list shows beneath that list. Set options as desired in the dialog, and click OK to change the view.
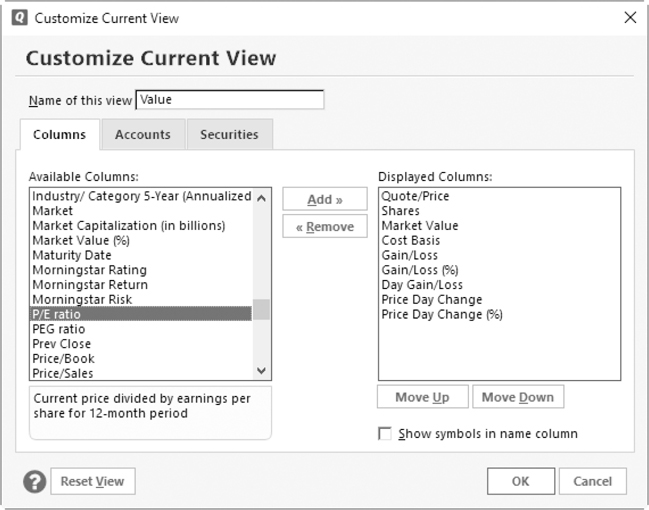
Selecting Columns to Show To display a column of information, select it in the Available Columns list and click the Add button beside it. To hide a column of information, select it in the Displayed Columns list and click the Remove button. You’re not removing the information, just choosing not to display it. You can change the order in which columns appear by selecting a column name in the Displayed Columns list and using the Move Up or Move Down button to change its order in the list.
A short explanation of the column’s data displays with a yellow highlight at the bottom of the Available Columns list for the column you currently have selected. This feature is handy when you are trying to decide which columns will be most useful to you.
Displaying Symbols Rather Than Names To display a security’s ticker symbol rather than its name, select the Show Symbols In Name Column check box found at the lower right of the Customize Current View dialog. Or you can display both the name and symbol by leaving the Show Symbols In Name Column check box blank and adding the Ticker Symbol column to the Displayed Column list.
Return to Default Click the Reset View button at the lower left of the Customize Current View dialog to return this view to the default settings.
Selecting Accounts to Include As you are customizing your view, you can specify which accounts you want to appear. Click the Accounts tab, and toggle the check marks to the left of the account names in the Accounts To Include In This View list. Only those accounts with a check mark will appear. You can specify the order in which accounts appear by selecting an account name in the Accounts To Include In This View list and clicking the Move Up or Move Down button.
Click Select All to include all of your accounts, or click Clear All to clear all of the check marks and start over. To include hidden accounts in the Accounts To Include In This View list, select the Show (Hidden Accounts) check box, as seen in the illustration. To reset the view to the default settings, click the Reset View button.
Selecting Securities to Include When working with securities to include in your portfolio, whereas new investment accounts that you create are added automatically to all Portfolio views, the same is not true of new securities you might add. When you add a new security, you must customize the Portfolio views in which you want the new security to appear.
In the Customize Current View dialog box, click the Securities tab to specify which securities should appear, as shown next. Toggle the check marks to the left of the security names in the Securities To Include In This View list. Only those securities that are selected will appear. To include hidden securities in the Securities To Include In This View list, select the Show (Hidden Securities) check box.
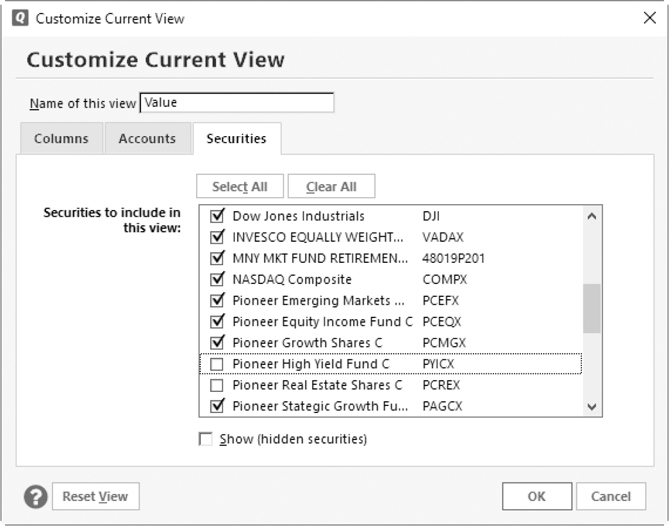
Click Select All to include all of your securities, or click Clear All to clear all of the check marks and start over.
When you have finished creating your new view, click OK to return to the Investing tab’s Portfolio view.
In some unusual circumstances, such as when you buy a security, sell all of your holdings and then buy it again, you may have to re-add the security to the Portfolio views.
Setting Portfolio View Options
Click either the Options Action icon (the small gear icon) or the word Options at the far right of the Portfolio view to customize the current view, as explained earlier, as well as to perform two additional tasks.
Portfolio Preferences From the Investing tab Portfolio view, click Options | Portfolio Preferences to open the Portfolio View Options dialog. This option enables you to specify the period for return calculations and the tax rate used in the Portfolio window, as shown here. Setting these options enables you to fine-tune the way Quicken makes Portfolio window calculations.

The Show Return Calculations From area offers options for determining the period and tax rate for which Quicken calculates the return on investment:
• Earliest Available Date, the default, includes all periods for which you have entered transactions into Quicken.
• A blank field allows you to enter a starting date for calculations, as seen earlier. All transactions between the starting date you enter and the current date are included in the calculations. Alternatively, you can use the calendar icon to set the date.
Setting this date allows you to see how an investment that you may have held for many years has been performing for a more recent period—for example, how it has performed for the last year instead of since you purchased it. This can be handy if you are trying to identify investments that performed well in the past but have recently underperformed.
• Tax Rate Used In Portfolio View allows you to choose tax rates that should be used in tax calculations for capital gains. If you are utilizing Quicken’s Tax Planner, as covered in Chapter 14, keep the default, Use Tax Planner Rate, selected. Otherwise, choose the rates that are appropriate for your financial situation. Check with your tax professional for further information about your specific situation. Click OK to save your changes and return to the Portfolio view.
Show Closed Lots This option tells Quicken that you want to display lots that have been closed.
Using the Portfolio X-Ray
If you use the Premier edition of Quicken, the Portfolio X-Ray is available to provide investment information through a partnership with Morningstar. Using this tool can help you, the investor, get a clearer view of both the weaknesses and strengths of your portfolio.
To use the Portfolio X-Ray:
1. Choose the Investing tab and select Portfolio X-Ray.
2. Select the Get Started button. Quicken connects to Morningstar to retrieve data for the securities in your Quicken investment accounts.
3. The first time you access Portfolio X-Ray, a license agreement from Morningstar may appear. Click Yes, I Agree and Continue. You may be prompted to enter your Quicken ID password. If you get an error “SAMLERROR: Redirect Failed,” there are one or more securities in your current account/security selections that Morningstar can’t identify. Try updating the accounts and/or securities selected using the two filters at the upper left of the Portfolio X-Ray view.
4. The Portfolio X-Ray view appears as seen in Figure 11-2.
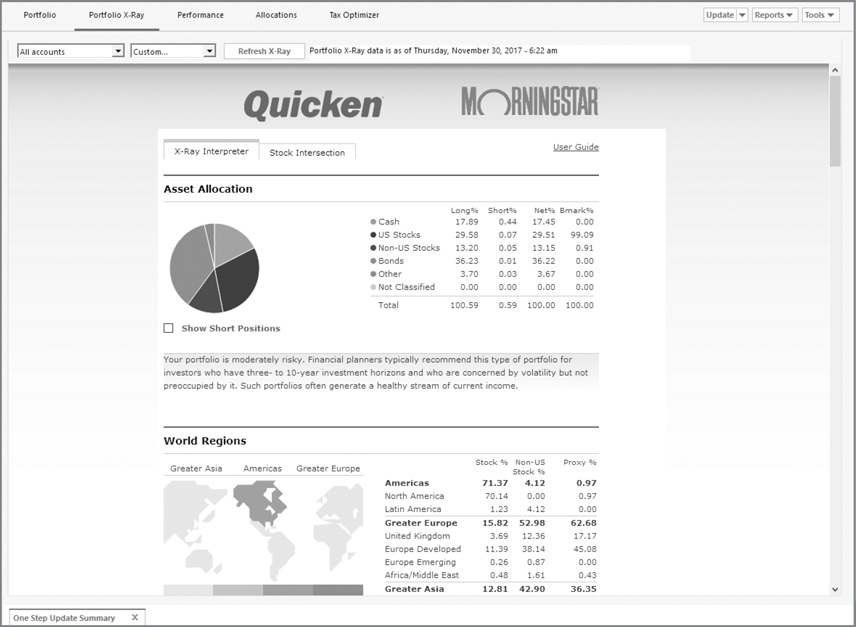
Figure 11-2 · Use the Portfolio X-Ray’s X-Ray Interpreter to see information about your investments.
If you have not yet entered any investment accounts, you will be prompted to add them when you click the Get Started button in the Portfolio X-Ray view.
Reviewing the Portfolio X-Ray Options
As with the several other views in the Investing tab, the Portfolio X-Ray view has several options.
From the Accounts drop-down list, you can choose an “x-ray” of all of your accounts, only the Investing accounts, or only the Retirement accounts; create a customized list; or select specific accounts.
With the Custom option, you may choose to show one or more of your investment accounts. Click to choose an account. Clear the check box if you do not want to view information about an account. If you have hidden accounts, select the Show (Hidden Accounts) check box to include them in the list. Use the Refresh X-Ray button to reload the information.
Use the securities drop-down list to see information on one or any number of your securities. Like the accounts drop-down list, you click to choose a security and include hidden securities. You also can clear the check box in this list if you do not want to see information. As with the accounts drop-down list, use the Refresh X-Ray button to reload the information.
The X-Ray’s Options
Within the X-Ray itself is a wealth of information. Note the two tab options, X-Ray Interpreter and Stock Intersection, as seen in Figure 11-2.
The X-Ray Interpreter The first tab, X-Ray Interpreter offers the following information:
• Asset Allocation This section reviews your holdings and indicates the risk of your investment mix. It explains what this asset mix indicates for long-term and short-term goals.
• World Regions In this section, the X-Ray analyzes the mix of your holdings world-wide.
• Stock Sectors This section indicates the mix of your holdings in various stock sectors.
• Change Benchmark You may change the benchmark for the Stock Sectors section to the S&P 500 or other portfolios with a similar investment style to your current holdings.
• Stock & Bond Style In these areas, your portfolio’s style is discussed.
• Stock & Bond Stats Here, statistical information is displayed comparing your portfolio to benchmark holdings.
• Stock Type This section shows a breakdown of your current holdings compared to the benchmark you select.
• Fees & Expenses The ratios and potential capital gains information displays in this section. Again, you may change the benchmark for this data.
• Top 10 Underlying Holdings In this section, the percentage of your total holdings is displayed by item.
Stock Intersection This section displays the top 50 items of your portfolio. Each item is shown as a percentage of your total portfolio. It indicates each item’s industry sector and when you obtained the item.
User Guide The User Guide explains in more detail what each section of the X-Ray means as shown in Figure 11-3.
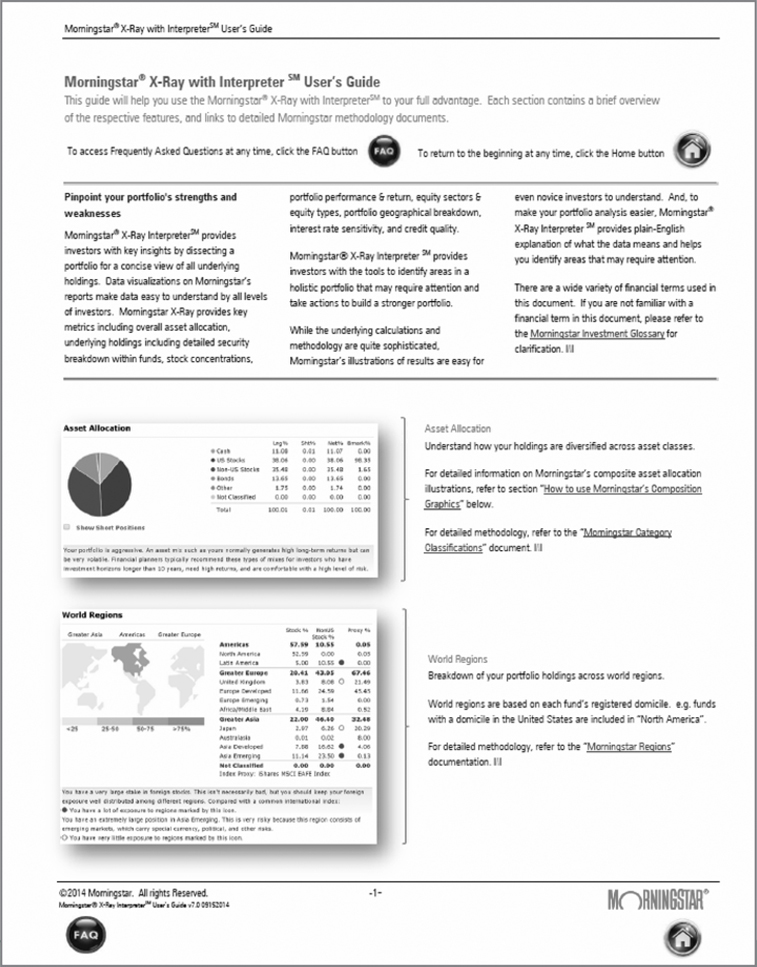
Figure 11-3 · The User Guide found in the Portfolio X-Ray contains an overview of each of the features of Morningstar’s X-Ray.
Studying Your Performance
If you are using Quicken’s Premier (or higher) edition, the Performance button’s view in the Investing tab displays graphs and tables of information about your investment performance. You can customize many of the snapshots that appear in the Performance view using commands on each snapshot’s Options menu. You can customize many of the snapshots that appear in the Performance view using commands on each snapshot’s Options menu (a small gear icon at the upper right of the snapshot). All of the snapshots on Performance and Allocations views are controlled by the drop-down list selections.
Portfolio Value vs. Cost Basis
The Portfolio Value vs. Cost Basis graph uses a line graph and a bar graph to illustrate your portfolio’s cost basis—which may or may not be the amount you’ve invested—and its market value. Ideally, you want the tops of the bars to appear above the line, indicating that your account is worth more than you spent to buy the securities.
EXPERIENCED USERS RECOMMEND
The Investment Performance report shows the average annual return (AAR) for each investment. One of my clients thought this report presented the return on investment (ROI), which is a different calculation.
• To compute ROI, you subtract the total cost of an investment from the total gain and divide that result by the total cost.
• To calculate the AAR, you add the annual return percentage rates and divide that result by the number of years.
To see ROI information, from the Investing tab, click Portfolio | Customize. From the Customize Current View dialog, choose any of the five ROI calculations from the Available Columns list and add your choice(s) to the Displayed Columns list on the right side of the dialog. Click OK to display the information, which is shown in percentages.
Be aware the investment amount is over the lifetime you have owned the security, so if you have bought, sold, and then bought some more, you may not get the results you expect.
The Options [the gear icon at the right of the graph] menu offers additional choices for this graph:
• Go To A Full Screen View Of This Graph displays a graph with only your portfolio value versus cost basis information as of the custom date you set in the Performance Date Range drop-down list. If you did not set a date, it uses today’s date.
• Show Value/Cost Basis Report tells Quicken to show the information in a report format. You can hide the report and see only the graph, or hide the graph and see only the report with one click on either the Hide Report or Hide Graph icon.
• Go To Full Portfolio returns you to the Investing tab’s Portfolio view.
Growth Of $10,000
The Growth Of $10,000 chart illustrates how an investment of $10,000 in your portfolio has grown over the period you choose. You can select check boxes beside popular investment indexes to compare your investment performance to one or more indexes, as shown next. Note the “Buy and Hold” option, which is new in this version of Quicken. This analysis helps you assess the performance of your historical trading strategy by comparing your actual results to a completely passive strategy.

If you have not updated recently and choose an index to compare to the performance of your securities, you may see a message prompting you to do an additional download.
Average Annual Return
The Average Annual Return chart displays the one-year, three-year, and five-year return on each of your investment accounts. If the account has one or more securities in the one-, three-, or five-year period, there will be an average annual return reported for the account. If the account is completely empty—that is, no cash balance and no securities—you will see N/A, as seen next. If the account has no securities in the one-, three-, or five-year period, the graph will still display a return figure, which is the same for all three periods. If you would like to include additional market indexes on your graph, you can add them using the Security List’s Choose Market Indexes button.

Your account settings in Quicken affect the accounts displayed here. You will not be able to see any accounts you have marked as Keep This Account Separate. If you do not see the accounts you expect to see, check the Tools | Manage Hidden Accounts screen to see if the account is marked as Keep This Account Separate. Also, the drop-down list for selecting the accounts to show in the Performance view lists the accounts in alphabetical order, while the Average Annual Return graph shows the accounts in the order listed in the Account List. This may be different from alphabetical order if you have ever moved accounts around in the Account List. This also applies for the Allocations view.
The options found on the small gear icon for this section let you change the information’s display, as seen here:
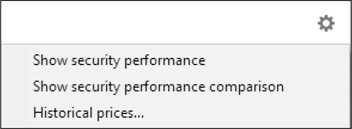
• Both Show Security Performance and Show Security Performance Comparison open a report, similar to the Portfolio view, showing how your securities have done as of a date you choose.
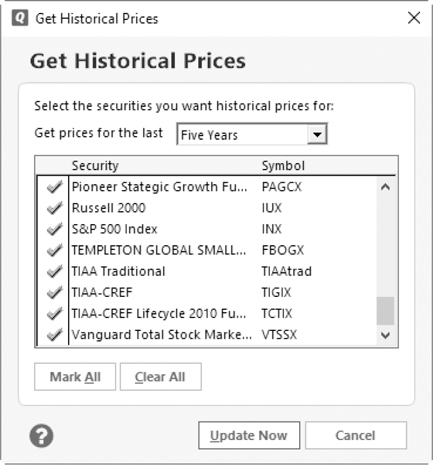
• Historical Prices opens the Get Historical Prices dialog from which you can tell Quicken to download historical prices for one or more of your securities for the last five days, the last month, year, two years, or five years. Place check marks in front of the name of each security for which you want pricing. The Mark All and Clear All buttons can help you make your selections. Click Update Now to use your Internet connection to download the data. The One Step Update Summary dialog displays when the download is complete. If you have the preference set to only show the One Step Update Summary when there is an error, you may not see it here. Click Close to close the dialog and return to the Investing tab’s Performance view.
Exploring Asset Allocation
The Allocations view of the Investing tab displays a number of customizable snapshots of your investment data in both graphical and tabular formats. Each snapshot has links to other features. Each of the graphs that appear in the Allocations view can be customized using commands on the graph’s Options menu. Buttons beneath each chart enable you to go to a full-sized graph in a report window or view a related report. You can further customize the Allocations view window by selecting one of the drop-down list options: All Accounts, Investing Only, Retirement Only, or one of your accounts. You can also select Custom to select specific accounts you want to display.
You have the same options using the securities drop-down list. Again, select All Securities or Custom to choose specific securities or show hidden securities. For both drop-down lists, click OK to close the Custom dialogs.
Reviewing Your Asset Allocation
Asset allocation, which is covered in detail later in this chapter, refers to the way in which your investment dollars are distributed among different types of investments. It’s a measure of how well your portfolio is diversified.
The Asset Allocation graph displays two pie charts: Actual allocation and Target allocation. Actual allocation indicates your portfolio’s current diversification. Target allocation is the allocation you set up with Quicken’s Portfolio Rebalancer, seen later in this chapter, in the section titled “Using the Portfolio Rebalancer.”
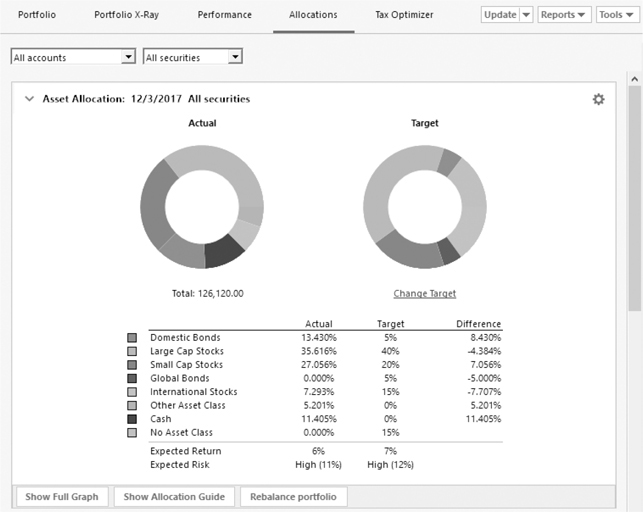
If you have not yet set target allocations, clicking Set Target under the Target graph opens the Asset Allocation Guide, where you can select Set Your Target Allocation in the left pane and then click the linked word “Set” in the right pane. You can also set the target allocations directly by selecting the options gear and then Change Target Allocations.
Allocation By Account
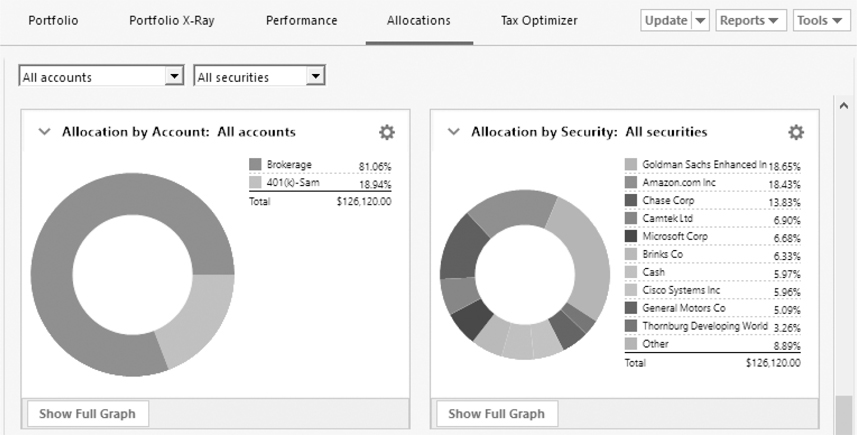
Also in the Allocations view of the Investing tab are two additional charts, shown next. The Allocation By Account chart indicates how your portfolio’s market value is distributed among the investing accounts you have entered into Quicken.
Allocation By Security
The Allocation By Security chart indicates how your portfolio’s market value is distributed among the different securities.
Mutual Fund Ratings from Morningstar
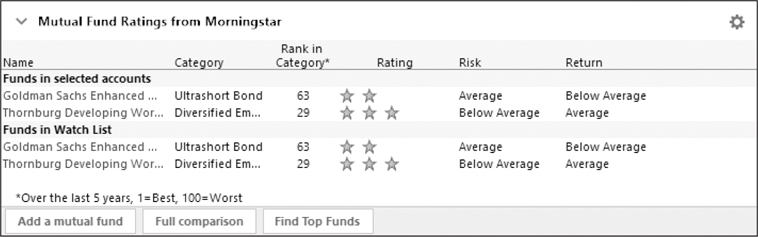
If you use Quicken Premier or a higher version, Quicken displays up-to-date ratings from Morningstar, an investment research organization that rates mutual funds based on a variety of criteria, as seen here. Ratings for mutual funds you track in Quicken are automatically downloaded with asset class and related information. The more stars, the higher the rating.
Tax Optimizer
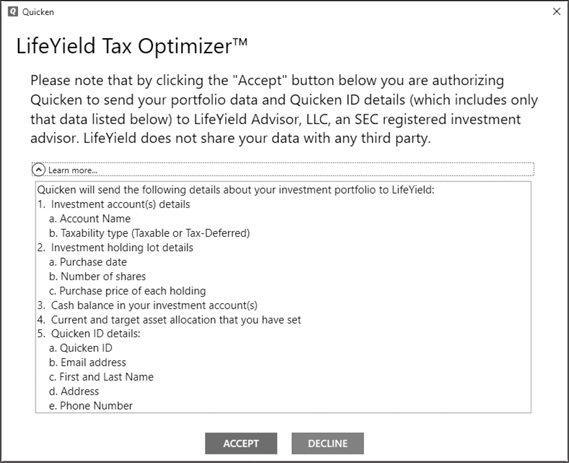
In Quicken Premier and higher versions, Quicken has partnered with LifeYield to help you monitor your portfolio for the highest tax effectiveness. This useful tool works with all your investment accounts. To access this tool, select Investing | Tax Optimizer, as seen in Figure 11-4, and click Get Started. You can also choose to watch a video tour before you begin.

Figure 11-4 · Using the LifeYield Tax Optimizer helps you with your taxable investments.
In order to use the Optimizer, your Quicken file must have all of the following:
• At least one taxable investment account
• A target allocation that you have set in Quicken
• At least 95 percent of your holdings assigned an asset class
• No placeholder transactions within your taxable accounts
When you accept the Optimizer, you authorize Quicken to send both your portfolio data and your Quicken ID details to LifeYield Advisor. The authorization sends the data shown here:
Updating Your Investments
The Update button at the right of all views in the Investing tab works with your Internet connection to keep your portfolio up to date. There are several options:
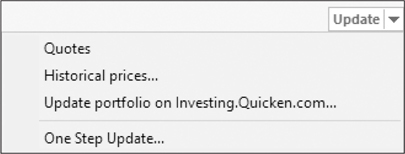
• Quotes downloads the current quotations for either your entire portfolio or the securities you have selected.
If it seems your portfolio values are not updating when you run the Quotes download, check your Download Quotes and Watch List selections in the Security List. Press CTRL-Y to open the Security List.
• Historical Prices opens the Get Historical Prices dialog discussed earlier in this chapter.
• Update Portfolio On Investing.Quicken.com opens the Preferences dialog for Investing.Quicken.com. Learn more about Investing.Quicken.com in Chapter 9, and learn more about Preferences in Appendix B. You may not see this option until you have set up Quicken.com.
• One Step Update opens the One Step Update Settings dialog from which you can tell Quicken which accounts you want to update.
Working with Reports
The Reports button’s menu, shown here, offers a wide variety of reports you can customize to meet your needs. See Chapter 15 for additional information about creating reports in Quicken.
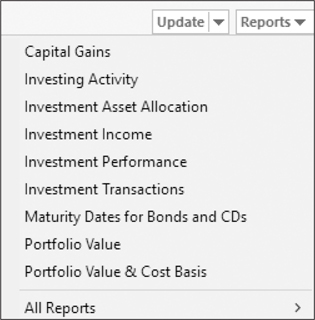
• Capital Gains reports can be for any date range you choose and can be subtotaled by Short- vs. Long-Term, Month, Quarter, Year, Account, Security, Security Type, Investing Goal, and Asset Class.
• Investing Activity reports display the activity, income (or loss), and capital gains for your accounts, based on the date range you set. This report is only available in Quicken Premier and higher versions.
• Investment Asset Allocation reports can be displayed both as graphs and reports. Use the Date Range drop-down list to tell Quicken the date range you want to display.
• Investment Income reports display the income and expenses related to your investments. These can be customized by date range, subtotals, or organization, such as Income & Expense or Cash Flow Basis.
• Investment Performance reports show the return and average annual return on your accounts based on the date range and subtotal options you choose.
When you customize the Investment Performance report, you may choose to display the cash flow detail as well as displaying the cents as in other reports. To do so, ensure the check box by Cash Flow Detail is checked in the Show area of the Customize Investment Performance dialog. This is the only report that allows you to display that information.
• Investment Transactions reports show complete data about your transactions for time periods you designate. You can subtotal in several different ways as well as customize the date range of the report to meet your needs.
• Maturity Dates For Bonds And CDs creates a detailed report of when your instruments will mature.
• Portfolio Value displays the total value of your holdings in both a graph and a report. This report can be customized by date range and subtotal intervals to show your information in the way you want to see it.
• Portfolio Value & Cost Basis reports show the cost and value of each of your securities as of the date and subtotal interval you specify.
• All Reports opens the same menu you see when clicking Reports on the menu bar.
A plethora of other customization options is available in the Customize Report dialogs. See Chapter 15 for a discussion of many of the options.
Utilizing Investing Tab Tools
The Tools button’s menu gives you access to the valuable estimators and guides provided by Quicken. See “Using the Asset Allocation Guide,” “Previewing Your Buy/Sell Decisions,” and “Estimating Capital Gains,” later in this chapter.
Using Investment Analysis Tools
In addition to the Quicken.com-based investment research tools discussed in Chapter 9, Quicken offers a number of built-in tools that can help you learn more about investing and analyze your investment portfolio.
This part of the chapter introduces these analysis tools so you can explore them more fully on your own.
Using Asset Allocation
Many investment gurus say that an investor’s goals should determine his or her asset allocation. If you’re not sure what your asset allocation should be, Quicken includes a wealth of information about asset allocation, including sample portfolios with their corresponding allocations. You can use this feature to learn what your target asset allocation should be to meet your investing goals. Then you can monitor your asset allocation and, if necessary, rebalance your portfolio to keep it in line with what it should be.
Using the Asset Allocation Guide
The Asset Allocation Guide, shown in Figure 11-5, explains what asset allocation is, why it’s important, and how Quicken can help monitor it in your portfolio. Choose Investing | Tools | Asset Allocation Guide. The Asset Allocation Guide window appears.
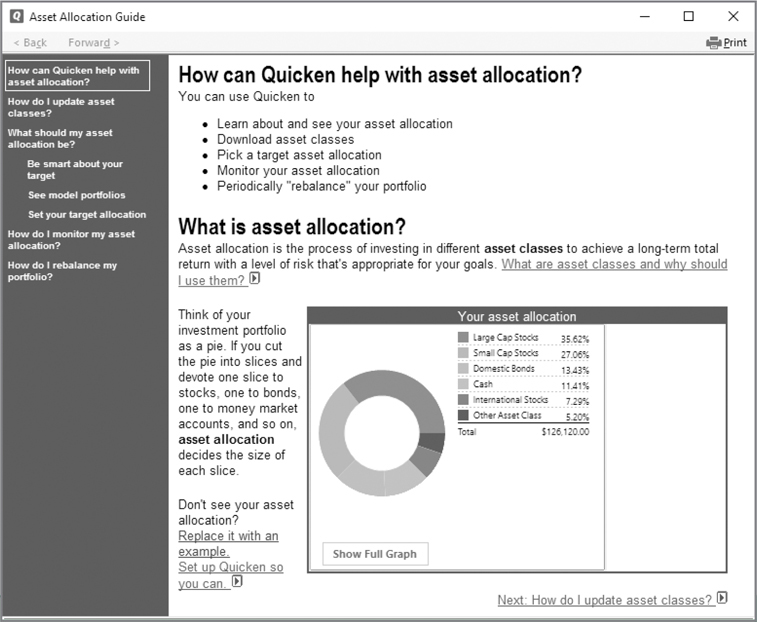
Figure 11-5 · Use the Asset Allocation Guide to learn about investing in different asset classes.
To take full advantage of this feature, read the information on the main part of the window. You can click links within the text or in the left column to learn more about specific topics. If you’re new to asset allocation, you may find the See Model Portfolios link especially useful. It shows suggested asset allocations based on risk and returns for a number of portfolios. Click Close to return to the Investing tab.
Monitoring Your Asset Allocation
To monitor the asset allocation of your portfolio, you must enter asset class information for each of your investments. You can do this in two ways:
• Manually enter asset class information Although this isn’t difficult for stocks, it can be time-consuming for investments that have an asset class mixture, such as mutual funds.
• Download asset class information If you have a connection to the Internet, this is the best way to enter this information. With a few clicks, Quicken does all of the work in seconds. The information is complete and accurate. Learn how to download asset class information in Chapter 9.
Viewing Your Asset Allocation
If you have chosen to display all of your accounts and all of your securities in the Asset Allocation graph in the Allocations view’s Asset Allocation snapshot, the pie chart that appears in the Asset Allocation Guide window is the same chart you see in your Asset Allocation snapshot in the Allocations view of your Investing tab. To get more information about a piece of the pie, hover your mouse on a “pie slice” in either location. A white, blinking box appears, displaying the asset class and percentage of portfolio value. Many users have commented that the blinking can be annoying.
Setting Your Target Asset Allocation
If you know what you want your asset allocation to be, you can set up a target asset allocation. Quicken then displays your target in the pie chart beside the current asset allocation chart on the Investing tab’s Allocations button’s Asset Allocation snapshot so you can monitor how close you are to your target.
Display the Allocations view of the Investing tab window. Then choose Change Target Allocations from the options gear icon menu at the right of the Asset Allocation snapshot. The Target Allocation dialog appears.
If you have not yet set a target allocation, the link under the target graph will be Set Target. You can click Set Target to open the Asset Allocation Guide or click Options | Change Target Allocations to enter the allocations directly.
Enter the desired percentages for each asset class. When the total of all percentages equals 100, click OK to save your settings. The Target chart in the Asset Allocation snapshot of the Investing tab window reflects your new allocation settings. If your percentages do not add up to 100 percent, the difference appears as Unclassified.
You can also change your allocation percentages by clicking the Change Target link under the Target graph.
Using the Portfolio Rebalancer
If your current asset allocation deviates from your target asset allocation, you may want to rebalance your portfolio. This means buying and selling investments to bring you closer to your target asset allocation.
Keep in mind that brokerage fees and capital gains impacts are often involved when you buy and sell securities. For this reason, you should carefully evaluate your investment situation to determine how you can minimize costs and capital gains while rebalancing your portfolio. If small adjustments are necessary to bring you to your target asset allocation, you may not find it worth the cost to make the changes. Use this information as a guideline only! As always, consult your tax professional for additional information about your specific situation.
Quicken can tell you exactly how you must change your current asset allocation to meet your target asset allocation. In the Asset Allocation snapshot of the Investing tab’s Allocations view, click the options gear icon and select Rebalance Portfolio. The Portfolio Rebalancer window appears, as shown in Figure 11-6. It provides instructions and shows you how much you must adjust each asset class to meet your targeted goals.

Figure 11-6 · Use Quicken’s Portfolio Rebalancer to allocate your investments.
Click Close to return to the Investing tab.
Analyzing Your Portfolio
Quicken’s Portfolio Analyzer enables you to look at your portfolio in a number of ways. To display it, first turn on Classic menus by clicking View | Classic Menus. From the Classic menu, click Investing | Investing Tools | Portfolio Analyzer. You’ll find these options on the left sidebar.
• Performance shows your portfolio’s average annual rate of return.
• Holdings lists your investment accounts and then shows a pie chart of your top ten holdings. Because most experts recommend that no single security take up more than 10 percent of your portfolio, you may find the percentage distribution helpful when considering diversification.
• Asset Allocation displays your current actual and target asset allocation so you can see how close you are to your target. See “Using the Asset Allocation Guide” earlier in this chapter.
• Risk Profile shows how “risky” your portfolio is when compared to the risk associated with specific classes of investments.
• Tax Implications summarizes your realized and unrealized year-to-date (YTD) capital gains or losses. Capital gains and losses are broken down into two categories: short term and long term. For additional information about tax implications, consult your tax professional.
What’s great about the Portfolio Analyzer is that it provides tables and charts to show information about your portfolio, and then it explains everything in plain English so you know what the tables and charts mean. Using this feature regularly can really help you learn about the world of investing and how your portfolio measures up. To give it a try, choose Investing | Investing Tools | Portfolio Analyzer from the Classic menu. When you have finished reviewing the information, click Close to return to the Investing tab.
You can have your cake and eat it too. If you want to refer to the Portfolio Analyzer often, but don’t want to have to switch from Standard to Classic menus to do so, with Classic menus selected, add the Portfolio Analyzer to the Quicken Toolbar. Then you’ll have easy access to the Portfolio Analyzer from both Standard and Classic views.
You may want to return to the Standard menus. If so, click View | Standard Menus. Or, you may decide you like having menu access to every Quicken feature. If so, keep the Classic Menu selection.
Previewing Your Buy/Sell Decisions
In the Quicken Premier (and higher) editions, you will find a feature called Buy/Sell Preview, which offers a quick and easy way to see the impact of a securities purchase or sale on your finances—including your taxes.
From the Investing tab when using both Standard and Classic menus, choose Tools | Buy/Sell Preview. In the top half of the Buy/Sell Preview window that appears, enter information about the proposed purchase or sale. Quicken automatically enters the most recent price information for a security you own or watch, but you can override that amount if necessary.
If you choose to model a sell, ensure you select an account with an open position for that security first; otherwise, you will see an error message when you click Calculate.
When you’re finished setting options, click Calculate. Quicken displays its results in the bottom half of the window, as shown on the following page.

The Buy/Sell Preview feature works with Quicken’s Tax Planner, as discussed in Chapter 14, to calculate the net effect of a sale on your expected tax bill or refund. Check with your tax professional for additional information. Click Done to close the Buy/Sell Preview window and return to the Investing tab.
Estimating Capital Gains
Quicken’s Capital Gains Estimator enables you to estimate capital gains or losses and their related tax implications before you sell a security. The information it provides can help you make an informed decision about which security to sell.
Getting Started
Choose the Investing tab and click Tools | Capital Gains Estimator. The Capital Gains Estimator’s welcome window appears. If you have used the tool before, you may see a message about previous proposed sales holdings changes.
Start by reading the information in the main part of the window. It explains what the Capital Gains Estimator does and offers links for learning more about specific terms and topics. Then click each of the links in the left side of the window, in turn, to step through the process of setting up the Capital Gains Estimator for your situation. You’ll be prompted to name and choose a scenario, select taxable investment accounts to include, set your tax rate, and enter capital loss carryover information. When you enter complete and accurate information, Quicken can provide a more accurate indication of tax impacts.
Deciding What to Sell
Both Quicken Deluxe and Quicken Premier users (and users of the higher editions of Quicken as well) have the What If Scenarios. However, those who use Quicken Premier (or higher editions) have the What Should I Sell feature along with the What If Scenarios. With the What Should I Sell link, you can tell Quicken both the money you want to make and identify your goals for a sale. After you enter this information, click the Search button at the bottom of the window.
A dialog appears while Quicken makes complex calculations to meet your goals. When it’s finished, you can click the View Results button in the dialog to display a scenario with the results as well as Quicken’s recommendation.
Manually Adding Proposed Sales
If you prefer, you can manually indicate proposed sales in the What If Scenario window. Step 1 shows all the securities you hold in the accounts you selected during the setup process. You can add a proposed sale in two ways:
• In the Current Holdings (Step 1) section, click the name of the security you want to sell. Then enter the number of shares and sales price in Step 2. If you have multiple purchase lots for the security, this automatically sells the oldest lots first.
• In the Current Holdings (Step 1) section, if necessary, click the plus sign (+) to the left of the security that you want to sell to display the purchase lots. Then click the lot you want to sell. This enables you to specify exactly which lots are to be sold in the Proposed Sales area.
No matter which method you use, the sale is added to the Step 2 area of the window, which lists all of the proposed sales.
To adjust the number of shares to be sold, click in the Shares To Sell field for the proposed sale (in the Step 2 area), and enter a new value. The value you enter must be less than or equal to the number of shares purchased in that lot.
You can set up proposed sales for up to three scenarios—just click the Scenario link on the left side of the window to see and set that scenario’s options. You can mix and match any sales you like to reach your goal.
Reading the Results
When all the information has been entered, you can see the true power of the Capital Gains Estimator. It tells you about the proceeds from the sales, as well as the gain or loss. If you scroll down in the What If Scenarios screen, you’ll find more information about the proposed sale and its tax implications in the Step 3 area, including the gross profit and net proceeds from proposed sales. You can click links to view the results of additional calculations, such as the tax situation before and after executing the proposed sales and gain or loss on the proposed sales. Do the same for each scenario to see how they compare—then make your selling decision. Click Close to return to the Investing tab.
Setting Investment Alerts
Investment alerts are downloaded automatically with quotes and news headlines, as discussed in Chapter 9. To open the Alerts Center from the Quicken menu bar, click Tools | Alerts Center. When you select a specific alert, or a group of alerts, the Show All tab shows the alerts you have selected to track. To see the available alert selections, click the Setup tab of the Alerts Center. Ten investment alerts are available for your use:
• Price And Volume consists of two alerts. Price and Volume alerts notify you when a security’s price rises above or falls below values you specify, as well as when the sales volume of a security exceeds a value you specify. News alerts give you the latest information about your securities, such as earnings announcements or analyst actions. The options for these are at Investing.Quicken.com. Once on the Quicken site, you will see that you can also add Portfolio alerts with which you can set alerts for your current portfolio or set up a watch list.
• Reminders has two options:
• Download Quotes, which reminds you to download information so that your portfolio is up to date.
• Maturity Date, which reminds you when a CD or bond reaches its maturity date.
• Ratings And Analysis lets you set two notifications:
• When information becomes available for stocks you track.
• When information becomes available for mutual funds you track.
• Capital Gains/Losses lets you set alerts for the following:
• Tax Implications On Sale notifies you of your tax implications when you sell a security.
• Cap. Gains For The Year notifies you if you exceed your capital gains limit for the year.
• Tax Efficient Investments provides you with information about investments that are more tax-efficient than those you already have.
• Mutual Fund Distributions provides you with information about mutual fund distributions.
• Securities Holding Period provides you with information about holding periods for securities you own.
Many Quicken users report the most useful alerts are Price And Volume, Maturity Date Reminder, Stocks Ratings And Analysis, and Cap. Gains For The Year. These alerts give timely information without information overload.
Setting Up Alerts
To set up investment alerts, click Tools | Alerts Center | Setup. Quicken displays the Setup tab of the Alerts Center window. (See Chapter 7 for more detail on setting alerts.) On the left side of the window, click the name of an alert you want to set, and then set options for the alert in the right side of the window. (You must set some alerts, such as the Price And Volume alert, on Quicken.com.) You can disable an alert by removing the check mark beside its name. When you are finished making changes, click OK to save them.
Deleting Alerts
To remove an alert, select Tools | Alerts Center, and click the Show All tab. Then check the alerts you wish to delete and click Delete. A warning message appears telling you the alert will be deleted. Click OK to confirm your deletion. If you want the alert to continue, click Cancel. Either choice returns you to the Show All tab of the Alerts Center.