CHAPTER 15
Operational Viewpoint
The Operational Viewpoint serves the interest of an audience concerned with the business processes, activities, and tasks that are performed by an enterprise or enterprise segment or that provide the context for a business solution. The Operational Viewpoint is concerned with the here and the now, as opposed to the Capability (strategic) Viewpoint, which is concerned with planning for the future.
In military operations, the Operational Viewpoint models and represents the concept of operations (CONOPS). The military mission drives the military operation. The operation involves tasks and/or activities that are conducted by one or more performers. The Operational Viewpoint represents how military tasks are orchestrated by multiple performers to achieve the desired effect or end result of the mission. A military operation also has to consider threats, battlefield conditions, and other context information that materially affect an operation.
In civilian government and commercial operations, the Operational Viewpoint represents the business processes, their decompositions into specific activities and steps, as well as the orchestration of activities required to achieve the purpose of the process. The Operational Viewpoint involves both human and automated processes that fulfill and support the mission of the enterprise.
An operational viewpoint that represents as-is architecture elements may represent current processes with current automated and nonautomated performers that enable specific activities within the process. An operational viewpoint that represents to-be, or target, architecture elements should avoid depicting solutions and focus on defining the future state only in operational terms. Deferring the decision to design the solution but focus on identifying and representing the business problem provides what the programming community calls “late binding”—offering a wider canvas for implementation as newer technologies and solution techniques become available.
Frequently, there is much debate among the architects and stakeholders on the distinctions between a business function that represents what is required in terms of the mission needs as activity, and the business process that depicts how the function is accomplished today. For example, in RMN Airport passenger identification, there is a function that must be accomplished to entitle passengers to access and to services: the process that checks badges, alien registration cards, passports, and other passenger identification documents is specific to today’s needs as well as those in the future. But the primary difference between functions and processes is that functions are enduring when the mission is enduring, but processes can change with reorganizations, technology modernization, improved business processes, or efficiency speedups. In the DoDAF, a capability is akin to the commercial function, in that they both indicate what is needed, not how it is resolved or addressed. Commercial organizations that in the past defined a purely functional enterprise are beginning to take a capability-based view of their enterprise along with its implications for service-based solutions.
Architecting Concerns for the Operational Viewpoint
The Operational Viewpoint addresses some of the architecting concerns and discipline related to operations:
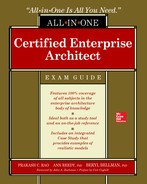
• Communicating the “big picture” to decision-makers The many details of real-world operations serve to cloud a deeper understanding of the big picture. The OV-1: High-Level Operational Concept Graphic view is a simple freeform graphical representation of the operation, depicting key players, key locations, key activities, key outcomes and results, and linkages between these. Aimed at the high-level decision-maker who has little time but great capacity to absorb and understand well-drawn pictures in briefings, the OV-1 view is essential for the architect to tell his or her operational story.
• Understanding command relationships In large and complex organizations, people’s roles are clearly defined in terms of authority and responsibility. An organizational chart depicts the roles and responsibilities and reporting relationships formally. At the same time, in collaborative operations involving people from multiple enterprises, formal memorandum of understanding, formal rules of engagement, or contracts must be put in place to ensure that collaboration will occur. The OV-4: Organization Relationships Chart view is a recording of all of these mechanisms for ensuring collaboration. In many operations, teams may be temporarily constituted for a specific purpose and be disbanded once the purpose is accomplished. In many governance and administrative operations, standing teams are put in place to function as oversight, steering, or coordination bodies. Each of these types of teams must be represented in the OV-4 view along with the permanent roles or organizational assignments that members have in addition to their team roles.
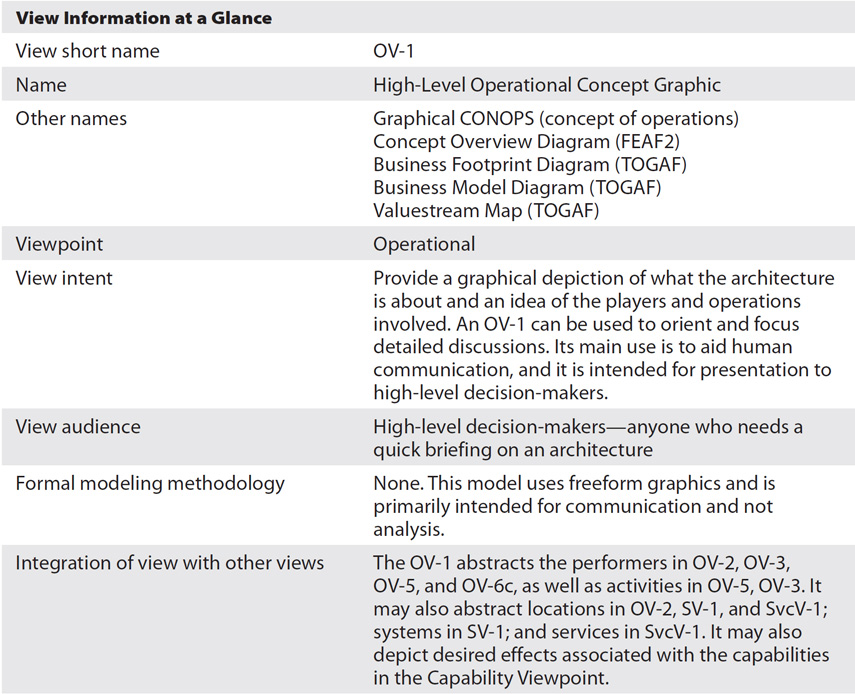
• Breaking down task complexity A complex task involves many activities and performers, many exchanges of resources, and the need for a more detailed breakdown. The OV-5a: Operational Activity Decomposition Tree view represents the orderly decomposition of activities that support an operation or process. Depending on the type of actual modeling methodology used, such models can also depict the following:
• Refinement of a larger grain activity into smaller grain activities using decomposition (OV-5a)
• Sequencing of predecessor and successor activities to indicate temporal dependencies (OV-5b)
• Resource flows (including information flows) from one activity to another (OV-5b: Operational Activity Model in conjunction with OV-2 and OV-3–Operational Resource Flow Description and Matrix)
• Constraints, rules, and guidance used to control and guide activities (OV-5b in conjunction with OV-6a: Operational Rules Model)
• Measures associated with activity performance, resource expenditure (OV-5b in conjunction with measure types and measures)
• Knowing where to start architecting The activity model is one of the first models to build in an integrated architecture, since all dynamics in an architecture come from activities and tasks. The activity model defines the span of an operational life cycle and hence serves to set the scope for the rest of the architecture. Omitting an activity also results in omitting the performers of that activity, the locations where the activity is performed, and the resource flows going in and out of the activity. Setting architecture scope frequently involves controlling the scope of the activity model. The start of an activity-focused operational viewpoint is usually through a IDEF0 context diagram (OV-5b) along with optional ancestor diagrams that show the broader context in which the key activity is placed.
• Understanding resource flows In a complex interconnection of players, understanding of resource supply lines and flows is essential, particularly if some of the players are external to the enterprise and require agreements for supply. The OV-2: Operational Resource Flow Description view is used to identify the need for resource flows between activities. Since activities are associated with performers, the OV-2 also depicts the resource flows between performers associated with the activities they are performing. The OV-3: Operational Resource Flow Matrix view is a detailed representation of all resource flows between performer pairs in the context of the activities they are performing. The OV-2 and OV-3 views therefore primarily support the interests of an audience that is interested in who the players are in the Operational Viewpoint and what the needs for information/resource exchange between the players are. In the OV-2, players can also be marked to indicate that they represent an external enterprise or another player who is external to the scope of the architecture. The OV-2 is a valuable model for providing a very quick pictorial view of the key players in an architecture and their needs to exchange resources.
• Understanding the effect of planned and unplanned behaviors The OV-6a: Operational Rules Model, OV-6b: State Transition Description, and OV-6c: Event-Trace Description views all model the dynamic behavior of the operation. All of the other operational models described depict static configurations of architecture elements for performing some role in the Operational Viewpoint.
• Flowing behavioral constraints down from guidance Guidance is related to establishing constraints on behaviors (and sometimes structures). Examples of guidance such as laws, policies, and regulations all result in rules that must be obeyed by the operations. The OV-6a: Operational Rules Model represents these rules as well as their traceability to the guidance that established the rules. These rules may be tied to operational activities through the activity model controls as in IDEF0. In Business Process Modeling Notation (BPMN), the rules that guide decision points are described in the OV-6a, while the activity model itself is modeled as a OV-5b.
• Establishing structural constraints in a database Structural rules establish database constraints, for example. A rule can constrain and assert how many instances of one entity can be related to how many instances of others; for example, a passenger can have only one passport, or a passenger may have multiple passports (dual citizens).
• Understanding activity sequencing and handoffs One of the key concerns in a mission or business process is the exact sequence in which activities are to be performed. Activity models (OV-5b) such as those built using the BPMN or flowcharts represent sequences of activities. The combination of activity performer pairs that are sequenced with other activity performer pairs shows the handoffs from one performer to another.
• Understanding event sequences Event sequencing is an important part of analyzing operational architectures in terms of the information flow and the ability to process information within certain windows of event sequences. Event sequences based on scenarios are represented in OV-6c. Events occur within the scope of some activity. The activities that are represented in the OV-6c are consistent with the activities in other views.
• Understanding state transitions An architecture object retains its state unless an activity or event changes that state. Understanding how the behaviors of activities and events can change the state of architecture objects is an important part of impact analysis—the study of desirable and undesirable side effects. The OV-6b provides the view needed to perform state-change analysis. The architecture objects, activities, and events in the OV-6b are consistent with other architecture objects within the scope of the architecture.
Operational Viewpoint Integrated Models
The Operational Viewpoint describes a set of tightly coupled models that must share many common elements such as activities, resource flows/information flows, rules and constraints, performers, and so on. A few examples of the needs for consistency between models in an integrated architecture are listed here:
• If the OV-1 depicts performers and activities, they must be consistent with performers and activities in the OV-2, OV-3, OV-5, OV-6a, and OV-6c.
• Resource flows, if depicted in the OV-2, must be consistent with OV-3 and OV-6c.
• Activities, performers, and resource flows in OV-5 must be consistent with OV-2, OV-3, and OV-6c.
• Triggering events in OV-3 must be consistent with events in OV-6c.
Operational Focus
One of the biggest challenges in architecting is to establish a viable scope. Many architecture projects find out very late in the process that the scope was too large for the development time frames. The Operational Viewpoint arguably provides the key controls over the scope. In this section, we describe a few methods to show how the scope for an architecture project may be maintained by focusing on some key architecture elements. When enterprise transformation involves focus on the Capability Viewpoint, the management of scope may be restricted to those parts of the operations that may need to change because of changes in strategy or the availability or loss of capabilities.
Operational Activity
Figure 15-1 shows the operational activity in the center of the diagram. This tends to imply that we start with defining activities based on a predefined mission or business process. Activities are “scope cuts” that also limit the performers, resources, locations, events, and other architecture elements that are related to that activity. We can take this to the next step and define the scope of an architecture as described and represented by a life cycle of activities. Often this is perceived as a value-added process by which raw materials and other inputs are transformed into a value-added product at the end of the life cycle.

Figure 15-1 Integrated models for the Operational Viewpoint
In the RMN Airport, for example, we could model the life cycle of passenger processing to understand the various stages and activities involved from the time the passenger enters the airport to the time he or she departs on an outbound flight; or we could model the life cycle of a passenger car entering the airport terminal, dropping off passengers, and parking in one of the airport operated parking ramps.
Operational Event
Another method of modeling can start with an event that sets in motion a chain of responses. By making the operational event the focus, we can then define the activities that are involved in responding to the event.
In the RMN Airport, a key event may be the event of an aircraft fire while an aircraft is parked at the gate. The modeling of the scenario starts with this event and lays out the various responses in crowd management, passenger and crew management, emergency firefighting, law enforcement activities, and other elements of disaster recovery.
Operational Location
In some architectures, location becomes a key focus for defining the expanse of the architecture scope. Notional locations such as air bases, operational centers, data centers, or military camps are all potential locations of focus. Sometimes a combination of locations and performers such as an integrated operations center becomes the focus of the architecture.
In the airport, the passenger terminal or the operations center are generic locations that may be the focus for an architecture that is focused on operations center activities or passenger terminal activities.
Performer
Traditional command and control architectures are centered on performer. A performer is assigned responsibility and accountability and is allocated or assigned various activities. In the federal government, key positions are defined by law and their responsibilities defined in acts. In the military, key roles as well as their duties are defined in joint operations. Sometimes, especially in future architectures, the performer may not be known and is replaced with a business function that is a placeholder for the performer.
In the airport, the concessions manager is a performer who may be of interest in defining a small enterprise around airport concessions. The scope of the architecture will be focused on the responsibilities, duties, and activities around the concessions manager such as managing activities, performers, resources, and events within the airport’s collection of concessionaires that provide food, parking, gift shop, shoeshine, overnight accommodation, showers, and other passenger amenities that are not directly related to the core domain of aviation.
Views in the Operational Viewpoint
The Operational Viewpoint contains nine views:
• OV-1: High-Level Operational Concept Graphic The OV-1 is a key communication tool to show how the operational concept works. The OV-1 is a free-form pictorial representation of the various elements of the operation and their relationships, and its primary aim is to communicate at a high level the operational concepts to decision makers, planners, and architects. The OV-1 can describe a mission, a class of missions, or scenarios. It is primarily used to represent the elements of an operational solution.
• OV-2: Operational Resource Flow Description The OV-2 depicts flows of resources between activities also showing the performers of those activities. The OV-2 is a DoDAF-described model that requires a formal representation that is defined by the DoDAF. It can be used to show flows of funding, personnel, and materiel in addition to information. The OV-2 does not show how resources are exchanged, but simply what is exchanged between activities with their corresponding performers. In the OV-2, given the constraints of diagrammatic representation, resource flows are represented in an aggregated manner for compactness. The OV-2 acts as a communication tool to depict resource flows across the scope of the architecture.
• OV-3: Operational Resource Flow Matrix The OV-3 details the compact resource flows depicted in the OV-2 in the form of a matrix that shows the exchange activities with their performers, as well as a breakdown of the aggregated resources and descriptions of the resource elements. The OV-3 may contain contextual attributes and performance attributes/requirements for the resource flows within an operational context for the operations. The OV-3 may also contain attributes for information assurance such as security classification and identification of privacy requirements. The OV-3 is the operational blueprint for a detailed description of resource exchanges. It can be used to determine if there are any exchange requirements that have been omitted or not detailed with attributes such as exchange timeliness requirements, security classification, or throughput requirements.
• OV-4: Organizational Relationships Chart The OV-4 shows the relationships among organizations that are acting as performers in the operational architecture. Based on the nature of the organizations involved, these may range from a command relationship to one defined by contractual agreements. The OV-4 may also depict temporary force structures as well as permanent organizations. The OV-4 is used to ensure that the command and organizational relationships are consistent with other aspects of the architecture such as resource flows that require prior establishment of formal relationships to occur effectively and repeatedly.
• OV-5a: Operational Activity Decomposition Tree The OV-5a is a hierarchy diagram that systematically breaks down a complex activity into its components. A common technique in activity modeling methods such as IDEF0 (or pools and performer swim lanes in process models), the OV-5a depicts the scope of a complex activity through its decomposition. The OV-5a acts like a summary explanation of how a complex activity can be broken down into simpler ones and is a good communication and validation tool to determine if there are any holes in understanding.
• OV-5b: Operational Activity Model The OV-5b is focused on detailing activities with the input and output resources they transform, their performers, and the constraints and drivers (controls) that guide their execution. In formal modeling techniques such as IDEF0, the OV-5a and OV-5b are part of the same model set—the decomposition of the activities is also followed by the decomposition of inputs, outputs, controls, and performers. The OV-5b is a complete characterization of the activity that describes and explicitly represents all aspects required for an implementation.
• OV-6a: Operational Rules Model The OV-6a tabulates the business rules that are constraints on the way that business is done in the enterprise. At the enterprise level, these may represent laws, regulations, policies, and rules that guide and constrain the enterprise. At the mission or scenario level, these may be specific rules that flow down from the laws, policies, and regulations that are applicable to the specific scenario. The OV-6a is useful to ensure that governance can be effectively applied to the operations and compliance is explicitly represented in the architecture.
• OV-6b: State Transition Description The OV-6b is a formal mathematical model for describing the state or status transitions of some operational architecture element that has interesting state. The combination of the object’s current state and triggering event (usually caused by an activity) causes a transition to the object’s next state. A simple application of the OV-6b is to describe the status changes in a work product as it travels through a workflow process. The key to OV-6b is to identify the object that has state. Actions can be associated with transitions.
• OV-6c: Event-Trace Description Each OV-6c includes a textual scenario that illustrates a critical sequence of events, such as a performance or security critical sequence. It can also be used to illustrate details of a concept of operations in a way similar to a use case. The OV-6b also includes a graphic that traces the sequence of events in terms of the series of resource exchanges from the OV-3 involving performers and activities triggered by the events as described in the scenario. This modeling technique is designed for modeling discrete events.
OV-1: High-Level Operational Concept Graphic
Example: Passenger Identification OV-1
Figure 15-2, drawn as an unstructured picture, simply depicts that a common form of identification process will be used for the passenger at multiple locations—a significant improvement from the current situation, where each location is performing its own passenger identification—with mixed results!

Figure 15-2 Passenger identification OV-1: High-Level Operational Concept Graphic
Because of the free form of expression, the architect has the freedom to choose the focus of the OV-1. In geographic military operations, for example, the backdrop of the OV-1 may be the terrain inside the theater. In phased activities, the OV-1 may have a life cycle “arrow” depicting the phases and their sequence with markings for specific activities and players. The OV-1 is therefore really a picture and not a “Model” because of this creative freedom it offers.
OV-2: Operational Resource Flow Description


Example: Passenger Identification OV-2
The OV-2 is a structured graphic (Figure 15-3) view depicting need lines—needs for resource exchange between the end points—typically performers, activities, and location combinations. The solid lines represent the current (as-is) resource flows. The dotted lines represent the envisioned future state resource flows. The OV-2 is a topological map of resource flows, an abstract graph where the vertices represent performers, activities, and locations and the edges represent need lines or needs to exchange resources. Optionally the flow lines can be annotated with specific resources that are flowing between the end points—information elements, materiel, personnel, or funds. It is one of the simplest models to build and provides a quick overview of key players and key operational need line interfaces. It can also be more compactly depicted as a matrix with the two axes both representing performers and the intersecting cells representing whether there is a need line requirement between the performers in the X and Y axes for that cell.

Figure 15-3 Passenger identification OV-2: Operational Resource Flow Description
OV-3: Operational Resource Flow Matrix


Example: Passenger Identification OV-3
The following table shows the OV-3 as an elaboration of the need lines depicted inside the OV-2. Each specific resource flow for each specific need line in the OV-2 is detailed with a description of the sender, receiver, sending activity, receiving activity, as well as the resource and resource type that are exchanged.


The OV-3 may also show attributes of the resource flow (not shown in example), such as throughput, measurement units, and so on. In the case of information flows, attributes such as personally identifying information (PII) or security classification are important to define operationally in the OV-3 before jumping in and implementing systems exchanges that could compromise these attributes.
OV-4: Organizational Relationships Chart

Example 1: RMN Terminal Operations Division Organization Relationships Chart
The RMN Terminal Operations Division (TOD) chart (Figure 15-4) depicts the formal reporting relationships that are useful to understand in the context of the terminal operations Segment Level architecture. Not shown on this organization relationships charts are organizations external to the TOD. These will be added as the OV-2 gets fleshed out. This example includes information on lower-level organizations from the AV-2.

Figure 15-4 Terminal operations OV-4: Organizational Relationships Chart
The example OV-4 is very simple. In reality, the OV-4 encompasses all types of organizational relationships and is not restricted to the formal reporting structures. In fact, the OV-4 is a very useful model to clarify relationships between standing organizations (permanent structures) and temporary organizations constructed for some purpose such as task forces, working groups, committees, and oversight and review boards. Frequently, members of the permanent organizations are also assigned roles in these temporary structures and must be represented in the OV-4 to gain a fuller insight into their interactions.
Example 2: Passenger Identification OV-4
This OV-4 (Figure 15-5) depicts in great detail the roles and organizations that surround the passenger in the context of passenger identification. Notice that these relationships are governed by many considerations: contracts and agreements, formal reporting authority, customer-supplier relationships, and legal and regulatory forces to comply. This model is more realistic of a real-world situation. The OV-4 may also be overlaid with relationships that are based on real-world aberrations as well to recognize that these relationships do influence the behavior of the architecture.

Figure 15-5 Passenger identification OV-4: Organizational Relationships Chart
OV-5a: Operational Activity Decomposition Tree
OV-5b: Operational Activity Model

Example 1: Functional Decomposition of RMN Airport’s Enterprise Business Functions
Though we have described the difference between business functions and process activities, we will use the OV-5a view to depict the decomposition of business functions at RMN Airport (Figure 15-6).

Figure 15-6 RMN enterprise business reference model OV-5a: Operational Activity Decomposition Tree
The example depicts the functional decomposition of RMN Airport’s business functions as a hierarchy (OV-5a). Core mission functions of operating an airport are distinguished from supporting functions that are required to ensure that core mission functions can be accomplished. A business reference model such as this is very useful for representing the span of an enterprise’s functions and can be augmented to display top-level business processes under those functions.
Example 2: Passenger Identification OV-5a: Operational Activity Decomposition Tree
In Figure 15-7, the example OV-5a is shown as activity decompositions from a variety of contexts. The figure shows the decompositions from the viewpoints of the immigration officer, the duty-free store clerk, the customs officer, and the storage clerk, for example. Because each of these roles (viewpoints) can see only their own activities, we wind up with a clump of decompositions that must later be orchestrated by a threading activity model, as shown in the next example.

Figure 15-7 Passenger identification OV-5a: Operational Activity Decomposition Tree
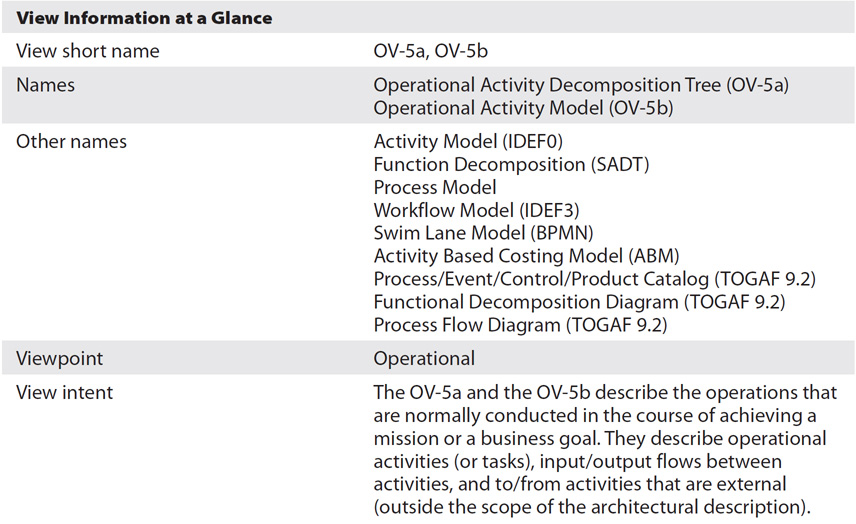
Example 3: Passenger Identification OV-5b: Operational Activity Model
In this model (Figure 15-8), we represent each of the viewpoints shown in the OV-5a as a swim lane. The activities inside the swim lane represent those that are visible to the respective performer. The lines are used to trace the control flow or handoffs of activities. The straight vertical lines show the information flows as annotations. The OV-5b information flows must be consistent with the OV-3 in the same architecture, which also shows information flows between the performers. Notice that the OV-3 can be easily derived from an annotated BPMN activity model that shows data flows.
Figure 15-8 Passenger identification OV-5b: Operational Activity Model
We talk about “Happy Day scenarios” as activity sequences that do not have exceptions and that flow smoothly. In real life, we need to take into account all outcomes of the decision boxes in an activity model and handle the processing of those decisions appropriately.
The popular and widely used IDEF0 technique is excellent for progressive refinement and exposition of activities as well as their inputs, controls, outputs, and mechanisms (ICOMS), but it is not so good at representing orchestration of many activities by many performers in one diagram such as the swim lane or BPMN method does. Some modeling techniques are good at representing the hand-off of one activity to another (control flow), while others are better at depicting input-output flows. Each modeling technique has its strengths and weaknesses, and thorough discussion of activity modeling is outside the scope of this book.
OV-6a: Operational Rules Model


Example: Passenger Identification OV-6a: Operational Rules Model (Fragment)
The following example contains the form of rules found in source documents. These would need to be translated into some formal rules notation to become useful for behavior modeling. For example, the TSA guidance listing the types of acceptable passenger identification documents would be translated into at least 16 separate formal rules (since rules need to be atomic).


It is important to cite the authority for rules. In the rules model, rules are generally tied to activities and performers though they can be associated with measurement, assessment, formulae for transforming values, and so on. A tailored form of the OV-6a can be used to associate rules with architecture elements. The DoDAF categorizes rules into the following major categories:
• Structure assertion rules These rules constrain structural or existential relationships. Examples of such rules are definitions of customer, transaction, and so on. Structure assertion rules are used to build the logical data model for database implementation and often reflect data relationships.
• Action assertion rules These rules constrain operational behaviors. They are frequently represented by decision boxes that apply to branching of an activity sequence based on the evaluation of conditions.
• Derivation rules These rules determine how computations are performed to derive data from other data. Examples of these are equations, formulas, and lookup functions.
OV-6b: State Transition Description

Example: Passenger Identification OV-6b
The state transition diagram (Figure 15-9) represents the state of a passenger through his or her movement through the terminal. A passenger is assumed to have a prior booking. The completion of the check-in activity transforms the passenger from a booked passenger state to a checked-in passenger state. Once the passenger enters the security screening area, he or she becomes subject to the screening process. If the screening process proceeds without any exceptions—that is, no triggering of any monitors or any selection of the passenger for additional screening—the passenger is cleared. If the additional screening fails to uncover some threat, the passenger is cleared. Cleared passengers go on to board their aircrafts with the agents scanning their boarding passes at the gate. If additional screening uncovers some confirmed threat, a passenger is detained.

Figure 15-9 Passenger identification OV-6b: State Transition Description
The example serves to illustrate the technique in a deceptively simple and readable manner in a very contained scenario. In reality, state charts can get complicated with decision boxes, nested states, and concurrent transitions that have to meet at the same point. Not every object or class has interesting state. This technique is best used when the understanding of state and state transitions is important to understanding how business is done.
OV-6c: Event-Trace Description

Example: Passenger Identification OV-6c: Event-Trace Description
Each OV-6c view should have associated text that describes the scenario it is based on. The scenario in the passenger identification event/trace description is based on a passenger moving through the airport to catch a flight (Figure 15-10). This scenario is familiar to all who have experience with air travel and may need only a short description for such audiences. However, for readers who are not familiar with air travel or with U.S. airport practices, the scenario might require a much more detailed description. For example, the first step is for the passenger to check in with the airline desk agent and present baggage to be checked and carried on, identity documents, and booking information. In this case, the passenger is bound for a foreign destination and has the necessary documents. The check-in agent confirms the passenger’s identity, reviews the travel documents, and confirms the passenger’s destination. The passenger then receives his or her baggage tags and boarding pass and can proceed to the security screening area.

Figure 15-10 Passenger identification OV-6c: Event-Trace Description
Like its counterparts in behavioral modeling, such as the OV-6a and OV-6b, the OV-6c: Event-Trace Description model is very useful in elaborating specific scenarios and tracing the behavior of an operational situation.
Sometimes, with a few changes, one type of model can be transformed into another. For example, if we were to turn the OV-6c on its side, it looks like a swim lane diagram—the lifelines in the OV-6c are transformed into swim lane roles; but the swim lane diagram misses the timing and event sequence that characterizes the OV-6c, which is a specific scenario or sequence of events, while the swim lane diagram is usually generic activities. The OV-3 also contains information that can be used to construct the OV-5b in a swim lane fashion or the OV-6c as a sequence diagram or event-trace style model. This requires that the OV-3 contain triggering events that start, or trigger, the resource flow represented by a row of the OV-3: Operational Resource Flow Matrix.
The advantage of an integrated architecture is that all models consistently model the same baseline or planned reality. The importance of integrating your models can never be understated. As we have learned, using the AV-2: Integrated Dictionary to hold our evolving architecture models guarantees that we can reconcile conflicts in architecture elements across models and modeling efforts.
TOGAF Support for the Operational Viewpoint
The business architecture (developed in Phase B of the ADM) in TOGAF represents the Operational Viewpoint. TOGAF recommends the construction of various types of models to represent various facets of the business architecture using a rich set of model types:
• Organization/actor catalog Lists all participants that interact with IT, including users and owners of IT systems.
• Driver/goal/objective catalog References cross-organizationally how an organization meets its drivers in practical terms through goals, objectives, and (optionally) measures.
• Role catalog Provides a listing of all authorization levels or zones within an enterprise. Frequently, application security or behavior is defined against locally understood concepts of authorization that create complex and unexpected consequences when combined on the user desktop.
• Business service/function catalog Provides decomposition in a form that can be filtered, reported on, and queried, as a supplement to graphical functional decomposition diagrams. The CV-2: Capability Taxonomy is an equivalent view in the DoDAF.
• Location catalog Lists all locations where an enterprise carries out business operations or houses architecturally relevant assets, such as data centers or end-user computing equipment.
• Process/event/control/product catalog Provides a hierarchy of processes, events that trigger processes, outputs from processes, and controls applied to the execution of processes. This catalog provides a supplement to any process flow diagrams that are created and enables an enterprise to filter, report, and query across organizations and processes to identify scope, commonality, or impact. The collection of OV-3: Operational Resource Flow Matrices across the set of processes will yield a similar collection of inputs, outputs, activities, and events.
• Contract/measure catalog Lists all agreed service contracts and (optionally) the measures attached to those contracts. It forms the master list of service levels agreed to across the enterprise. The SvcV-7: Services Measures Matrix is an equivalent to this artifact.
• Business interaction matrix Depicts the relationship interactions between organizations and business functions across the enterprise. The CV-5: Capability to Organizational Development Mapping provides the relationship between a capability and a developing organization.
• Actor/role matrix Shows which actors perform which roles, supporting definition of security and skills requirements.
• Business footprint diagram Describes the links between business goals, organizational units, and business functions and services, and maps these functions to the technical components delivering the required capability. This artifact is similar to the OV-1: High-Level Operational Concept Graphic.
• Business service/information diagram Shows the information needed to support one or more business services. Shows what data is consumed by or produced by a business service and may also show the source of information. This artifact is more appropriately represented in the DoDAF Services Viewpoint views.
• Functional decomposition diagram Shows on a single page the capabilities of an organization that are relevant to the consideration of an architecture. By examining the capabilities of an organization from a functional perspective, we can quickly develop models of what the organization does without being dragged into extended debate on how the organization does it. The equivalent view in the DoDAF is the CV-2: Capability Taxonomy.
• Product life cycle diagram Assists in understanding the life cycles of key entities within the enterprise. Understanding product life cycles is becoming increasingly important with respect to environmental concerns, legislation, and regulation where products must be tracked from manufacture to disposal. The life cycle of a System or Service is depicted in the SV-8/SvcV-8: Systems/Services Evolution Description views.
• Goal/objective/service diagram Defines the ways in which a service contributes to the achievement of a business vision or strategy. Services are associated with the drivers, goals, objectives, and measures that they support, enabling the enterprise to understand which services contribute to similar aspects of business performance. This artifact is equivalent to a combination of the DoDAF CV-1: Vision and CV-7: Capability to Services Mapping views, which enable a trace of services back to the capability and the vision for which they implement as a solution.
• Business use-case diagram Displays the relationships between consumers and providers of business services. Business services are consumed by actors or other business services and the business use-case diagram provides added richness in describing business capability by illustrating how and when that capability is used. This artifact is more appropriately reflected in the Services Viewpoint.
• Organization decomposition diagram Depicts organizational relationships and whole-part composition relationships between organizations, boards, councils, committees, and working groups. This artifact is identical to the OV-4: Organizational Relationships Chart.
• Process flow diagram Depicts the flow of data and control between the activities that participate in a business process. It shows sequential flow of control between activities and may use swim-lane techniques to represent ownership and realization of process steps. In addition to showing a sequence of activity, process flows can also be used to detail the controls that apply to a process, the events that trigger or result from completion of a process, and the products that are generated from process execution. This artifact is equivalent to the OV-5a: Operational Activity Decomposition Tree and OV-5b: Operational Activity Model views in the DoDAF.
• Event diagram Traces the sequence of events, the occurrence of activities, the mapping of performers to activities, and the messages and interactions between the performers in the context of the performed activity. This artifact is very similar to the OV-6c: Event-Trace Description.
FEAF2 Support for Operational Viewpoint
The FEAF2 business subarchitecture domain corresponds to the DoDAF Operational Viewpoint. The artifacts of this domain that are counterparts to the Operational Viewpoint views are listed here:
• Business process diagram (B-1) Presents the hierarchical structure of organizational activities and activities performed by organizational performers to consume and produce resources. This artifact corresponds to the OV-5a and OV-5b (activity models) in the DoDAF.
• Business operating plan (B-2) A plan that shows on a timeline, changes to the business service catalog, organizational chart, and business process model to transition from the current state of the enterprise to the target or objective state.
• Business service catalog (B-3) Presents the business services taken from the business reference model (BRM) that are provided within the scope of the architecture and may also indicate business services that are consumed or used internally within the architecture. Business services are discussed as part of the Services Viewpoint in Chapter 17.
• Organization chart (B-4) Presents the composition and relationships among organizational performers. This artifact corresponds to the OV-4: Organizational Relationships Chart in the DoDAF.
• Use-case narrative and diagram (B-5) Describes a set of possible sequences of interactions between systems and users in a particular environment and related to a particular goal.
• Business case/alternatives analysis (B-6) Summarizes the planning, budgeting, acquisition, and management of federal capital assets sufficient to determine if investment funding should be recommended or continued.
Summary
The Operational Viewpoint represents views that incorporate the elements of tasks and activities, operational performers, and resource flows between activities. The Operational Viewpoint uses a combination of formal models (e.g., OV-5b: Operational Activity Model), tables/matrices of detailed information (e.g., OV-3: Operational Resource Flow Matrix), and structured narratives (OV-6a: Operational Rules Model) to represent different views for different types of planners. An integrated architecture ensures that the specific architecture element in each view is consistent with the same element in other views. The purpose of the operational architecture is to present an integrated set of plans that consider all aspects of the operation and ensure that they dovetail and work effectively together. At the enterprise level, the Operational Viewpoint may simply consist of high-level business functions that collectively run the enterprise. At a mission, scenario, or class of mission level, the elements are restricted to those that are relevant to the architecture scope.
Questions
1. How is the Operational Viewpoint different from the Capability (strategic) Viewpoint? Who are the stakeholders for each of these?
2. The DoDAF views the Operational Viewpoint from the perspective of military operations. Compare and contrast this perspective against the needs of federal agencies and commercial enterprises for business processes.
3. In systems engineering, there is a renewed interest in the use of repeatable patterns to shorten the design cycle. Are there operational patterns that are reusable also? Discuss operational patterns in the context of a reusing enterprise such as a fast-food franchise.
4. Can you identify reusable operational patterns (a collection of activity types, role types, location types, resource types, and so on, that form a logical unit of mission or operation) in your own enterprise?
5. What is the purpose of the OV-1: High-Level Operational Concept Graphic? Is the OV-1 a model or a picture using our earlier definitions elsewhere in this book? Why?
6. What are the pros and cons of using a highly tailored OV-1 for a specific audience? Are there communication risks in doing so?
7. What are some of the techniques you would use in your OV-1s for involving architecture stakeholders in your enterprise?
8. How would you indicate the difference between internal and external performers in your OV-2: Operational Resource Flow Description? What other operational model will provide validation of the ability to satisfy a need line relationship? Hint: Reporting relationships or formal rules of engagement need to be established.
9. What is the relationship between the OV-2: Operational Resource Flow Description and the OV-3: Operational Resource Flow Matrix?
10. To comply with Privacy Act requirements for protecting personal information, what attributes would you add to the OV-3 to indicate that certain resource flows will need appropriate handling for compliance? For determining the need for protecting classified information in some of the resource exchanges in the OV-3, how would you tailor the OV-3 with additional columns?
11. What types of organizational relationships are represented in the OV-4? Is the OV-4 restricted to the formal organization chart of an enterprise? If not, why not?
12. Does the OV-4 represent only permanent organizations such as business units, departments, and divisions, or does it also represent temporary working groups, task forces, and councils comprising people staffed from permanent organizations for a specific charter or purpose?
13. What is the OV-5a? Why do you think there are two types of models, OV-5a and OV-5b, for representing configurations of operational activities? When is each type of model useful?
14. What is a swim lane activity model? What advantages are provided by a swim lane model over an IDEF0 representation? What disadvantages?
15. What is the OV-6a: Operational Rules Model? Why is it useful in architecting? How (through what mechanisms) are rules implemented in enterprises?
16. How would you organize the many rules in your enterprise?
17. What is the OV-6b: State Transition Description model? How are the states of a process or an object represented within an information system?
18. Discuss the applicability of state models to business needs such as providing in-process visibility (IPV).
19. Discuss and build a state model for the states of a package during its transmission from a web retailer to your home using a popular package express carrier.
20. Compare and contrast the TOGAF artifact types against the DoDAF views described in this chapter.
21. Compare and contrast the FEAF2 artifact types against the DoDAF views described in this chapter.
22. How would you analyze the relationships between subordinate activities within a business process? What artifact/view would you use?
References
Appleton, Daniel. 1993. Corporate Information Management: Process Improvement Methodology for DoD Functional Managers, 2nd Edition. Boston: D. Appleton & Company.
CIO Council. 2013. “Federal Enterprise Architecture Framework, Version 2.” https://obamawhitehouse.archives.gov/sites/default/files/omb/assets/egov_docs/fea_v2.pdf.
Department of Defense. 2010. DoD Architecture Framework Version 2.02. http://dodcio.defense.gov/Library/DoD-Architecture-Framework/.
Fowler, Martin, and Kendall Scott. 1997. UML Distilled: Applying the Standard Object Modeling Language. Boston: Addison-Wesley.
Hill, Steven C., and Lee A. Robinson. 1994. A Concise Guide to the IDEF0 Technique: A Practical Technique for Business Process Reengineering. Enterprise Technology Concepts Press.
National Institute of Standards and Technology (NIST). 1993. Draft Federal Information Processing Standards, Publication 183: “Announcing the Standard for Integration Definition for Function Modeling (IDEF0).” www.idef.com/wp-content/uploads/2016/02/idef0.pdf.
National Institute of Standards and Technology (NIST). 1993. Federal Information Processing Standards, Publication 184: “Announcing the Standard for Integration Definition for Information Modeling (IDEF1X).” www.niatec.iri.isu.edu/GetFile.aspx?pid=59.
Object Management Group. 2018. Business Process Modeling Notation (BPMN). www.bpmn.org.
Object Management Group. 2018. Organization home page. www.omg.org.
Ring, Steven J., Dr. Bruce Lamar, Jacob Heim, and Elaine Goyette. 2005. “Integrated Architecture-Based Portfolio Investment Strategies.” Paper presented at 10th International Command and Control Research and Technology Symposium: The Future of C2. www.mitre.org/sites/default/files/pdf/05_0571.pdf.
Ross, Ronald G. 2003. Principles of the Business Rule Approach. Boston: Addison-Wesley Information Technology Series.
Sharp, Alec, and Patrick McDermott. 2001. Workflow Modeling: Tools for Process Improvement and Application Development. Norwood, MA: Artech House.
The Open Group. 2018. “TOGAF Standard Version 9.2.” The Netherlands: Van Haren Publishing.