
CHAPTER 16
Systems Viewpoint
The Systems Viewpoint serves the interests of people involved with the planning, design, implementation, deployment, and maintenance of automated systems. Automated information systems are a subset of automated systems in general. The DoDAF generalizes information as a resource, and the Systems Viewpoint is therefore applicable to all systems, resource processing, and human and automated performers in the general case. Earlier versions of the DoDAF were restricted to information processing systems that were directed toward supporting C4ISR (Command, Control, Computers, Communications, Intelligence, Surveillance and Reconnaissance). The Systems Viewpoint can embrace a single system and its context, a Family of Systems (FoS), or a System of Systems (SoS).
Systems engineering of complex systems requires architecture models that can deal with the complexity. A complex system can be characterized (albeit circularly!) as one whose development and maintenance is complex, one whose behavior is complex, or usually both.
Often, the term “enterprise-wide” is used to characterize a complex system. This term can signify a global business enterprise as well as collections of systems that interact across their individual boundaries to achieve some common goal.
Some salient features of complex systems, as described within MITRE and in the literature, include the following:
• Complex systems are usually enterprise-wide systems that are constructed by the integration of multiple separate systems.
• Participants using these systems must merge their individual goals and behaviors to meet the goals of the enterprise to which they belong.
• Many participants have existing systems, cultures, or practices in place that are in conflict with those of other participants and are not easy to change.
• The requirements for the system are not precisely known at the start and dynamically change with time.
• Interaction among the system’s components and with its environment can produce behavior that is not always predictable or explainable from observing the behavior.
The views presented in the Systems Viewpoint other than the SV-10a, 10b, and 10c are static views of systems. The SV-10a, 10b, and 10c provide modeling techniques for the behavior of the system.
With the recent interest in and promises of cloud computing and service-oriented solutions, there is belief that all systems architecting will be replaced with service-based modeling methods and that the need for a Systems Viewpoint will be shortly and quickly replaced by a Services Viewpoint. But the preponderance of systems in today’s solution environment will guarantee that the Systems Viewpoint is here to stay for a long time to come, and attempts at migration of current infrastructures to new target architecture will require representation of legacy systems mixed in with services and the need for modeling the encapsulation of legacy functions into services.
Purposes of the Systems Viewpoint Views
The Systems Viewpoint enables analysis of systems from many aspects. Each of the SV views has a different purpose for the system analyst. Some of these aspects follow.
System Resource Flows/Information Exchanges
The counterpart to the Operational Viewpoint view OV-2: Operational Resource Flow Description is the Systems Viewpoint view SV-1: Systems Interface Description. The SV-1 replaces the operational performers, locations in the OV-2 with systems performers and systems hosting locations and replaces the operational need lines that indicated needs for exchange of information/flow of resources with interfaces that also indicate a need to exchange information/resources between systems performers. If every operational performer were to be supported by a single system, the layout of the SV-1 would perfectly match the layout of the OV-2. But in reality, multiple systems support a single performer, and non-automated activities in the operational realm do not have a system counterpart in the systems realm. The SV-3: Systems-Systems Matrix is a compact view that represents some aspect of interaction between pairs of systems. The SV-3 may also be used as a compact view for representing the many interfaces in a large and complex SV-1. Other systems resource flow models such as the SV-6: Systems Resource Flow Matrix focus on the details of the information exchanges/resource flows between specific systems in the context of specific system functions being performed by the systems.
Systems Functionality
Just as the operational activity was the prime ingredient for changing operational behavior, the system function is the prime ingredient that describes system behavior. The SV-4: Systems Functionality Description models the system functions that have been implemented or are planned for a system as a well-ordered taxonomy.
• The SV-4 can be used to decompose system functions progressively into smaller units of functionality. Decomposition is a technique to address system complexity by breaking down the system into components that are easier to analyze.
• The SV-4 is useful to compare systems functions across multiple systems, looking for duplication and overlaps. Military organizations have tried to standardize the list of system functions to enable consolidation of systems for joint operations or for savings from reuse of existing systems across multiple organizations.
• The SV-4 also models the input/output behavior of system functions in terms of the information/resources they consume, transform, or produce. The system resources comprise data/information and materiel resources. The resource flow diagram is a generalization of the classic data flow diagram, where the data flows are generalized to reflect any form of resource exchange.
• The SV-4 can be used to examine the orchestration of information exchanges/resource flows between multiple systems. The resource flow diagram can describe an orderly flow of information in an architectural scenario from system function to system function prior to the allocation of system functions to systems.
Systems Need for Connectivity
The interfaces that demonstrate the need for information exchange/resource flows between systems inside the SV-1 need to be implemented physically using communication paths that connect the systems together and provide a means for transmitting and receiving information/resources. In the IT sense, these are represented by paths through communication links, communication equipment, and computer networks. In the more general sense, these represent logistic chains that channel resources between systems such as concourses in airports, baggage conveyor belts, and so on.
The SV-2: Systems Resource Flow Description models the physical paths that are travelled by information/resources between systems. Because the physical path may have several intermediate links that are purely to route communications and resource transfer, the SV-1 may not have an exact correspondence with the SV-2, even though the end points for the path must coincide. The SV-2 is a depiction of the physical transfer path for information/resources that is depicted in the interfaces in the SV-1.
In the past, connectivity was achieved only through physical media connections by wire and fiber-optics. Today, physical connectivity can be achieved by wireless and broadcast means such as Wi-Fi and Bluetooth technologies, and connections can be achieved through software rather than through hardware with the network topology being established by software commands. All of these communication means contribute communication elements for an SV-2 diagram to indicate how the data interfaces in the SV-1 and the data exchanges between systems in the SV-6: Systems Resource Flow Matrix are accomplished through physical transfer of digital information.
Systems Traceability to Operational Usefulness
Too often, systems are built with many features that were required at the time by business or military operations. As time goes on, some of these features may not be very useful as changes in the operating environment or technology occur, or they may represent obsolete functions. Systems may also be built with architected capabilities and resulting functionality that was planned but never used. These functions impose a maintenance burden that may be unnecessary. They may also create unknown vulnerabilities that are never exposed when the functions are never used except by bad actors.
The SV-5a: Operational Activity to Systems Function Traceability Matrix and SV-5b: Operational Activity to Systems Traceability Matrix map systems and system functions to the operational activities they support. This is a useful view for analyzing the impact of change of either the operational activity or the system function on each other. For future planned systems, it also provides an explicit plan of which operational activities will be enabled/facilitated or automated by a system function. For a system, the SV-5 views also provide a coverage map of usefulness of system function to operational activity. In an IDEF0-style activity model, the relationship between the system and the activity it enables is reflected in the activity-mechanism relationship, as the system is represented as a mechanism for an activity.
Systems Performance Specification
Another useful view, the SV-7: Systems Measures Matrix, is used to specify the acceptable performance measures for a system or the specifications that drive the acquisition of systems. The specification of performance measures early in a system specification enables the creation of tradeoffs during the design process and also establishes minimum acceptance criteria for various components as well as the system itself. The SV-7 uses system parameters that are represented in some form of measure type taxonomy. Developing a standard taxonomy of measures enables comparisons of performance (benchmarking) between competing or alternate systems for similar measures.
Systems Evolution
For planners, one of the important models to build is a roadmap of systems evolution. The SV-8: Systems Evolution Description view offers the representation in two formats—evolution of features and functions for systems in planned release increments, and migration of multiple systems into one or more target systems. The SV-8 is a useful view for planning modernization initiatives as well as for allocating feature evolution to system increments. The time frames for the SV-8 must be consistent with the time frames described in the AV-1: Overview and Summary Information.
Systems Operating Platforms
No system runs by itself without the need for underlying system software such as operating system support, support from commercial-off-the-shelf (COTS) software such as electronic mail, document creation and rendering, and so on. For technology infrastructure staff, it is important to map systems to the operating platforms that they need to run on and to lay out roadmaps of their evolution based on available vendor information.
The SV-9: Systems Technology and Skills Forecast view provides the capability of expressing a platform migration strategy for specific systems. A portfolio of SV-9 views can then be used at the enterprise level to determine mismatches in migration strategy or missed migrations, for example. As adoption of cloud computing increases, many of the operating platforms are provisioned in the cloud, and platform vendors provide a roadmap of how their cloud platform offerings will evolve. Planning the SV-9 must be done in coordination with such roadmaps, as availability is restricted to those offerings if the same cloud provider is to be selected. Alternatively, a cloud platform vendor with limited offerings and no roadmap may not be the best provider of platform services for applications that must stay up to date with vendor’s latest patches, updates, and releases to avoid vulnerabilities.
The SV-9 also provides a format for representing the needs for skills as operating platforms are added/modified to support the enterprise’s systems. Military organizations have a standardized skills taxonomy that spells out the training, certification, and validation and classifications for skill credentials.
Systems Behavioral Models
For detailed modeling of systems behavior, the SV-10a: System Rules Model, the SV-10b: Systems State Transition Description, and the SV-10c: Systems Event-Trace Description are available as counterparts of the OV-6a, OV-6b, and OV-6c operational behavioral models (see Chapter 15). These are useful for providing detailed representation of orchestration sequences of system functions, information/resource exchanges, and triggering events (SV-10c: Systems Event-Trace Description) or detailed representation of algorithmic behavior used to implement system functions, or for establishing structural constraints among data in a systems database (SV-10a), or establishing detailed representation of the state transitions of a system or system function in the face of triggering events and activities.
Systems Viewpoint Integrated Views
For brevity, a partial subset of the Systems Viewpoint is shown in Figure 16-1 to illustrate the concepts of integrated views in the context of the Systems Viewpoint (missing are the SV-9, SV-10a, SV-10b, and SV-10c).
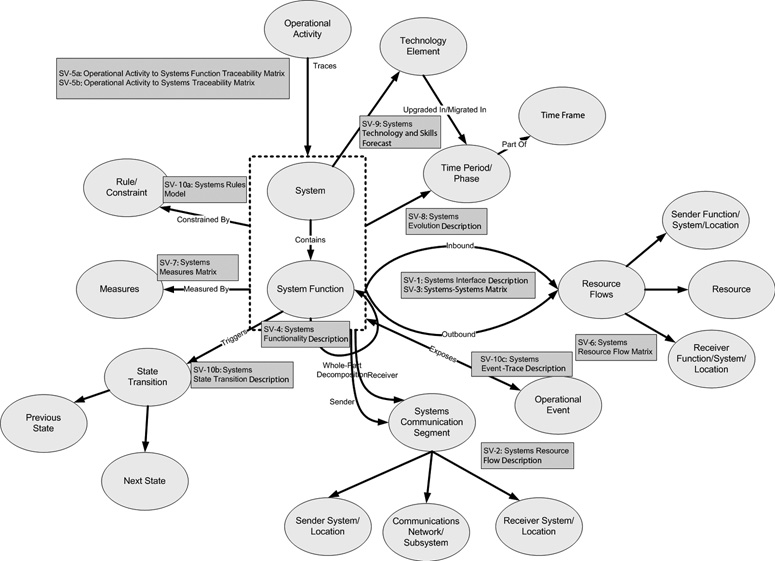
Figure 16-1 Integrated view set for Systems Viewpoint
The Systems Viewpoint also represents a tight coupling of views for consistency purposes. Views share many common elements such as systems, systems functions, system locations, and data flows.
Some examples of the needs for consistent use of architecture elements between Systems Viewpoint views are given here:
• SV-1 systems must be consistent with systems in all the systems views. SV-1 interfaces must be consistent with SV-4 data-flows and SV-6 data exchanges between the same end-point systems.
• SV-4 system functions must be consistent with SV-5 system functions.
In addition to the integration needs of models within the Systems Viewpoint, there are integration needs implicit inside the models to other viewpoints:
• SV-5 maps the systems functions and systems to operational activities defined inside the Operational Viewpoint. SV-5b maps the systems to operational activities (systems to operations alignment).
• SV-9 must be consistent in the evolution of system technology to the elements defined in the StdV-1: Standards Profile and the StdV-2: Standards Forecast (systems to technology alignment).
SV-1: Systems Interface Description

Example: Passenger Identification SV-1
The SV-1 is the systems counterpart of the OV-2: Operational Resource Flow Description. The human and organizational performers who represent the end points of the need lines in the OV-2 are replaced by systems representing their automation counterparts in the SV-1 as shown in Figure 16-2. The need lines of the OV-2 are transformed into the interfaces between the systems of the SV-1.

Figure 16-2 Passenger identification in the SV-1: Systems Interface Description
In the general case, if every operational performer had one and only one system representing it, and every need line had one and only one systems interface counterpart, the SV-1 would be topologically the same as the OV-2. But in reality, many human and organizational activities may or may not have automated counterparts, and there may be systems whose only purpose is to relay the interface and do not play a vital part in the operations. In the example we presented, the OV-2 and SV-1 are very similar.
SV-2: Systems Resource Flow Description
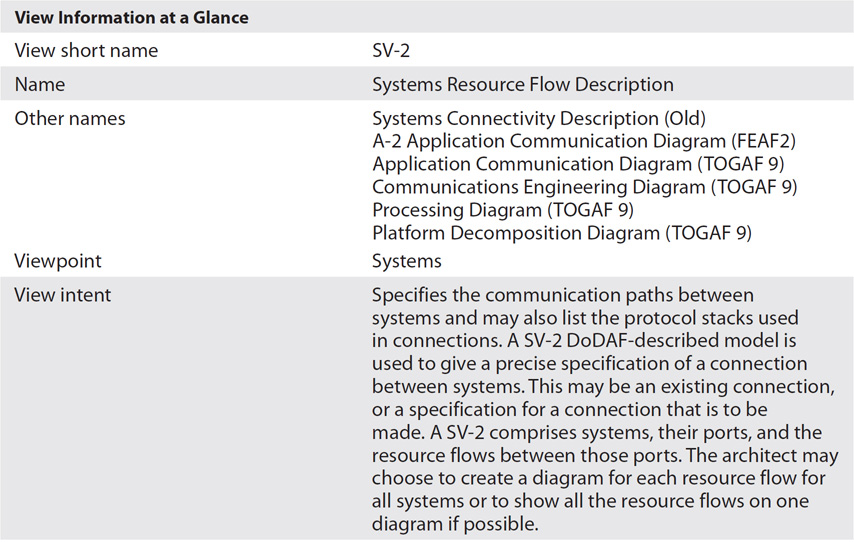

Example: Passenger Identification SV-2
The SV-2 represents the physical connectivity and actual resource flow (communication) paths that achieve the interfacing represented inside the SV-1. The SV-2 provides a graphical view of these paths and enables the analyst to annotate communication and transmission standards and protocols, bandwidth, and capacity constraints and readily determine issues such as bottlenecks and capacity constraints or mismatched protocols, for example. The SV-2 (Figure 16-3) represents physical communication links and elements needed to support the requirement for exchange of resources depicted in the SV-1.

Figure 16-3 Passenger identification SV-2: Systems Resource Flow Description
SV-3: Systems-Systems Matrix


Example: Passenger Identification SV-3
The SV-3 in a matrix format summarizes all the interfaces across all the systems within the scope of the architecture and provides a compact "at a glance" view of interfaces, along with codes in the intersection cells that provide additional information about the interfaces, as shown in Table 16-1. The SV-3 can be tailored to provide a range of codes that may depict interface development status or other attributes of the interface.


Table 16-1 Passenger Identification SV-3: Systems-Systems Matrix
SV-4: Systems Functionality Description


Example: Passenger Identification SV-4
Table 16-2 shows a hierarchy of system functions for a hypothetical information broker system that integrates airline, hospitality, and airport data for passengers. The example table also contains descriptions of the system functions from the AV-2. The SV-4 also allows for a data/resource flow representation that depicts the output of a system function shown as an input of another system. This view represents inputs from human resource/data sources (external resource providers) as well as outputs that go into a storage mechanism for resources/information (sinks). The dataflow version of the SV-4 is not shown here.
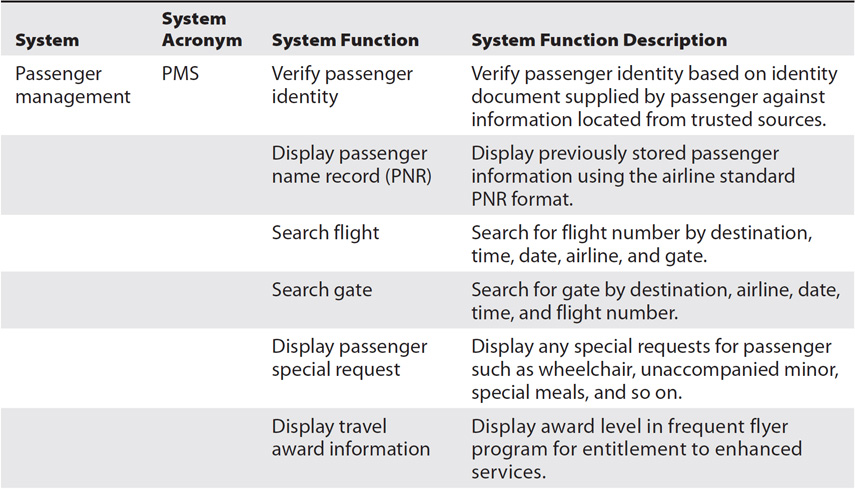

Table 16-2 Passenger Management System SV-4: Systems Functionality Description
SV-5a: Operational Activity to Systems Function Traceability Matrix
SV-5b: Operational Activity to Systems Traceability Matrix


Example: Passenger Identification SV-5a
Table 16-3 shows the relationships between systems and operational activities. This correspondence is very useful to determine which system functions are useful for which operational activities and which system functions are not useful in a specific operational context. The SV-5a provides a valuable model for portfolio analysis of system functions across the spectrum of operational activities.

Table 16-3 Passenger Identification SV-5a: Operational Activity to Systems Function Traceability Matrix
Example: Passenger Identification SV-5b
The SV-5b provides a more detailed view of the relationships between systems and operational activities and provides the mapping between specific system functions and operational activities, as shown in Table 16-4. This extends the usefulness of the SV-5a to provide more fine-grained analysis of system function redundancy and system function applicability to the operational context.

Table 16-4 Passenger Identification SV-5b: Operational Activity to System Traceability Matrix (Extract)
SV-6: Systems Resource Flow Matrix


Example: Passenger Identification SV-6
Table 16-5 depicts the flow of resources between systems (and optional locations). The resource type exchanged in the example is data. The system function being performed and attributes of the resource exchange may also be recorded. This example presents data standards that govern the data being exchanged as well as a format and a size for communications personnel to use in assessing the burden on the communications network.

Table 16-5 Passenger Identification SV-6: Systems Resource Flow Matrix
SV-7: Systems Measures Matrix

Example: Passenger Identification SV-7
Table 16-6 shows an SV-7 performance measure specification for some system functions that are in scope for the passenger identification solution architecture.


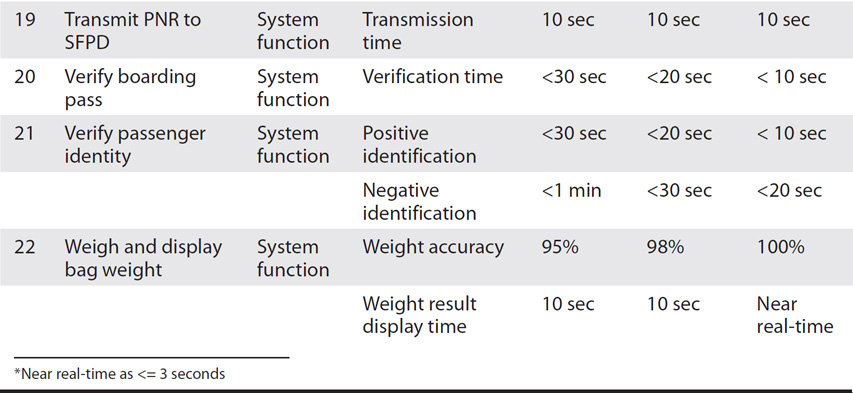
Table 16-6 Passenger Identification SV-7: Systems Measures Matrix
SV-8: Systems Evolution Description


Example: Passenger Identification SV-8
The SV-8 is generally drawn as a graphic. Table 16-7 shows a tabular rendering of the evolution of the various systems in terms of functions that will be added in system increments over a period of time. (We use “Current Year” for this example. The view should contain the specific years for which the evolution is planned.)


Table 16-7 Passenger Identification SV-8: Systems Evolution Description
SV-9: Systems Technology and Skills Forecast

Example: Passenger Identification SV-9
Table 16-8 shows the planned technology upgrades and migrations for various systems over a planning time frame. Note that the SV-9 shows actual upgrades of technology instances (vendor products) rather than planned adherence to technical standards such as compliance to FIPS 127 SQL Standard. The StdV-1 focuses more on technical profiles (service areas, services and standards) while the SV-9 is focused more on a planned migration of specific technologies. This example does not include comments on skill upgrade needs.


Table 16-8 Passenger Identification SV-9: Systems Technology and Skills Forecast
SV-10a: Systems Rules Model


The SV-10a: Systems Rules Model is similar to the OV-6a: Operational Rules Model in that it describes the rules that constrain systems or system functions. These rules are embedded inside the logic of the system function, or they may also represent constraints that govern the operator interface and permission sets:
• Structure assertion rules Embedded inside the database as constraints. For example, a rule may be “A passenger is a person who has a boarding pass” to distinguish people who have simply made a booking from those that are actually travelling.
• Action assertion rules Generally in the form “If (A is true) then (B is true) else (C is true)”; these rules provide criteria for use in decision points of the processing logic of system functions.
• Derivation rules Provide algorithms to compute, at run time, needed values from other available data. These rules are embedded into the processing logic.
Here are some more examples of unstructured systems rules that constrain system behavior:
• All systems performing passenger identification shall be able to read machine-readable passports complying with ICAO Document 9303 (endorsed by the International Organization for Standardization and the International Electrotechnical Commission as ISO/IEC 7501-1). If a system encounters a nonmachine-readable passport, it shall notify the system operator with an error message indicating failure to read nonmachine-readable passport.
• All systems shall maintain an access control table that maps the roles of users to permissible system functions.
• The system shall authenticate the user first and the role second before attempting to match permissions to requested system functions. No information about system functions shall be provided to end users.
• Though the system user can potentially assume one of many roles, at any point in the use of a system, a system user shall enter and remain in the system using one and only one selected role.
SV-10b: Systems State Transition Model

The SV-10b: Systems State Transition Description is similar to the OV-6b: State Transition Description. In its simplest form it describes the change in state of a system due to system functions or system/external events. The objective of state transition diagrams is to observe the behavior of a system in terms of desired and undesired states, detect undesirable possible cycling between states, and ensure that the states are bounded and well understood when the system is deployed.
SV-10c: Systems Event-Trace Description

The SV-10c: Systems Event-Trace Description is similar to the OV-6c: Event-Trace Description in that it models the sequence of resource exchanges between system functions in a scenario or contained situation. It also depicts the exchange of resources in the context of timing so that the architect can observe and determine timing-related issues. The SV-10c is very useful in examining a detailed scenario in terms of sender systems and receiver systems, the functions they are performing at the time of the resource exchange, the type of information/resource that forms the subject of the interaction, and timing information associated with the exchange. The SV-10c complements the SV-6: Systems Resource Flow Matrix by laying out the data exchanges on a timeline and representing the exact sequence with which the resources are sent and received. Though we have discussed the SV-10c as a view for representing data exchange, it can also be generalized to represent the exchange of any type of resource such as funds, people, and materiel.
TOGAF Information Systems Architecture
Though many of the artifacts that support the data architecture are data-oriented rather than system-oriented, the following artifacts represent aspects of the Systems Viewpoint that depict the relationship between systems and data entities:
• Application/data matrix The application/data matrix depicts the relationship between the applications and the data entities that are accessed and updated by them. The entry in the intersection cells contain one or more of the following codes: (C) If the application creates instances of the data entity; (R) if it references/reads instances of the data entity; (U) if the application updates properties of instances of the data entity; and (D) if the application can delete instances of the data entity. This artifact is sometimes commonly known as a CRUD Matrix. The CRUD Matrix is akin to a summary matrix compiled from several SV-4 data flow diagrams from the DoDAF and is useful to summarize and concentrate the information from the several diagrams into a matrix that provides an overview of all data interactions by all applications in a compact format.
• Data dissemination diagram The data dissemination diagram shows the relationship between data entity, business service, and application components. At the center of the diagram is a business service connected with arrows to the applications that provide data or consume data in the context of the business service along with specific data entities that are referenced by the business service. There is no equivalent view in the DoDAF.
The TOGAF (within the applications architecture corresponding to the DoDAF Systems Viewpoint) recommends the development of the following artifacts:
• Application portfolio catalog The application portfolio catalog takes inventory of all the applications used throughout the enterprise. The catalog serves as a tool to assess the impacts of any changes on the applications and to anticipate unintended consequences that may result from lack of that knowledge. The catalog contains “logical” application components that may actually comprise multiple applications in realization, “physical” or individual specific application components, as well as information services that supply information in response to requests. There is no equivalent in the DoDAF Systems Viewpoint as an architecture view, but in the DoD, the central application portfolio catalog is the Defense IT Portfolio Registry (DITPR).
• Interface catalog The interface catalog is an inventory of all the interfaces between applications within the enterprise. Interfaces impose a dependency between applications. The interface catalog is akin to the universe of all the SV-1: Systems Interface Description views within the DoDAF all stored within a single repository. The interface catalog also contains descriptions of the interface in terms of the exchange protocols, throughput, information security requirements and classification levels, and other properties in addition to the end-point applications.
• Application/organization matrix This artifact depicts the relationship between applications and organizational units within the enterprise. The intersection cell is assigned an “X” if an application component is used by an organization or left blank if not. The matrix provides a summary of application usefulness by organization units. There is no equivalent view in the DoDAF. The matrix also provides a rapid gap analysis to determine organizations that need to be served by applications but are currently not being served. It also provides a quick view of the collection of application components used by a specific organization.
• Role/application matrix This matrix depicts the relationship between applications and the business roles that use them within the enterprise. The intersection cells within the matrix contain an “X” if an application component is used by a specific role or left blank if not. This is an important matrix to use in security planning and in determining what roles need what types of access to what applications. It can also be used for gap analysis when roles may need to be enabled to specific application components. Role usage may also drive the need to customize application interfaces to be convenient, efficient, and effective for those specific roles. There is no equivalent view in the DoDAF, though in the SV-10a: Systems Rules Model, assertions of which roles are enabled for which applications can be represented as authorization rules.
• Application/function matrix This matrix depicts the relationship between applications and business functions within the enterprise. The matrix establishes a direct correspondence between an application component and the business function that it supports. The matrix is a useful tool in performing gap analysis for business functions that may need additional application support, or the potential for redundancy of applications that support the same business function. The SV-5a: Operational Activity to Systems Function Traceability Matrix and SV-5b: Operational Activity to Systems Traceability Matrix serve the same purpose as this matrix.
• Application interaction matrix This matrix represents dependencies between two applications. This artifact is identical to the SV-3: Systems-Systems Matrix and serves a similar purpose in analyzing system dependencies.
• Application communication diagram This diagram depicts application components and interfaces between them. Communications are shown as logical arrows and depict intermediary technology only when it is architecturally relevant. Though similar in name to the DoDAF SV-2: Systems Resource Flow Description, the DoDAF view is concerned with networking components such as communication links, routers, firewalls, and hubs in addition to the application components. The application communication diagram may also be represented as follows:
• N2 model or node connectivity diagram This is similar to the SV-1: Systems Interface Description.
• Information exchange matrix This is similar to the DoDAF SV-6: Systems Resource Flow Matrix.
• Application and user location diagram This diagram depicts clearly the business locations from which business users typically interact with the applications, but also the hosting location of the application infrastructure. The usefulness of the diagram is in answering questions related to deployment of an application to multiple locations; set user types in terms of quantities, licensing, estimation of support needed; and to help plan the selection of system management tools and application management suites. There is no equivalent view in the DoDAF.
• Application use case diagram This diagram represents the interaction between a user role and the system and its functions that are exercised in a particular usage scenario. A use case diagram may depict multiple application components that are exercised within a scenario as well as multiple user roles that may participate in a specific use case scenario. There is no direct equivalent for this artifact in the DoDAF, although a hybrid OV-6c/SV-10c can be used in a similar way.
• Enterprise manageability diagram This artifact shows how one or more applications interact with the components that support operational management of a solution. The usefulness of this artifact is in determining disconnected and discordant system management components that can be consolidated or unified in capability to provide a more comprehensive and effective overall system management strategy. There is no equivalent DoDAF view for this artifact.
• Process/application realization diagram This diagram depicts the sequence of events when multiple applications are involved in executing a business process. The benefit of using this artifact is to gain insight into handoffs between applications, sequencing constraints, and the flows of data between application components all laid out in a timeline. The equivalent view within the DoDAF is the SV-10c: Systems Event-Trace Description.
• Software engineering diagram This artifact breaks applications down into packages, modules, services, and operations from a development perspective. It supports planning through decomposition of a complex objective into smaller, simpler objectives that can be scheduled and resourced in a systematic manner. It also acts as a management tool for complex development environments. The DoDAF does not have an equivalent view.
• Application migration diagram This artifact represents the migration of legacy and current applications to future applications that will replace them. This artifact is identical to the DoDAF SV-8: Systems Evolution Description and serves the same purpose.
• Software distribution diagram This optional diagram is a composite of the software engineering diagram and the application-user location diagram. There is no DoDAF equivalent view that corresponds to this diagram.
FEAF2 Applications Subarchitecture Domain
The Applications subarchitecture domain corresponds to the DoDAF Systems Viewpoint within the Common Approach/FEAF2 Framework, though the focus of the FEAF2 is primarily on government IT business systems, while the DoDAF is generalized to encompass embedded electronic systems, command and control systems, intelligence and reconnaissance systems in addition to war fighting and business support. The concerns that are addressed in the Application subarchitecture domain are similar to the ones that are addressed by the DoDAF systems views:
• Which systems and applications will be needed to generate, share, and store the data, information, and knowledge that the business services need?
• How can multiple types of IT systems, services, applications, databases, and web sites be made to work together where needed?
• How can configuration management help to create a cost effective and operationally efficient common operating environment (COE) for systems and applications?
• What are the workforce, standards, and security issues for applications and systems development and deployment?
The following artifacts are recommended in the FEAF2 to support the Application subarchitecture domain/Systems Viewpoint:
• Application Interface Diagram (A-1) (core requirement) The representation of application resource flows and their composition in terms of resource elements. This artifact is equivalent to the DoDAF SV-1: Systems Interface Description.
• Application Communication Diagram (A-2) The representation of the underlying communications means through which resource flows shown in the application interface diagram are implemented. This artifact is equivalent to the DoDAF SV-2: Systems Resource Flow Description.
• Application Interface Matrix (A-3) The interface relationships between systems represented as a matrix. This artifact is equivalent to the DoDAF SV-3: Systems-Systems Matrix.
• Application Data Exchange Matrix (A-4) This artifact represents the details of resource flows among systems: the business activities performed, the resources exchanged, and the attributes (rules and measures) associated with these exchanges. This artifact is equivalent to the DoDAF SV-6: Systems Resource Flow Matrix.
• Application Service Matrix (A-5) This table represents the relationship between systems and services. This artifact is equivalent to the SvcV-3a: Systems-Services Matrix and the SvcV-3b: Services-Services Matrix.
• Application Performance Matrix (A-6) This table of measures is associated with an application’s performance. These measures are used as specifications to plan or benchmark an application in terms of desirable properties such as availability and latency of user response to application response. This artifact is equivalent to the DoDAF SV-7: Systems Measures Matrix.
• System/Application Evolution Diagram (A-7) This timeline chart depicts planned incremental steps toward migrating a suite of systems/applications to a more efficient suite or toward evolving a current system or application to a future implementation. This artifact is equivalent to the DoDAF SV-8: Systems Evolution Description.
• Application Maintenance Procedure (A-9) This artifact describes how to modify software to provide error corrections, enhancements of capabilities, deletion of obsolete functionality, and optimization of behaviors and structures. There is no DoDAF equivalent to this artifact.
• Application Inventory (A-10) This is a registry of applications and services: the system functions or service activities they perform and, optionally, their prioritization ranking. There is no equivalent for this artifact within the DoDAF, but the TOGAF Application Portfolio Catalog is an exact equivalent.
• Software License Inventory (A-11) A list of COTS and open-source software assets with details about each (installation date, original cost, condition, and such).
Summary
The Systems Viewpoint serves the interests of people involved with the planning, design, implementation, deployment, and maintenance of automated systems. The concepts presented in this chapter apply equally to automated information processing systems as well as automated systems that process generalized resources. The set of architecture views that support the Systems Viewpoint range from simple interface diagrams that represent the need to exchange resources by lines between systems (SV-1) to more complex views that support the evolution of a system’s technology platforms (SV-9), migration and consolidation of systems (SV-8), model systems behaviors (SV-10a, SV-10b, SV-10c), specify a system’s functionality (SV-4), and develop performance specifications (SV-7).
Though today’s trend is to move away from monolithic systems and provide application functionality through a service-oriented architecture and infrastructure through cloud computing, the planning aspects from the systems viewpoint still remain—such as the challenge of orchestrating services, planning migration of services, understanding the relationship between services and some of the rules that are embedded within them to name a few!
Questions
1. What audience is served by the Systems Viewpoint?
2. Discuss how your enterprise would use the Systems Viewpoint views to move to a service-oriented architecture. Which are the Services Viewpoint counterparts for the Systems Viewpoint views? (See Chapter 17 for the Services Viewpoint views)
3. Which of the Data and Information Viewpoints is complementary to the Systems Viewpoint views? Why?
4. Distinguish between a system function and a service.
5. What is the SV-1: Systems Interface Description? Would you expect to find all the systems of the enterprise in your SV-1? Why or why not?
6. What is the SV-2: Systems Resource Flow Description? Would you expect to find items such as networks, routers, modems, and firewalls depicted inside the SV-1? Inside the SV-2?
7. What is the relationship between the SV-1 and the SV-2? What common architecture elements do they share?
8. What is the SV-3? How can your enterprise tailor an SV-3 to depict interfaces that are already implemented as well as planned interfaces?
9. What is the SV-4? The example in Table 16-2 shows a simple functional decomposition, but the SV-4 can also show data flows between system functions. How would you depict these data flows in a diagram? How would you accommodate operators typing data into a system or data flowing into a database? (Hint: See “Data Flow Diagrams,” DoDAF Volume II.)
10. How can the SV-5a and SV-5b be used to determine the composition of a systems portfolio? What are the risks in using the SV-5 to determine redundancy?
11. How can you tailor the SV-6 to include needs to capture data security classification, personal identification information, and throughput?
12. What are performance measures for systems functions that are commonly used in your enterprise? What other measures are applicable to other architecture elements?
13. The SV-8: Systems Evolution Description can be rendered in two ways: in a system evolution of an individual system in terms of evolution of features and functions over a time frame, or in a migration style diagram that shows which systems are merged or split to form a new systems portfolio. Discuss the applicability of these two styles of SV-8 to your own enterprise.
14. What are the elements of forecast for technology in an SV-9? Are they technical standards or are they specific vendor products? Why?
References
CIO Council. 2013. “Federal Enterprise Architecture Framework, Version 2.” https://obamawhitehouse.archives.gov/sites/default/files/omb/assets/egov_docs/fea_v2.pdf.
Department of Defense. 2009. DoD Architecture Framework Version 2.0. “Volume 1: Introduction, Overview, and Concepts.” http://dodcio.defense.gov/Portals/0/Documents/DODAF/DoDAF%20V2%20-%20Volume%201.pdf.
Department of Defense. 2009. DoD Architecture Framework Version 2.0. “Volume 2: Architectural Data and Models.” http://dodcio.defense.gov/Portals/0/Documents/DODAF/DoDAF_v2-02_web.pdf.
Federal Enterprise Architecture Program Management Office, OMB. 2007. “FEA Practice Guidance.” www.whitehouse.gov/sites/default/files/omb/assets/fea_docs/FEA_Practice_Guidance_Nov_2007.pdf.
Norman, Douglas O., and Michael L. Kuras. 2004. “Engineering Complex Systems.” The MITRE Corporation. www.mitre.org/publications/technical-papers/engineering-complex-systems.
Object Management Group. 2013. Unified Profile for DoDAF and MODAF Specification Version 2.1. www.omg.org/spec/UPDM/2.1/.
Object Management Group. 2018. “About the Unified Modeling Language Specification Version 2.5.1.” www.omg.org/spec/UML/About-UML/.
SysML.org. 2018. “SysML Open Source Specification Project: What Is SysML?” SysML.org at www.sysml.org/.
The Open Group. 2011. “Sample Catalogs, Matrices and Diagrams,” Version 3, TOGAF Enterprise Edition Version 9.2. Microsoft PowerPoint presentation. www.togaf.info/togaf9/togafSlides91/TOGAF-V91-Extra-Catalogs-Matrics-Diagrams-v3.pdf.
The Open Group. 2018. “TOGAF Version 9.2.” The Netherlands: Van Haren Publishing.