CHAPTER 14
Testing, Automation, and Changes
In this chapter, you will learn about
• Testing techniques
• Automation and orchestration
• Change and configuration management
One of the challenges of a cloud environment is service and maintenance availability. When organizations adopt a cloud model instead of hosting their own infrastructure, it is important for them to know that the services and data they need to access are available whenever and wherever they need them, without experiencing undue delays. Therefore, organizations need procedures for testing the cloud environment. Testing is a proactive measure to ensure consistent performance and operations of information systems.
Because maintenance tasks associated with on-premises technology are assumed by the cloud provider, operational and specific business rules need to be employed to best leverage the cloud technology to solve business problems. Standard maintenance tasks can take a significant amount of time, time that many companies just do not have. IT resources are typically stretched thin. This is where automation and orchestration step in. Automation and orchestration are two ways to reduce time spent on tasks, increase the speed of technological development, and improve efficiencies. Automation uses scripting, scheduled tasks, and automation tools to programmatically execute workflows that were formerly performed manually. Orchestration manages automation workflows to optimize efficiencies and ensure effective execution.
Improper documentation can make troubleshooting and auditing extremely difficult. Additionally, cloud systems can become extremely complex as they integrate with more systems, so a change in one place can affect systems across the enterprise if not managed correctly. Change and configuration management address these issues by tracking change requests, establishing a process for approval that considers the risks and impacts, and tracking the changes that are actually made.
Testing Techniques
Availability does not just mean whether services are up or down. Rather, availability is also concerned with whether services are operating at expected performance levels. Cloud consumers have many options, and it is relatively easy for them to switch to another model, so it is important for cloud providers to consistently provide the level of service users expect.
Ensuring consistent performance and operation requires vigilant testing of services such as cloud systems or servers, virtual appliances, virtual networking, bandwidth, and a host of more granular metrics. Together, this data can paint a picture of where constraints may lie and how performance changes when conditions change. In this section, you will learn about the following testing techniques:
• Baseline comparisons
• Performance testing
• Configuration testing
• Testing in the cloud landscape
• Validating proper functionality
• SLA comparisons
• Testing sizing changes
• Testing high availability
• Testing connectivity
• Verifying data integrity
• Evaluating replication
• Testing load balancing
Baseline Comparisons
A baseline can be compared with actual performance metrics at any point following the collection of the baseline to determine if activity represents the norm. The purpose of establishing a baseline is to create a sample of resources that are being consumed by the cloud services, servers, or VMs over a set period and to provide the organization with a point-in-time performance chart of its environment.
Establish a baseline by selecting a sampling interval and the objects to monitor and then collecting performance data during that interval. Continue to collect metrics at regular intervals to get a chart of how systems are consuming resources.
Cloud providers offer the ability for each cloud VM to send performance metrics to a central monitoring location in the cloud, such as with AWS CloudWatch. This also provides aggregated metrics for apps that consist of multiple VMs.
Procedures to Confirm Results
It is important to establish procedures to evaluate performance metrics in a baseline both in testing and production to confirm the accuracy of testing baselines. Load testing, stress testing, and simulated user behavior utilize workload patterns that are automated and standard, but these workloads may not be the same as actual user activity. Therefore, baseline comparisons from load testing, stress testing, or simulations could differ significantly from production baselines. Understand how baselines were obtained so that you do not use these baselines in the wrong context.
Decision-makers use baselines to determine initial and max resource allocations, gauge scalability, and establish an application or service cost basis, so baseline numbers need to be accurate. Evaluate metrics for critical resources, including CPU, memory, storage, and network utilization.
CPU Utilization CPU utilization may change as systems are moved from test to production and over time as overall utilization changes. Collect CPU metrics once systems have been moved to production and track the metrics according to system load so that numbers can be compared to testing baselines. The following list includes some of the metrics to monitor:
• CPU time Shows the amount of time a process or thread spends executing on a processor core. For multiple threads, the CPU time of the threads is additive. The application CPU time is the sum of the CPU time of all the threads that run the application. If an application runs multiple processes, a CPU time will be associated with each process, and these will need to be added together to get the full value.
• Wait time Shows the amount of time that a given thread waits to be processed.
Memory Utilization Memory utilization is also subject to changes in test versus production environments. Collect memory metrics once systems have been moved to production and track the metrics according to system load so that numbers can be compared to testing baselines. Some metrics to monitor include
• Paged pool Shows the amount of data that has been paged to disk. Paging from disk is performed when there is insufficient memory available, and it results in lower performance for each page fault.
• Page faults Shows the total number of times data was fetched from disk rather than memory since process launch. A high number of page faults could indicate that memory needs to be increased.
• Peak memory usage Shows the memory used by a process since it was launched.
Storage Utilization After evaluating CPU and memory performance compared to proposed resources, an organization must also test the performance of the storage system. Identifying how well the storage system is performing is critical in planning for growth and proper storage management. Collect storage utilization data in production. The performance metrics can be compared to baselines if load values can be associated with each metric for common comparison. Some metrics to monitor include
• Application read IOPS Shows how much storage read I/O was performed by the application process per second. Storage read I/O is when data is pulled from the disk for the application. If an application runs multiple processes, a read IOPS value will be associated with each process, and these values will need to be added together to get the full value.
• Application write IOPS Shows how much storage write I/O was performed by the application process per second. Storage write I/O is when the application saves data to disk. Similar to read IOPS, if an application runs multiple processes, a write IOPS value will be associated with each process.
• Read IOPS Shows how much storage read I/O was performed by the system per second.
• Write IOPS Shows how much storage write I/O was performed by the system per second.
Network Utilization The fourth item to consider is network utilization. This also can change from test to production and as systems mature. Collect network metrics once systems have been moved to production. You can use network collection tools or collect statistics from network devices or the VMs themselves. Sometimes it is useful to collect network metrics at different points and then compare the results according to system load so that numbers can be compared to testing baselines. Some metrics to monitor include
• Physical NIC average bytes sent/received Tracks the average amount of data in bytes that was sent and received over the physical network adapter per second.
• Physical NIC peak bytes sent/received Tracks the largest values for the average amount of data in bytes that were sent and received over the physical network adapter. Peak values can show whether the adapter is getting saturated.
• Virtual switch average bytes sent/received Tracks the average amount of data in bytes that were sent and received over the virtual switch per second. Track this for each virtual switch you want to monitor.
• Virtual switch peak bytes sent/received Tracks the largest values for the average amount of data in bytes that were sent and received by the virtual switch. Track this for each virtual switch you want to monitor. Peak values can show whether the virtual switch is getting saturated.
• Virtual NIC average bytes sent/received Tracks the average amount of data in bytes that were sent and received over the virtual NIC per second. Track this for each virtual NIC in the VMs you want to monitor.
Exercise 14-1: Collecting Windows Metrics with Performance Monitor
In this exercise, we will create counters to collect performance metrics on a Windows machine using the Performance Monitor tool.
1. Log in to a Windows computer or VM.
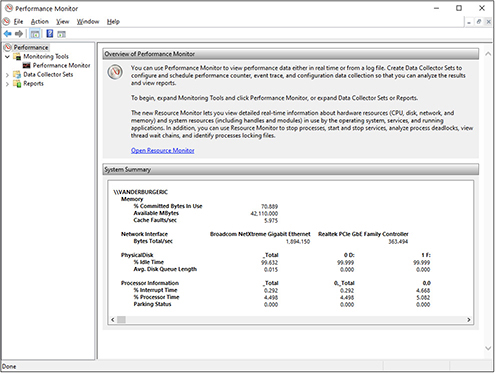
2. Start the Performance Monitor application. From Windows 10, click the search button or bar in the lower left and then type performance monitor. Select the Performance Monitor application.
3. The Performance Monitor application will load, as shown here.
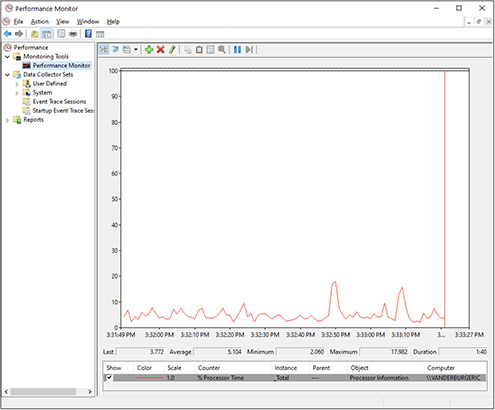
4. Select Performance Monitor on the left side of the application. This will display the chart with the current counters. It may have some counters already defined, or it could be blank. In this example, a single processor time counter has been set so you can see the chart of its activity.
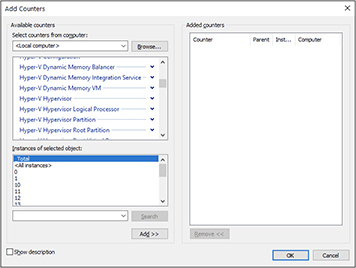
5. Click the plus sign icon to add more counters. Scroll through the list to see the available counters. Depending on the role the computer fills, you might have some additional counters. For example, the computer used for this example has Hyper-V on it, so a range of counters can be set for it, as shown here.
6. Expand Memory and then select Pages/Sec, then click the Add button.
7. Expand Physical Disk and then select Avg. Disk Sec/Read, then click the Add button.
8. Repeat this process for Avg. Disk Sec/Write. Your screen should now look like this:
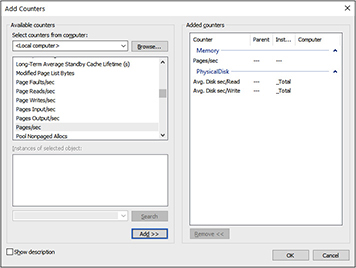
9. Click OK and those counters will now be displayed in the Performance Monitor:

Patch Version Performance baselines can change following patch deployment. Patches can change the way the system processes data or the dependencies involved in operations. Security patches, in particular, can add overhead to common system activities, necessitating an update of the baseline on the machine.
Application Version Performance baselines can change following application updates. Application vendors introduce new versions and patches when they want to address vulnerabilities, fix bugs, or add features. Each of these could result in performance changes to the application as the code changes. Applications may process data in a different way or require more processing to implement more secure encryption algorithms, more storage to track additional metadata, or more memory to load additional functions or feature elements into RAM.
Auditing Enabled Enabling auditing functions can significantly affect performance baselines. Auditing logs record events when certain actions are taken, such as failed logins, privilege use, error debug data, and other information useful for evaluating security or operational issues. However, tracking and storing this data increases the overhead of running processes and applications on the server and can have a big impact on the baseline.
If auditing is temporary, schedule auditing and baselining activities to occur on different dates if possible. If not, make operations aware that baseline values will be affected due to auditing.
Management Tool Compliance Management tools improve the process of collecting and analyzing data on performance metrics from testing, production, and other metrics and baselines collected as time progresses by putting all the data in one place where it can be easily queried, analyzed, and reported on.
Management tools can provide a dashboard of metrics that can be tweaked for operations teams to see changes, trends, and potential resource problems easily. Management tools may need to interface with cloud APIs or have an agent running on hypervisors to collect the data.
Performance Testing
A common item that is tested is how well the program or system performs. Cloud adoption is a combination of new systems and migrations of existing physical or virtual systems into the cloud. New systems will need to have new benchmarks defined for adequate performance. However, you can start with some generic role-based performance benchmarks until the applications have been tested under full load and actual performance data has been captured.
Existing systems should have performance metrics associated with ideal operational speed already, so implementers will be looking to meet or exceed those metrics in cloud implementations.
Performance metrics on systems without a load can show what the minimum resource requirements will be for the application, since the resources in use without activity on the machine represent the bare operational state. However, to get a realistic picture of how the system will perform in production and when under stress, systems will need to go through load testing and stress testing.
Load Testing
Load testing evaluates a system when the system is artificially forced to execute operations consistent with user activities at different utilization levels. Load testing emulates expected system use and can be performed manually or automatically. Manual load testing consists of individuals logging into the system and performing normal user tasks on the test system. In contrast, automated testing uses workflow automation and runtimes to execute normal user functions on the system.
Stress Testing
Stress testing is a form of load testing that evaluates a system under peak loads to determine its max data or user handling capabilities. Stress testing is used to determine how the application will scale. Stress testing can also be used to determine how many standard VM configurations of different types can exist on a single hypervisor. This can help in planning for ideal resource allocation and host load balancing.
Systems can be tested as a whole, or they can be tested in isolation. For example, testing of the web server in a test system may have allowed testers to identify the max load the web server can handle. However, in production, the operations team will deploy web servers in a load-balanced cluster. The data so far tells how many servers would be needed in the cluster for the expected workload, but the testing team needs to determine how many database servers would be required for the workload as well. Rather than spin up more web servers, the team can run a trace that captures all queries issued to the database server in the web server testing. They can then automate issuing those same queries multiple times over to see how many database servers would be required for the number of web servers.
Continuing the example, let’s assume that testing revealed that the web server could host up to 150 connections concurrently. The traffic from those 150 connections was captured and then replayed to the database server in multiples until the database server reached max load. The testing team might try doubling the traffic, then tripling it, and so forth until they reach the max load the database server can handle; for this example, we will say that it is five times the load, or the load of 750 end-user connections. The testing team would typically build in a buffer, since it is not good to run systems at 100 percent capacity, and then they would document system scalability requirements. In this example, assuming the ideal load is 80 percent or 120 connections instead of 150, the team would document that one web server should be allocated for each 120 concurrent user connections and that one database server should be allocated for every 600 concurrent user connections.
Taking this just a little bit further, the organization could configure rules to spin up a new VM from a template based on concurrent connections so that the system as a whole auto-scales.
Remote Transactional Monitoring
After systems are deployed, operations teams will want to know how different functions within the application are performing. End users do not typically provide the best information on what is actually causing a performance problem, but remote transactional monitoring can simulate user activity and identify how long it takes to perform each task. Cloud-based options can be deployed at different locations around the world to simulate the user experience in that region.
Remote transactional monitoring, deployed in this fashion, can be used by operations teams to isolate tasks that exceed established thresholds and determine whether thresholds differ around the globe. They can then isolate the individual system processes that are contributing to the performance issue and determine whether the performance issue is localized to the edge.
Available vs. Proposed Resources
The elasticity associated with virtualization and cloud computing can result in different resources being available to a VM than were proposed in requirements. Elastic computing allows computing resources to vary dynamically to meet a variable workload. (See Chapter 6 for more details.) Operations teams typically deploy machines with fewer resources than were proposed, but with a ceiling for growth.
Compute It is best to allocate one vCPU to a VM and then monitor performance, adding more vCPUs as needed. When a VM attempts to use a vCPU, the hypervisor must wait for the physical CPU associated with that vCPU to become available. The VM believes that vCPU to be idle and will attempt to spread the load around if the application is configured for multiprocessing, but this can have an adverse impact on VM performance if the physical CPU has a large number of processes in the queue. Furthermore, even idle processors place some load on the hypervisor from host management processes, so it is best not to provision more than will be necessary.
Where possible, monitor hypervisor metrics to determine if overcommitment bottlenecks are occurring. The most important metric to watch is the CPU ready metric. CPU ready measures the amount of time a VM has to wait for a physical CPU to become available. It is also important to monitor CPU utilization within each VM and on the host. High CPU utilization might indicate the need for additional vCPUs to spread the load, while high host CPU utilization could indicate whether VMs are properly balanced across hosts. If one host has high CPU utilization and others have available resources, it may be best to migrate some of the VMs to another host to relieve the burden on the overtaxed host.
Memory When configuring dynamic memory on VMs, ensure that you set both a minimum and a maximum. Default configurations typically allow a VM to grow to the maximum amount of memory in the host unless a maximum is set. There are hypervisor costs to memory allocation that you should be aware of. Based on the memory assigned, hypervisors will reserve some amount of overhead for the VM kernel and the VM. VMware has documented overhead for VMs in its “VM Right-Sizing Best Practice Guide.” According to VMware’s guide, one vCPU and 1GB of memory allocated to a VM produce 25.90MB of overhead for the host.
There is also the burden of maintaining overly large shadow page tables. Shadow page tables are how hypervisors map host memory to VMs and how the VM perceives the state of memory pages. This is necessary to prevent VMs from accessing host memory directly. If VMs could access the host memory directly, they could potentially access the memory of other VMs. These constraints can put unnecessary strain on a hypervisor if resources are overallocated. For this reason, keep resources to a minimum until they are actually required.
Configuration Testing
Configuration testing allows an administrator to test and verify that the cloud environment runs at optimal performance levels. Configuration testing needs to be done regularly and should be part of a weekly or monthly routine. When testing a cloud environment, a variety of aspects need to be verified.
Data Access Testing
The ability to access data stored in the cloud and hosted with a cloud provider is an essential function of a cloud environment. Accessing that data needs to be tested for efficiency and compliance so that an organization has confidence in the cloud computing model.
Network Testing
Testing network latency measures the amount of time between a networked device’s request for data and the network’s response from the requester. This helps an administrator determine when a network is not performing at an optimal level.
In addition to testing network latency, it is essential to test the network’s bandwidth or speed. The standard practice for measuring bandwidth is to transfer a large file from one system to another and measure the amount of time it takes to complete the transfer or to copy the file. The throughput, or the average rate of a successful message delivery over the network, is then determined by dividing the file size by the time it takes to transfer the file and is measured in megabits or kilobits per second. However, this test does not provide a maximum throughput and can be misleading because of overhead factors.
When determining bandwidth and throughput, it is important to understand that overhead needs to be accounted for, like network latency and system limitations. Dedicated software can be used to measure the throughput (e.g., NetCPS and iPerf) to get a more accurate measure of maximum bandwidth. Testing the bandwidth and latency of a network that is supporting a cloud environment is important since the applications and data that are stored in the cloud would not be accessible without the proper network configurations.
Application Testing
After moving an application to the cloud or virtualizing an application server in the cloud, testing that application or server will need to be performed regularly to ensure consistent operation and performance. There are various ways to test an application: some can be done manually, and some are automated.
Containerization is exceptionally effective at this point. Application containers are portable runtime environments containing an application and dependencies such as frameworks, libraries, configuration files, and binaries. These are all bundled into the container, which can run on any system with compatible container software. This allows application testing teams to deploy multiple isolated containers to the cloud for simultaneous testing.
Performance counters are used to establish an application baseline and verify that the application and the application server are performing at expected levels. Monitor performance metrics and set alerting thresholds to know when applications are nearing limits. Baselines and thresholds are discussed in more detail in the “Monitoring Techniques” section of Chapter 10. Batch files or scripts can easily automate checking the availability of an application or server or collecting performance metrics.
Applications need to be delivered seamlessly so that the end user is unaware the application is being hosted in a cloud environment. Tracking this information can help determine just how seamless that delivery process is.
A variety of diagnostic tools can be used to collect information about how an application is performing. To test application performance, an organization needs to collect information about the application, including requests and the number of connections. The organization also needs to track how often the application is being utilized, as well as overall resource utilization (memory and CPU).
Performance monitoring tools are valuable in evaluating application performance. Such tools can create reports on how quickly an application loads or spins up and analyze performance data on each aspect of the application as it is being delivered to the end user.
Follow this simple process in assessing application performance:
• Evaluate which piece of an application or service is taking the most time to process.
• Measure how long it takes each part of the program to execute and how the program is allocating its memory.
• Test the underlying network performance, storage performance, or performance of cloud virtual infrastructure components if using IaaS or PaaS.
In addition to testing the I/O performance of its storage system, a company can use a variety of tools for conducting a load test to simulate what happens to the storage system as the load is increased. Testing the storage system allows the organization to be more proactive than reactive with its storage and helps it plan for when additional storage might be required.
Testing in the Cloud Landscape
Cloud resources can be used as a “sandbox” of sorts to test new applications or new versions of applications without affecting the performance or even the security of the production landscape. Extensive application and application server testing can be performed on applications migrated to the cloud landscape before making cloud-based applications available to the organization’s users. Testing application and application server performance in the cloud is a critical step to ensuring a successful user experience. Performance issues can be identified before they are rolled out. This helps avoid user complaints and bad publicity.
Cloud landscape testing should include testing the application from the server hosting the application and its connection to the end user’s device. These testing procedures should use the application, and everything in between is critical success factors in testing the cloud environment.
Functional Testing
Systems are created to solve some business problem or to enhance an essential business process. It is important, therefore, to test the execution of those activities to ensure that they function as expected. Functional testing is used to verify that an application meets the requirements set forth when the application was authorized. Functional testers will establish what output would be expected given a specific input and then verify that the program exhibits this behavior.
Functionality can be tested with the steps shown in Figure 14-1. These steps include identifying actions the program should perform, defining test input, defining expected output, running through each test case, and comparing the actual output against the expected output.
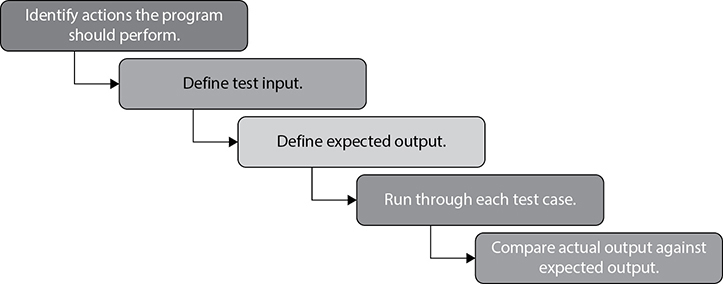
Figure 14-1 Functional testing steps
Quality assurance (QA) teams create a list of test cases, each with an established input that should produce a specific output. For example, if we create a user, a report of all users should display the user. If we instruct the application to display the top ten customer accounts with the largest outstanding balances, we should be able to verify that the ones displayed actually have the highest balances.
Regression Testing
Regression testing is used to determine whether code modifications break application features or functionality. With CI/CD, updates are produced rapidly and regularly so regression testing needs to be a part of the process. Cloud tools are available to automate portions of regression testing. Automation schedules are sometimes configured on a set schedule or based on triggers, such as when new code is placed in the repository.
Automated regression testing tools can compare the UI of the new build with the baseline build to identify changes. With record-playback features, an application can monitor the actions you take within the system and then perform those same steps during the test. Not only will it alert on failures, but it can also record response time metrics for each step to identify performance issues.
Regression tools can also automatically capture screenshots or video of failed or successful actions for documentation. This can aid developers in fixing issues. Some cloud regression testing tools include Selenium, Appium, Sikuli, JMeter, and ZapTest.
Regression testing differs from functional testing in that functional testing is performed on a new application, whereas regression testing is performed for application changes.
Usability Testing
Usability testing is geared toward determining if the application is easy for users to work with. Usability testing concentrates a lot on the user interface and can be broken down into four tests. Each one starts with a P so that they are easier to remember.
• Productivity Testing the effectiveness of the system.
• Performance Testing application efficiency. If an application is too slow to use, it will not be usable, so usability testing will determine if the application performs well enough for users to accept it.
• Precision Testing system accuracy
• Pleasantness Testing user-friendliness
SLA Comparisons
A service level agreement (SLA) is a contract that specifies the level of uptime that will be supported by the service provider, as well as expected performance metrics. SLAs include provisions for how the service provider will compensate cloud consumers if SLAs are not met. At a minimum, these include some monetary compensation for the time the system was down that may be credited toward future invoices. Sometimes the provider must pay fines or damages for lost revenue or lost customer satisfaction.
SLAs are specific to a cloud service, meaning that the SLA for cloud storage might differ from the SLA for cloud databases, cloud VMs, and so on.
A multilevel SLA is used when different types of cloud consumers use the same services. These are a bit more complicated to read, and cloud consumers must understand which type they are to understand their expectations for availability. Multilevel SLAs are useful for cloud providers that provide a similar solution to different customer types because the same SLA can be delivered to each customer. For example, a web hosting company may have different levels of service that are specified based on the customer type.
A service-based SLA describes a single service that is provided for all customers. There is no differentiation between customer expectations in a service-based SLA, unlike a multilevel SLA. For example, an Internet service provider (ISP) has specified the same SLA terms for each nonbusiness customer.
In comparison, a customer-based SLA is an agreement that is unique between the customer and service provider. Since business terms can vary greatly, the ISP in this example may use customer-based SLAs for business customers and the service-based SLA for home users.
It is crucial to understand which SLAs are in place. As a customer, you should be aware of what your availability expectations are so that you can work around downtime. As a provider, you need to understand your responsibility for ensuring a set level of availability and the consequences of not living up to that agreement. The establishment of SLAs is an important part of ensuring adequate availability of key resources so that the company can continue doing business and not suffer excessive losses.
Testing Sizing Changes
Sizing is performed for hosts and their guests. First, the host must be provisioned with sufficient resources to operate the planned VMs with a comfortable buffer for growth. This step is not necessary if you are purchasing individual machines from a cloud vendor because it is the cloud vendor’s responsibility to size the hosts that run the machines it provides to you. However, this is an important step if you rent the hypervisor itself (this is called “dedicated hosting”) in the cloud, as many companies do, in order to give them flexibility and control in provisioning.
One of the many benefits of virtualization is the ability to provision VMs on the fly as the organization’s demands grow, making the purchase of additional hardware unnecessary. If the host computer is not sized correctly, however, it is not possible to add VMs without adding compute resources to the host computer or purchasing additional resources from the cloud vendor.
It is a best practice to allocate fewer resources to VMs and then analyze performance to scale as necessary. It would seem that overallocating resources would not be a problem if the resources are available, and many administrators have fallen for this misconception. Overallocating resources results in additional overhead to the hypervisor and sometimes an inefficient use of resources.
For example, overallocating vCPUs to a VM could result in the VM dividing work among multiple vCPUs only to have the hypervisor queue them up because not enough physical cores are available. Similarly, overallocating memory can result in excessive page files consuming space on storage and hypervisor memory overhead associated with memory page tracking.
Test each resource independently so that you can trace the performance impact or improvement to the resource change. For example, make a change to the vCPU and then test before changing memory.
Testing High Availability
High availability (HA) was introduced in Chapter 13. As HA systems are deployed, they should also be tested to ensure that they meet availability and reliability expectations. Test the failure of redundant components such as CPU, power supplies, Ethernet connections, server nodes, and storage connections.
The HA system should continue to function when you simulate the failure of a redundant component. It is also important to measure the performance of a system when components fail. When a drive fails in parity-based RAID (RAID 5, RAID 6, RAID 50), the RAID set must rebuild. This can have a significant performance impact on the system as a whole. Similarly, when one node in an active/active cluster fails, all applications will run on the remaining node or nodes. This can also affect performance. Ensure that scenarios such as these are tested to confirm that performance is still acceptable under the expected load when components fail.
You can test the drive rebuild for a RAID set by removing one drive from the set and then adding another drive. Ensure that the disk you add is the same as the one removed. You can simulate the failure of one node in a cluster by powering that node down or by pausing it in the cluster.
Testing Load Balancing
When hosting an application in the cloud, there may be times where an organization uses the cloud as a load balancer. As discussed in previous chapters, load balancing with dedicated software or hardware allows for the distribution of workloads across multiple computers. Using multiple components can help improve reliability through redundancy, with multiple devices servicing the workload.
If a company uses load balancing to improve the availability or responsiveness of cloud-based applications, it needs to test the effectiveness of a variety of characteristics, including TCP connections per second, HTTP/HTTPS connections per second, and traffic loads simulated to validate performance under high-traffic scenarios. Testing all aspects of load balancing helps ensure that the computers can handle the workload and that they can respond in the event of a single server outage.
Testing Connectivity
In addition to this end-to-end testing, an organization needs to be able to test the connectivity to the cloud service. Without connectivity to the cloud that services the organization, the organization could experience downtime and costly interruptions to its data. It is the cloud administrator’s job to test the network for things such as network latency and replication and to make sure that an application hosted in the cloud can be delivered to the users inside the organization.
Verifying Data Integrity
Data integrity is the assurance that data is accurate and that the same information that is stored in the cloud is the data that is later retrieved. The data remains unchanged by unauthorized processes. Application data is valuable and must be protected against corruption or incorrect alteration that could damage its integrity. Data integrity testing can be combined with other testing elements to ensure that data does not change unless specified. For example, functional testing reviews each test case along with the specified input and output. Data integrity testing would detect data integrity issues with the direct test case, but automated integrity checks could also be built in to verify that all other data has not changed in the process.
Similarly, when performing load testing, ensure that data does not change as the system reaches its max capacity. Performance constraints can sometimes result in a cascade failure, and you want to ensure that data is adequately protected in such a case.
Evaluating Replication
Some situations require an organization to replicate or sync data between its internal data center and a cloud provider. Replication is typically performed for fault tolerance or load-balancing reasons. After testing network latency and bandwidth, it is important to check and verify that the data is replicating correctly between the internal data center and the cloud provider or between multiple cloud services.
Test by making a change on one replication partner and then confirm that the change has taken place on the other replication partners. Measure how long it takes to complete replication by creating replication metrics. Combine replication testing with load testing to ensure that replication can stay consistent even under heavy loads and to determine at what point replication performance decreases.
Automation and Orchestration
Organizations are adopting numerous cloud technologies that offer a myriad of services to them and often involve exchanging data through them. While the cloud provider is responsible for standard maintenance tasks associated with its on-premises technology, each organization is responsible for managing the cloud services it consumes, including implementing operational rules and specific business rules to best leverage the cloud technology to fulfill its operational needs. Automation and orchestration are two ways for an organization’s IT staff to reduce the time spent on tasks, increase the speed of technological development, and improve efficiencies. The two concepts of automation and orchestration work well together, but they are not the same thing.
Automation uses scripting, scheduled tasks, and automation tools to programmatically execute workflows that were formerly performed manually. Orchestration manages automation workflows to optimize efficiencies and ensure effective execution.
Orchestration integrates organizational systems to provide more value to the organization. In orchestration, workflow automations are called runbooks, and each discrete step in a runbook is called an activity.
As an example of orchestration integration, an IT person working on a customer trouble ticket could generate change requests from within the ticketing system by selecting the type of change and providing relevant details. This would prompt a set of activities to get the change approved. Once approved, the runbook could be automatically executed if one exists for the task, with the input provided by the IT person in the ticket. The output from the runbook could then be placed into the change management system and documented on employee timesheets while metrics are gathered for departmental meetings. This is the power of orchestration!
Orchestration requires integration with a variety of toolsets and a catalog of sufficiently developed runbooks to complete tasks. Orchestration often involves a cloud portal or other administrative center to provide access to the catalog of workflows along with data and metrics on workflow processes, status, errors, and operational efficiency. The orchestration portal displays useful dashboards and information for decision-making and ease of administration.
In this scenario, orchestration ensures that tickets are handled promptly, tasks are performed according to SOPs, associated tasks such as seeking change approval and entering time are not forgotten, and the necessary metrics for analytics and reporting are collected and made available to managers.
Interrelationships are mapped between systems and runbooks, along with requirements, variables, and dependencies for linked workflows. This facilitates the management of cloud tools and integration of tools and processes with a variety of legacy tools. Management options are improved with each new workflow that automates management that once would have required logging into many different web GUIs, workstations, servers, or traditional applications or sending SSH commands to a CLI to accomplish.
This section is organized into the following subsections:
• Event orchestration
• Scripting
• Custom programming
• Runbook management for single nodes
• Orchestration for multiple nodes and runbooks
• Automation activities
Event Orchestration
Event logs used to be reviewed by IT analysts who understood the servers and applications in their organization and had experience solving a variety of problems. These individuals commonly used knowledge bases of their own making or those created by communities to identify whether an event required action to be taken and what the best action was for the particular event.
The rapid expansion of the cloud and IT environments, as well as the increasing complexity of technology and integrations, has made manual event log analysis a thing of the past. However, the function of event log analysis and the corresponding response to actionable events is still something companies need to perform. They accomplish this through event orchestration.
Event orchestration collects events from servers and devices such as firewalls and virtual appliances in real time. It then parses events, synchronizes time, and executes correlation rules to identify commonalities and events that, together, could form a risk. It ranks risk items, and if they exceed specific thresholds, it creates alerts on the events to notify administrators. Some events may result in runbook execution. For example, excessive login attempts from an IP address to an FTPS server could result in runbook execution to add the offending IP address to IP blocklists. Similarly, malware indicators could quarantine the machine by initiating one runbook to disable the switch port connected to the offending machine and another runbook to alert local incident response team members of the device and the need for an investigation.
Scripting
Scripting languages offer a simple way to accomplish tasks without developing an entire program. Scripts can be used to perform something as simple as a single task, such as displaying a message, to complex operations, like deploying services. This makes them quite flexible and easy to apply to a diverse set of solutions.
There are a wide variety of scripting languages, and some may be more applicable to certain uses. Most orchestration tools support a large number of scripting languages, so feel free to use the tools that are most effective for the task or those that you are most familiar with. The advantage of scripting languages is that they are relatively simple to learn, they can run with a small footprint, they are easy to update, and they are widely supported. Some popular scripting languages include
• CoffeeScript
• ECMAScript
• Go
• JavaScript
• Perl
• PHP
• Python
• Ruby
• SQL
• VBScript and VBA
OS and Application-Specific Scripting Languages
A host of languages are specific to certain applications, operating systems, or functions. For example, Google Apps Script can be used in the Google Workspace (formerly G Suite) to automate functions, PL/SQL with Oracle databases, Advanced Business Application Programming (ABAP) for SAP reporting, forms, and data manipulation or LotusScript for Lotus software applications.
Job Control Languages and Shells
Another type of scripting language is known as job control languages or shells. These languages are interpreted by an application running on the platform. Table 14-1 shows some of the common job control languages and the platform they work on.
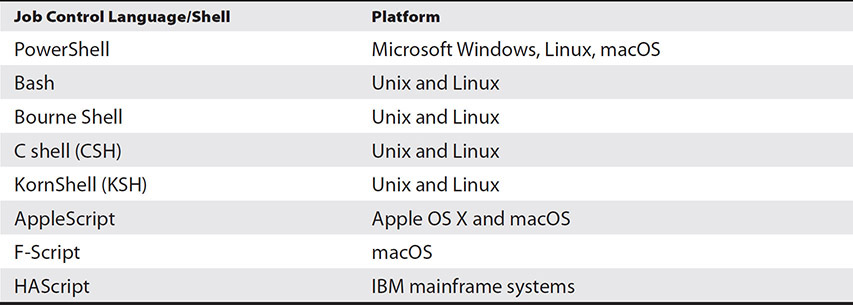
Table 14-1 Job Control Languages and Shells
Custom Programming
Full-fledged programming languages can be used to create runbooks as well as hook into cloud-based APIs. Programming languages offer more capabilities than scripting languages, and there are powerful development environments that can allow for more extensive testing. Programming languages are also good to use when runbook programs are increasingly complex because programs can be organized into flexible modules. Some popular languages include
• Basic
• C, C++, and C#
• ColdFusion
• Java
• Lisp
• Python
• Scala
• PHP
Runbook Management for Single Nodes
As previously stated, runbooks are workflows organized into a series of tasks called activities. Runbooks begin with an initiation activity and end with some activity to disconnect and clean up. In-between activities may include processing data, analyzing data, debugging systems, exchanging data, monitoring processes, collecting metrics, and applying configurations. Runbook tools such as Microsoft System Center Orchestrator include plug-in integration packs for Azure and AWS cloud management.
Single-node runbooks are those that perform all activities on a single server or device. For example, this runbook would perform a series of maintenance activities on a database server:
1. Connect to the default database instance on the server.
2. Enumerate all user databases.
3. Analyze indexes for fragmentation and page count.
4. Identify indexes to optimize.
5. Rebuild indexes.
6. Reorganize indexes.
7. Update index statistics.
8. Perform database integrity checks.
9. Archive and remove output logs older than 30 days.
10. Remove rows from the commandlog table older than 30 days.
11. Disconnect from the default database instance on the server.
Orchestration for Multiple Nodes and Runbooks
Multiple-node runbooks are those that interface with multiple devices or servers. For example, this runbook would patch all VMs on all hosts in the customer cloud:
1. Enumerate VMs on each host.
2. Create a snapshot of VMs.
3. Add VMs to the update collection.
4. Scan for updates.
5. Apply updates to each machine, restarting load-balanced servers and domain controllers one at a time.
6. Validate service states.
7. Validate URLs.
8. Remove snapshot after 24 hours of successful runtime.
Automation Activities
A wonderful thing about runbooks is that there is a great deal of community support for them. You can create your own runbooks—and you definitely will have to do that—but you also can take advantage of the many runbooks that others have created and made available in runbook communities. Some of these can be used as templates for new runbooks to save valuable development time. Consider contributing your own runbooks to the community to help others out as well. Microsoft maintains a gallery of runbooks that can be downloaded for implementation on the Microsoft Azure cloud computing platform. Other vendors have set up community runbook repositories as well.
Routine Operations
Here are some runbook activities that are used for routine operations.
• Snapshots Activities can be created to take snapshots of VMs or remove existing snapshots or snapshot chains from VMs. Runbooks might use this activity when making changes to a VM. The snapshot could be taken first, and then the maintenance would be performed. If things ran smoothly, the snapshot could be removed. Otherwise, the runbook could execute the activity to apply the snapshot taken at the beginning of the runbook.
• Cloning Activities can be created to make a clone of a VM. A runbook using this activity might combine it with an activity to create a template from the clone, or an activity to archive the clone to secondary storage, or an activity to send the clone to a remote replication site and create a VM from it.
• User account creation Activities can be created to create a user account based on form input. For example, the activity could create the account in Windows Active Directory and on several cloud services and then add the user account to groups based on the role provided on the form input.
• Permission setting Activities can be created to apply permissions to a group of files, folders, and subfolders.
• Resource access Activities can be created to assign resources to a device such as storage LUNs, virtual NICs, or other resources. This can be useful for runbooks that provision VMs or provision storage.
• User account management Activities can be created to reset user account passwords, disable accounts, unlock accounts, or activate accounts.
• Shutdowns You may want to shut down a large number of systems to perform maintenance on them. This could also be performed as a containment action in the case of an intrusion or malware. If there is a power outage, battery systems may be configured to automatically shut down systems that are attached to them once battery levels reach a low threshold so that systems are shut down in a controlled manner instead of simply losing power.
• Restarts Restarting systems may be required for changes to take effect or as part of patch deployment. Still other systems may need a periodic restart just to ensure that they operate at a consistent level. These are easy tasks to automate.
• Create internal APIs Internal APIs can be created based on workflow or self-service operations.
• Scaling When performance metrics hit thresholds, systems can be configured to receive additional resources, such as RAM or CPU, to ensure that performance does not degrade.
Change and Configuration Management
The process of making changes to the cloud environment from its design phase to its operations phase in the least impactful way possible is known as change management. Configuration management ensures that the assets required to deliver services are adequately controlled and that accurate and reliable information about those assets is available when and where it is needed.
Change management and configuration management support overall technology governance processes to ensure that cloud systems are managed appropriately. All change requests and configuration items need to be documented to make certain that the requirements documented as part of the strategy phase are fulfilled by its corresponding design phase.
Change Management
Change management is a collection of policies and procedures that are designed to mitigate risk by evaluating change, ensuring thorough testing, providing proper communication, and training both administrators and end users.
A change is defined as the addition, modification, or removal of anything that could affect cloud services. This includes modifying system configurations, adding or removing users, resetting accounts, changing permissions, and a host of other activities that are part of the ordinary course of cloud operations, and also includes conducting project tasks associated with upgrades and new initiatives. It is important to note that this definition is not restricted to cloud components; it should also be applied to documentation, people, procedures, and other nontechnical items that are critical to a well-run cloud environment. The definition is also important because it debunks the notion that only “big” changes should follow a change management process. However, it is often the little things that cause significant problems, and thus change management needs to be applied equally to both big and small changes.
Change management maximizes business value through modification of the cloud environment while reducing disruption to the business and unnecessary cloud expense due to rework. Change management helps ensure that all proposed changes are both evaluated before their implementation and recorded for posterity. Change management allows companies to prioritize, plan, test, implement, document, and review all changes in a controlled fashion according to defined policies and procedures.
Change management optimizes overall business risk. It does this by building a process of evaluating both the risks and the benefits of a proposed change in the change procedure and organizational culture. Identified risks contribute to the decision to either approve or reject the change.
Lastly, change management acts as a control mechanism for the configuration management process by ensuring that all changes to configuration item baselines in the cloud environment are updated in the configuration management system (CMS).
A change management process can be broken down into several constituent concepts that work together to meet these objectives. These concepts are as follows:
• Change requests
• Change proposals
• Change approval or rejection
• Change scheduling
• Change documentation
• Change management integration
Change Requests
A request for change (RFC) is a formal request to make a modification that can be submitted by anyone who is involved with or has a stake in that particular item or service. IT leadership may submit changes focused on increasing the profitability of a cloud service; a systems administrator may file a change to improve system stability, and an end user may submit a change that requests additional functionality for their job role. All are valid requests for change.
Change Request Types Change request types are used to categorize both the amount of risk and the amount of urgency each request carries. There are three types of changes: normal changes, standard changes, and emergency changes.
Normal changes are changes that are evaluated by the defined change management process to understand the benefits and risks of any given request. Standard changes request a type of change that has been evaluated previously and now poses little risk to the health of the cloud services. Because it is well understood, poses a low risk, and the organization does not stand to benefit from another review, a standard change is preauthorized. For example, resetting a user’s password is a standard task. It still requires approval to ensure it is tracked and not abused, but it does not require the deliberation other changes might.
Emergency changes, as the name suggests, are used in case of an emergency and designate a higher level of urgency to move into operation. Even if the change is urgent, all steps of the process for implementing the change must be followed. However, the process can be streamlined. The review and approval of emergency changes, however, is usually executed by a smaller group of people than is used for a normal change to facilitate moving the requested change into operation.
Change Proposals
Change proposals are similar to RFCs but are reserved for changes that have the potential for major organizational impact or severe financial implications. The reason for a separate designation for RFCs and change proposals is to make sure that the decision-making for highly strategic changes is handled by the right level of leadership within the organization.
Change proposals are managed by the CIO or higher position in an organization. They are a high-level description of the change requiring the approval of those responsible for the strategic direction associated with the change. Change proposals help IT organizations stay efficient by not wasting resources on the intensive process required by an RFC to analyze and plan the proposed change if it is not in the strategic best interest of the organization to begin with.
Change Approval or Rejection
The change manager is the individual who is directly responsible for all the activities within the change management process. The change manager is ultimately responsible for the approval or rejection of each RFC and for making sure that all RFCs follow the defined policies and procedures as a part of their submission. The change manager will evaluate the change and decide to approve the change or reject it.
Change managers cannot be expected to know everything, nor to have full knowledge of the scope and impact of the change, despite the documentation provided in the change request because systems are highly integrated and complex. One small change to one system could have a big impact on another system. For this reason, the change manager assembles the right collection of stakeholders to help advise on the risks and benefits of a given change and to provide the input that will allow the change manager to make the right decision when he or she is unable to decide autonomously.
Change Advisory Board The body of stakeholders that provides input to the change manager about RFCs is known as the change advisory board (CAB). This group of stakeholders should be composed of members from all representative areas of the business, as well as customers who might be affected by the change (see Figure 14-2). As part of their evaluation process for each request, the board needs to consider the following:
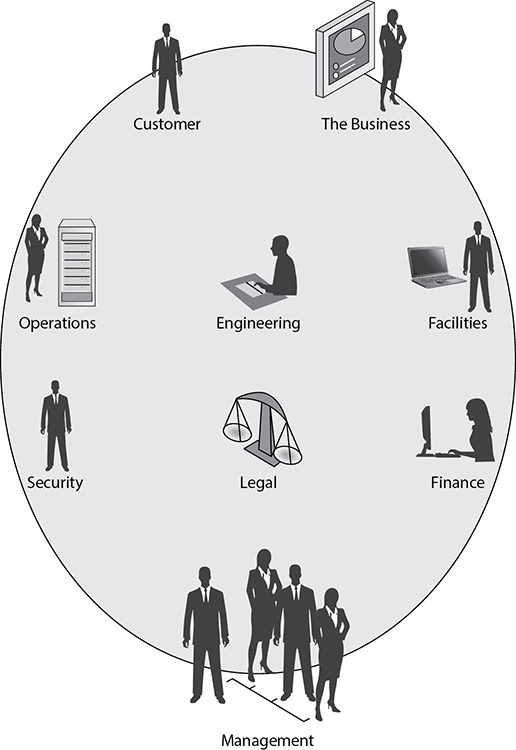
Figure 14-2 The entities represented by a change advisory board (CAB)
• The reason for the change
• The benefit of implementing the change
• The risks associated with implementing the change
• The risks associated with not implementing the change
• The resources required to implement the change
• The scheduling of the implementation
• The impact of the projected service outage concerning established SLAs
• The planned backout strategy in case of a failed change
While this may seem like it involves a lot of people and time to consider each change to the environment, these policies and procedures pay off in the long run. They do so by limiting the impact of unknown or unstable configurations going into a production environment.
Emergency Change Advisory Board A CAB takes a good deal of planning to get all the stakeholders together. In the case of an emergency change, there may not be time to assemble the full CAB. For such situations, an emergency change advisory board (ECAB) should be formed. This emergency CAB should follow the same procedures as the standard CAB; it is just a subset of the stakeholders who would usually convene for the review. Often the ECAB is defined as a certain percentage of a standard CAB that would be required by the change manager to make sure they have all the input necessary to make an informed decision about the request.

EXAM TIP When implementing a change that requires expedited implementation approval, an emergency change advisory board should be convened.
Change Scheduling
Approved changes must be scheduled. Some changes can take place right away, but many must be planned for a specific time and date when appropriate team members are available and when stakeholders have been notified of the change.
Not all changes require downtime, but it is imperative to understand which ones do. Changes that require the system to be unavailable need to be performed during downtime. Stakeholders, including end users, application owners, and other administrative teams, need to be consulted prior to scheduling a downtime so that business operations are not adversely affected. They need to understand how long the downtime is anticipated to take, what value the change brings to them, and the precautions that are being taken to protect against risks. For customer-facing systems, downtimes need to be scheduled or avoided so that the company does not lose customer confidence by taking a site, application, or service down unexpectedly.
Upgrades may not require downtime, but they could still affect the performance of the VM and the applications that run on top of it. For this reason, it is best to plan changes for times when the load on the system is minimal.
Enterprise systems may have a global user base. Additionally, it may be necessary to coordinate resources with cloud vendors, other third parties, or with support personnel in different global regions. In such cases, time zones can be a considerable constraint for performing upgrades. It can be difficult to coordinate a time that works for distributed user bases and maintenance teams. For this reason, consider specifying in vendor contracts and SLAs an upgrade schedule so that you are not gridlocked by too many time zone constraints and are unable to perform an upgrade.
Working hours should also be factored in when scheduling change implementation. For example, if a change is to take three hours of one person’s time, then it must be scheduled at least three hours prior to the end of that person’s shift, or the task will need to be transitioned to another team member while still incomplete. It generally takes more time to transition a task from one team member to another, so it is best to try to keep this to a minimum.
It is also important to factor in some buffer time for issues that could crop up. In this example, if the change is expected to take three hours and you schedule it exactly three hours before the employee’s shift ends, that provides no time for troubleshooting or error. If problems do arise, the task would be transitioned to another team member, who would need to do the troubleshooting that might require input from the first team member to avoid rework, since the second employee may not know everything that was done in the first place.
If those implementing the change run into difficulties, they should document which troubleshooting steps they performed as well. This is especially important if others will be assisting the individual in troubleshooting the issue. This can also be helpful when working with technical support. This leads us to the next step in the change management process: documentation.
Change Documentation
It is important to keep a detailed log of what changes were made. Sometimes the impact of a change is not seen right away. Issues could crop up sometime down the road, and it helps to be able to query a system or database to view all the changes related to current issues.
After every change has been completed, it must go through a defined procedure for both change review and closure. This review process is intended to evaluate whether the objectives of the change were accomplished, whether the users and customers were satisfied, and whether any new side effects were produced. The review and closure process is also intended to evaluate the resources expended in the implementation of the change, the time it took to implement, and the overall cost so that the organization can continue to improve the efficiency and effectiveness of the cloud IT service management processes.
Change documentation could be as simple as logging the data in a spreadsheet, but spreadsheets offer limited investigative and analytical options. It is best to invest in a configuration management database (CMDB) to retain documentation on requests, approvals or denials, and change implementation. The CMDB is discussed in the upcoming “Configuration Management” section.
Change Management Integration
The change process may sound bureaucratic and cumbersome, but it does not have to be. Integrate change management into your organization in a way that fits with your organizational culture. Here are some ideas.
Users could submit change requests through a web-based portal, which would send an e-mail to the change approvers. Change approvers could post requests to the change approval board on Slack or some other medium to solicit feedback and then use that feedback to approve or reject the change in the system. Communication on the issue could include a hashtag (a feature of Slack) with the change ID so that it could be easily tracked. Another channel could be used to communicate with stakeholders to schedule the time and resources for the change.
Some workflow can be built into the system to help automate scheduling. You can also use tools to help capture details of changes, such as scripts that dump firewall configurations to the configuration management database when they are made and archival tools to export the CAB discussions to the database. When changes are complete, they can be updated in the same system so that everything is tracked.
Essentially, the entire process can be streamlined and still offer robust checks and balances. Don’t be afraid of change management. Look for ways to integrate it into your company.
Configuration Management
Change management offers value to both information technology organizations and their customers. One problem when implementing change management, however, lies in how the objects that are being modified are classified and controlled. To this end, we introduce configuration management, which deals with cloud assets and their relationships to one another.
The purpose of the configuration management process is to ensure that the assets and configuration items (CIs) required to deliver services are adequately controlled and that accurate and reliable information about those assets and CIs is available when and where it is needed. CIs are defined as any asset or document that falls within the scope of the configuration management system. Configuration management information includes details of how the assets have been configured and the relationships between assets.
The objectives of configuration management are as follows:
• Identifying CIs
• Controlling CIs
• Protecting the integrity of CIs
• Maintaining an accurate and complete CMS
• Maintaining information about the state of all CIs
• Providing accurate configuration information
The implementation of a configuration management process results in improved overall service performance. It is also important for optimization of both the costs and risks that can be caused by poorly managed assets, such as extended service outages, fines, incorrect license fees, and failed compliance audits. Some of the specific benefits to be achieved through its implementation are the following:
• A better understanding on the part of cloud professionals of the configurations of the resources they support and the relationships they have with other resources, resulting in the ability to pinpoint issues and resolve incidents and problems much faster
• A much richer set of detailed information for change management from which to make decisions about the implementation of planned changes
• Greater success in the planning and delivery of scheduled releases
• Improved compliance with legal, financial, and regulatory obligations with less administration required to report on those obligations
• Better visibility to the true, fully loaded cost of delivering a specific service
• Ability to track both baselined configuration deviation and deviation from requirements
• Reduced cost and time to discover configuration information when required
Although configuration management may appear to be a straightforward process of just tracking assets and defining the relationships among them, you will find that it has the potential to become very tricky as we explore each of the activities associated with it.
At the very start of the process implementation, configuration management is responsible for defining and documenting which assets of the organization’s cloud environments should be managed as configuration items. This is a highly important decision, and careful selection at this stage of the implementation is a critical factor in its success or failure. Once the items that will be tracked as CIs have been defined, the configuration management process has many CI-associated activities that must be executed. For each CI, it must be possible to do the following:
• Identify the instance of that CI in the environment. A CI should have a consistent naming convention and a unique identifier associated with it to distinguish it from other CIs.
• Control changes to that CI through the use of a change management process.
• Report on, periodically audit, and verify the attributes, statuses, and relationships of any and all CIs at any requested time.
If even one of these activities is not achievable, the entire process fails for all CIs. Much of the value derived from configuration management comes from a trust that the configuration information presented by the CMS is accurate and does not need to be investigated. Any activity that undermines that trust and requires a stakeholder to investigate CI attributes, statuses, or relationships eliminates the value the service is intended to provide.
Configuration Management Database
A CMDB is a database used to store configuration records throughout their life cycle. The configuration management system maintains one or more CMDBs, and each database stores attributes of CIs and relationships with other configuration items.
Record all the attributes of the CI in a CMDB. A CMDB is an authority for tracking all attributes of a CI. An environment may have multiple CMDBs that are maintained under disparate authorities, and all CMDBs should be tied together as part of a larger CMS. One of the key attributes that all CIs must contain is ownership. By defining an owner for each CI, organizations can achieve asset accountability. This accountability imposes responsibility for keeping all attributes current, inventorying, financial reporting, safeguarding, and other controls necessary for optimal maintenance, use, and disposal of the CI. The defined owner for each asset should be a key stakeholder in any CAB that deals with a change that affects the configuration of that CI, thus providing the owner with configuration control.
Playbook
A configuration management playbook is a method for automating configuration management procedures. It is similar to a runbook but applied to configuration management activities, such as deploying new systems, software, or code.
Configuration management tools maintain an inventory of systems and the software versions running on them. Deploying new software to a group is then as simple as defining the software version to deploy and the set of machines from the inventory. The configuration management tool will then determine if the software needs to be deployed to those systems (they might already be running the defined version) and which upgrade package to deploy to bring them to the desired level. Figure 14-3 shows configuration management software managing computers, containers, databases, mobile devices, servers, and cloud services.
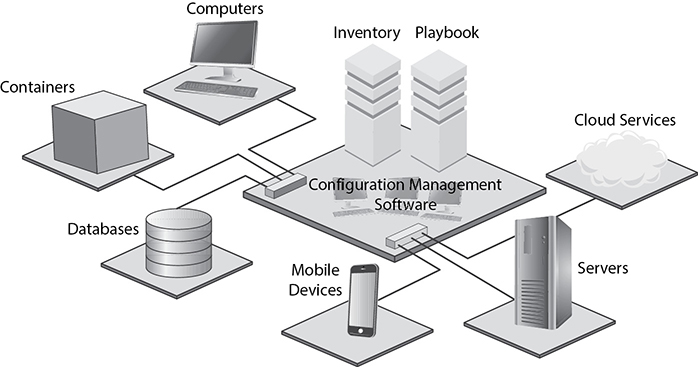
Figure 14-3 Configuration management software
One popular platform for configuration management is Ansible. Ansible playbooks are YAML statements that define the automation procedures. YAML is a recursive acronym that stands for YAML Ain’t Markup Language.

NOTE Some configuration management tools use different terminology. For example, Chef calls its automation function a cookbook.
Chapter Review
The first part of this chapter covered testing techniques. The ability to test the availability of a cloud deployment model allows an organization to be proactive with the services and data that it stores in the cloud.
Automation and orchestration are two ways to reduce time spent on tasks, increase the speed of technological development, and improve efficiencies. Automation uses scripting, scheduled tasks, and automation tools to programmatically execute workflows that were formerly performed manually. Orchestration manages automation workflows to optimize efficiencies and ensure effective execution. Orchestration integrates organizational systems to provide more value to the organization. In orchestration, workflow automations are called runbooks, and each discrete step in a runbook is called an activity.
The chapter ended with a discussion on change and configuration management. A change is defined as the addition, modification, or removal of anything that could affect cloud services. Configuration management, on the other hand, is concerned with controlling cloud assets and their relationships to one another through CIs.
Questions
The following questions will help you gauge your understanding of the material in this chapter. Read all the answers carefully because there might be more than one correct answer. Choose the best response(s) for each question.
1. Which configuration test measures the amount of time between a networked device’s request for data and the network’s response?
A. Network bandwidth
B. Network latency
C. Application availability
D. Load balancing
2. Which of the following items is not included in a baseline?
A. Performance
B. Vulnerabilities
C. Availability
D. Capacity
3. Which of the following would be used in orchestration to execute actions to automatically perform a workflow?
A. Simulator
B. Workplan
C. Runbook
D. Scheduled task
4. Which of the following is a scripting language?
A. Cobol
B. C++
C. Java
D. PowerShell
5. Which of the following are objectives of change management? (Choose all that apply.)
A. Maximize business value.
B. Ensure that all proposed changes are both evaluated and recorded.
C. Identify configuration items (CIs).
D. Optimize overall business risk.
6. Which of the following are objectives of configuration management? (Choose all that apply.)
A. Protect the integrity of CIs.
B. Evaluate performance of all CIs.
C. Maintain information about the state of all CIs.
D. Maintain an accurate and complete CMS.
7. Dieter is a systems administrator in an enterprise IT organization. The servers he is responsible for have recently been the target of a malicious exploit, and the vendor has released a patch to protect against this threat. If Dieter would like to deploy this patch to his servers right away without waiting for the weekly change approval board meeting, what should he request to be convened?
A. ECAB
B. Maintenance window
C. Service improvement opportunity
D. CAB
Answers
1. B. Testing network latency measures the amount of time between a networked device’s request for data and the network’s response. Testing network latency helps an administrator determine when a network is not performing at an optimal level.
2. B. Vulnerabilities are discovered in vulnerability management, which is not a function of baselining. Organizations may track the number of vulnerabilities and remediation of those vulnerabilities, but as a business metric, not a baseline. A baseline is used to better understand normal performance so that anomalies can be identified.
3. C. A runbook is a workflow automation that can be used in orchestration tools.
4. D. PowerShell is a scripting language for Windows, Linux, and macOS.
5. A, B, D. Maximizing business value, ensuring that all changes are evaluated and recorded, and optimizing business risk are all objectives of change management.
6. A, C, D. The objectives of configuration management are identifying CIs, controlling CIs, protecting the integrity of CIs, maintaining an accurate and complete CMS, and providing accurate configuration information when needed.
7. A. Dieter would want to convene an emergency change advisory board (ECAB). The ECAB follows the same procedures that a CAB follows in the evaluation of a change; it is just a subset of the stakeholders that would usually convene for the review. Because of the urgency for implementation, convening a smaller group assists in expediting the process.