
CHAPTER 4
Introduction to Ghidra
In this chapter, we cover the following topics:
• Ghidra installation and a quick start, along with a simple project setup
• An overview of Ghidra’s most essential functionality
• Annotations to achieve improved reversed code’s readability and understanding
• Practical walkthrough binary diffing and patch analysis
Ghidra is a Software Reverse Engineering (SRE) suite of tools developed and maintained by the National Security Agency’s Research Directorate in support of its cybersecurity mission. Ghidra was made publicly available and open sourced around March to April of 2019 but has been battle-tested privately by the agency. It can be used for malware analysis, vulnerability research, exploit development, as well as many other embedded systems and firmware reverse engineering tasks.
Ghidra supports a variety of architectures, platforms, and binary formats, providing a very interesting set of features. Also, its community is rapidly growing, as Ghidra has provided an excellent open source and free-of-cost alternative to other great tools such as IDA Pro.
Creating Our First Project
In this chapter, we will be compiling a sample program suitable to showcase Ghidra’s features and functionalities. This sample program is a student grade management tool that loads a CSV file and contains a vulnerability for our hands-on analysis tasks.
The students.c, students-patched.c, and students.csv files are provided to you in your ~/GHHv6/ch04 folder, provided you have previously cloned the Gray Hat Hacking 6th Edition Git repository.
Run the following commands in a terminal window to compile the two versions of the program (a default vulnerable version and a patched version):
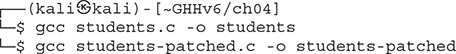
Now that we have our target programs ready, we can create a project to work with them and walk through Ghidra’s features and functionality.
Installation and QuickStart
Let’s start by installing the Java 11 runtime dependency for Ghidra in a default Kali system:
![]()
Next, download the Ghidra release v9.2.3 package from the official Ghidra website (https://ghidra-sre.org) and extract it to your home directory:
![]()
Once you’re done with the install, enter the ghidra_9.2.3_PUBLIC directory and run it using ./ghidraRun, like so:
![]()
This should launch Ghidra for the first time and prompt you with the end-user agreement.
Setting the Project Workspace
The first thing you encounter upon running Ghidra is the project window and a “Tip of the Day” pop-up (which we recommend you check occasionally). You can close this pop-up to view the project window.
In the project window, you can manage your projects, workspace, and tools. By default, Ghidra is shipped with the Code Browser and version-tracking tools. We will walk you through the installation of the Debugger tool toward the end of the chapter.
Functionality Overview
Although Ghidra offers a lot of features and functionality, we will only focus on the most basic and beneficial features for simplicity’s sake.
Project Window
The project window is the main window available to you after Ghidra loads; it provides project management features, the active project’s target files, tool chests, and an overall workspace definition.
Let’s create our project and start working with the previously compiled target files. Launch Ghidra, if you haven’t already, and then follow these steps:
1. Create a new project by clicking File | New or by pressing CTRL-N. We will set this project to private (that is, a non-shared project) as well as set the project’s name and the folder where it will be located.
2. Include the student and student-patched binary files in the project by clicking File | Import or by pressing I for each one. This will detect the file format and language of the binary file (ELF compiled with x86:LE:64:default:gcc, in this case), as shown next.
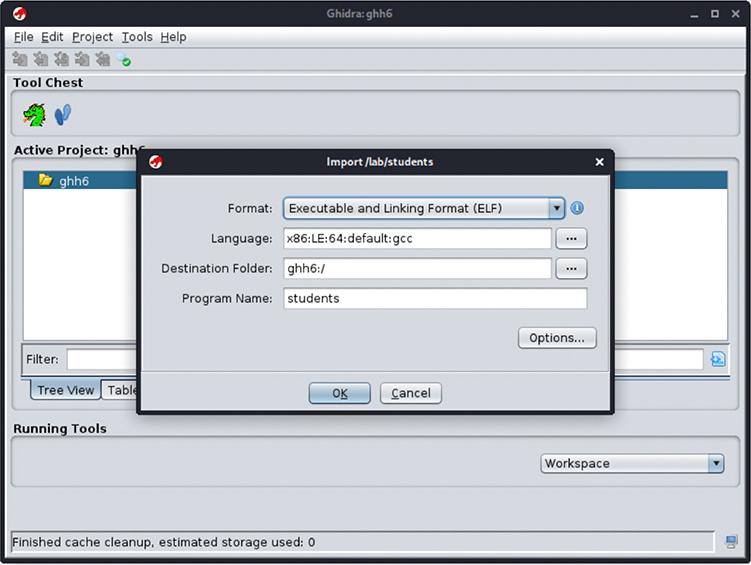
3. Click the OK button. An import results summary will be shown with the file’s metadata and header properties.
4. Double-click the students target file to launch the Code Browser and start the analysis.
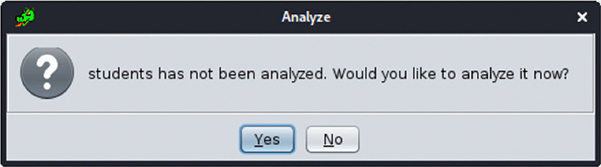
Analysis
As soon as Ghidra loads the program, it suggests analyzing the program if it hasn’t already been done before:
The analyzer performs many tasks, but the most notable ones are shown here and described next:
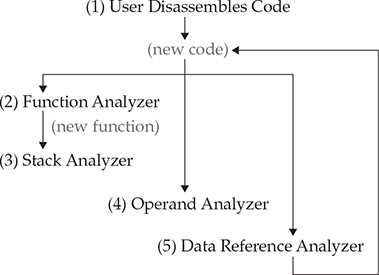
• Function Analyzer Assigns addresses and names to functions based on their symbol reference or by detecting function prologues and epilogues in the code disassembly.
• Stack Analyzer Infers stack variable sizes and references based on stack base and pointer operations at the beginning of the function.
• Operand Analyzer Assigns and resolves address and symbol references based on scalar operands.
• Data Reference Analyzer Resolves addresses and references to data values and obvious data types based on their memory section location and operands in the code.
The Analysis | One-Shot submenu allows you to trigger many or all the different analysis tasks on a selected code block.
Code Browser
The Code Browser provides an intuitive user interface to Ghidra’s core functionality and navigation. Most of your time spent working with Ghidra will be in this view, as it has menus and toolbars for the most common tasks. The default layout is shown in Figure 4-1 and described next.
![]() Main menu All the main options are available from this menu.
Main menu All the main options are available from this menu.
![]() Toolbar Here you will find a group of icon buttons you can use as shortcuts for common functionality.
Toolbar Here you will find a group of icon buttons you can use as shortcuts for common functionality.
![]() Program Trees This provides tree lists of all the memory segments defined by the binary and will vary depending on the binary format and loader.
Program Trees This provides tree lists of all the memory segments defined by the binary and will vary depending on the binary format and loader.
![]() Symbol Tree Here you can quickly navigate through all the symbols defined by the debugging information or resolved by the initial analysis. These symbols are separated by type: imports, exports, functions, labels, classes, and namespaces.
Symbol Tree Here you can quickly navigate through all the symbols defined by the debugging information or resolved by the initial analysis. These symbols are separated by type: imports, exports, functions, labels, classes, and namespaces.
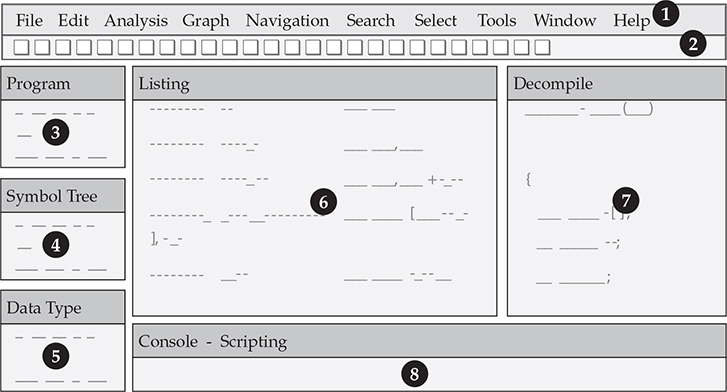
Figure 4-1 The Code Browser’s default layout
![]() Data Type Manager Built-in, generic, binary-provided, and user-defined data types will be available here. You can easily navigate to operations on values and references by their data type.
Data Type Manager Built-in, generic, binary-provided, and user-defined data types will be available here. You can easily navigate to operations on values and references by their data type.
![]() Listing The program’s code disassembly and data references are listed here. You can easily explore program logic, references, and address offsets. Special comments and named values generated by the Ghidra loader and analyzer are displayed here as well.
Listing The program’s code disassembly and data references are listed here. You can easily explore program logic, references, and address offsets. Special comments and named values generated by the Ghidra loader and analyzer are displayed here as well.
![]() Decompile This window displays a C language representation of the function selected on the Listing window. This decompilation eases the process of analyzing large and complex assembly code blocks.
Decompile This window displays a C language representation of the function selected on the Listing window. This decompilation eases the process of analyzing large and complex assembly code blocks.
![]() Console – Scripting Results and outputs from scripts and plug-ins are shown here.
Console – Scripting Results and outputs from scripts and plug-ins are shown here.
If you go to Program Trees and double-click the .text memory segment, the Listing window will go to the start of the program’s executable code and provide disassembly code enriched with renaming and comments produced by the previous analysis. It also has intuitive information for exploring and understanding the code, such as addressing, instruction bytecode, commented data operands, labels, conditional branching flow information, and cross-references.
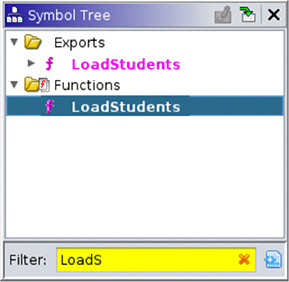
In the Symbol Tree, go to the Filter text input and type LoadStudents to search for this function. Click it to view the function in the Listing window:
The Listing window has an enriched view of the disassembled program code:
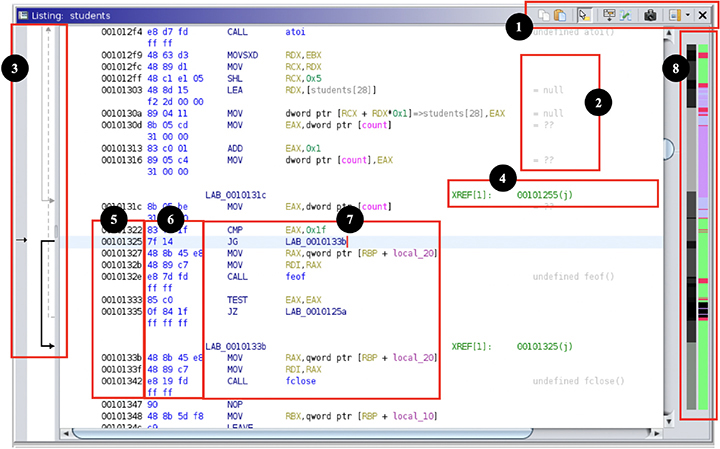
![]() The Listing toolbar provides quick access to copy and paste functions, tooltip preview, listing fields editor, diff view for program comparisons, snapshots, and toggling margin display. You can click Edit the Listing Fields button in the toolbar to customize the default Listing layout.
The Listing toolbar provides quick access to copy and paste functions, tooltip preview, listing fields editor, diff view for program comparisons, snapshots, and toggling margin display. You can click Edit the Listing Fields button in the toolbar to customize the default Listing layout.
![]() Comments make keeping track of your work easier. They are sometimes provided by the analysis for different symbols’ values and operands, but you can add your own by pressing ; (semicolon) or right-clicking the selected address and going to the Comments pop-up menu.
Comments make keeping track of your work easier. They are sometimes provided by the analysis for different symbols’ values and operands, but you can add your own by pressing ; (semicolon) or right-clicking the selected address and going to the Comments pop-up menu.
![]() Flow arrows show you the destination of conditional and unconditional jumps.
Flow arrows show you the destination of conditional and unconditional jumps.
![]() Cross-reference links provide information on where in the program values are being read and written, and where functions are being called or referenced. Double-clicking these links will take the Listing view to the referred address. You can also find references on any address or symbol by pressing CTRL-SHIFT-F.
Cross-reference links provide information on where in the program values are being read and written, and where functions are being called or referenced. Double-clicking these links will take the Listing view to the referred address. You can also find references on any address or symbol by pressing CTRL-SHIFT-F.
![]() Memory Address shows the absolute numeric reference of any code or value you are viewing in the Listing window. You can navigate to any arbitrary address within the open file by pressing G.
Memory Address shows the absolute numeric reference of any code or value you are viewing in the Listing window. You can navigate to any arbitrary address within the open file by pressing G.
![]() Code Bytes is a hexadecimal encoded binary representation of the current instruction.
Code Bytes is a hexadecimal encoded binary representation of the current instruction.
![]() Disassembly code is where you find the disassembled and analyzed instructions with their mnemonics and operands. You can patch and change these instructions by pressing CTRL-SHIFT-G.
Disassembly code is where you find the disassembled and analyzed instructions with their mnemonics and operands. You can patch and change these instructions by pressing CTRL-SHIFT-G.
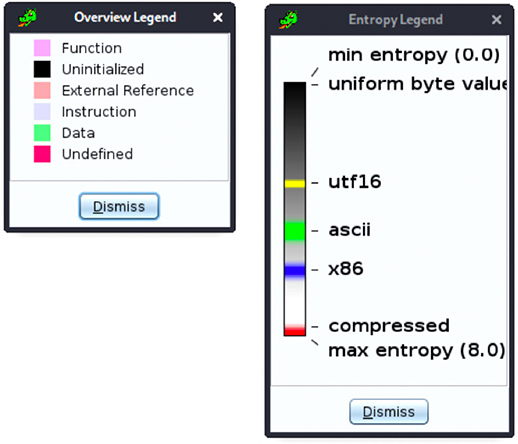
![]() The Entropy Legend and Overview Legend sidebars help you quickly preview and navigate different parts of the program by color coding in grayscale the binary variance and encoding entropy and by providing blocks labeled Function, Uninitialized, External Reference, Instruction, Data, and Undefined. You can view a color-coded reference by right-clicking the sidebar and clicking Show Legend.
The Entropy Legend and Overview Legend sidebars help you quickly preview and navigate different parts of the program by color coding in grayscale the binary variance and encoding entropy and by providing blocks labeled Function, Uninitialized, External Reference, Instruction, Data, and Undefined. You can view a color-coded reference by right-clicking the sidebar and clicking Show Legend.
Search
Ghidra provides search functionality that enables you to search for specific binary patterns, text in program code, symbols, function names, comments, and more. Also, it offers a smart search for specific instruction patterns, scalars, and strings (regardless of their encoding). We will explore some of these functions in the hands-on exercise at the end of the chapter.
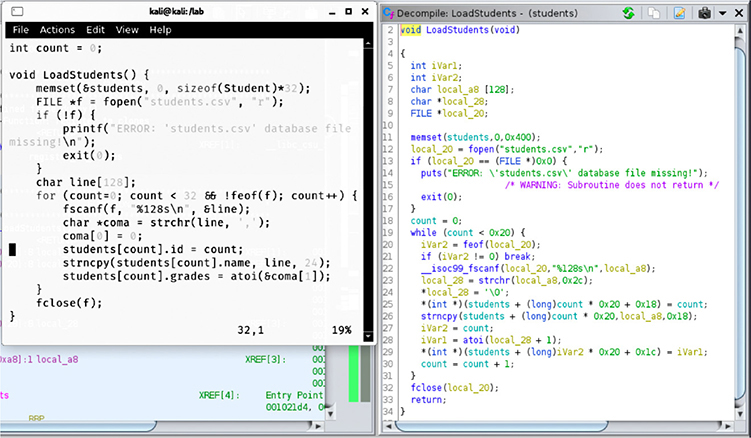
Decompiler
The Decompile feature provides a C language representation of the disassembled code, as shown here:
Although compiled binary code cannot be brought back to source, the decompiler provides a good reconstruction of the logic expressed by the program’s code. This feature is very useful for beginners as well as seasoned reverse engineers because it reduces complexity and improves the readability of the program.
Program Annotations
Annotations help you improve readability, provide clarification, and keep track of the work done on a reversed program. Annotations also affect the resulting decompiler output.
Ghidra provides many types of annotations. Here are some of the most important ones:
• You can use special annotations in comments as format strings. These affect the resulting output, specifying values as string addresses, symbols, URLs, and other formats.
• Variable annotations allow you to change a variable’s symbol name, its data type, and its storage locations.
• Label renaming allows changing label and inferred names to more specific ones for better understanding of the code.
• Function annotations can be used to change a function’s name, signature, calling convention, and return value data type.
Graphs
Ghidra provides powerful graph-generating features. Sometimes execution flow and conditionals can become messy, and without graphs, understanding some code might seem an impossible task. Graphs consist of vertices (or blocks) and edges (or control flow), and they can help you understand the branching, control flow, loops, references, and even the correlations between functions and labels in the program.
There are two types of graphs:
• Flow graphs Display the flow (fall-through and unconditional jumps) between selected blocks of code.
• Call graphs Display the sequence of calls between functions.
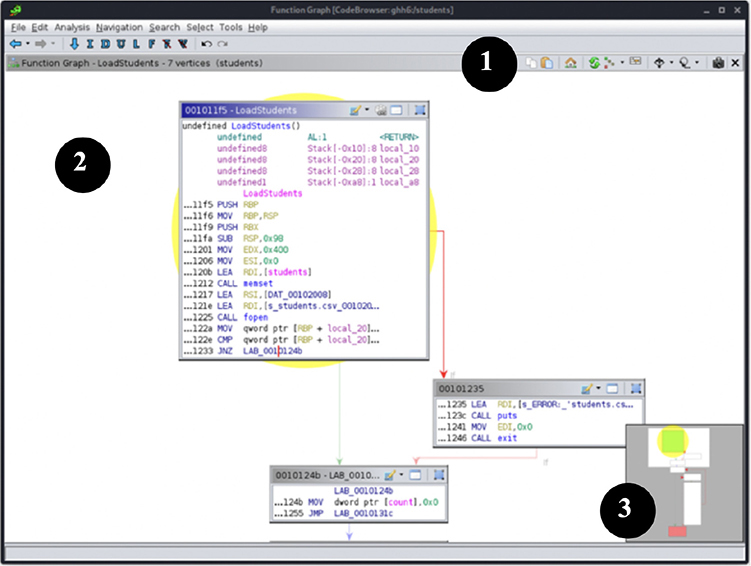
You can generate a graph of the selected code or functions by going to the Graph menu and selecting the desired graph. The Graph menu provides the following tools:
1. Toolbar Allows quick access to setting and refreshing the display of graphs and other options.
2. Graph view All blocks (vertices) and flow (edges) are displayed here for easy navigation, grouping, and inspection. You can pan by dragging the mouse, and you can zoom in and out with the mouse scroll wheel or trackpad.
3. Satellite view Helps you quickly navigate through the graph by showing a small map of all graphed blocks.
You can also export graphs to many graphic and data formats, such as CSV, DOT, GML, JSON, Visio, and others.
Lab 4-1: Improving Readability with Annotations
For beginners, a very frustrating and cumbersome part of reverse engineering is not having a clear idea of what various parameters and data values mean. This lack of context on different register value settings, memory offsets, pointer references, and function arguments can be overcome with proper use of data types.
As you might already know, the runtime for computer architectures is agnostic of data types, which are only relevant to the software developer during programming time and are used by the compiler to correctly assign memory allocations, structure member offsets, array indexes, and other settings during compile time.
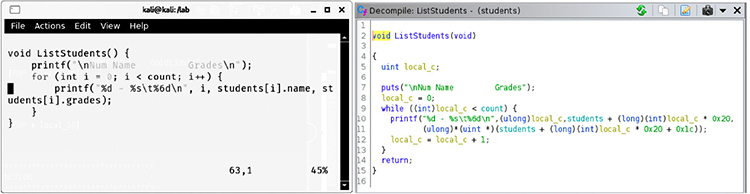
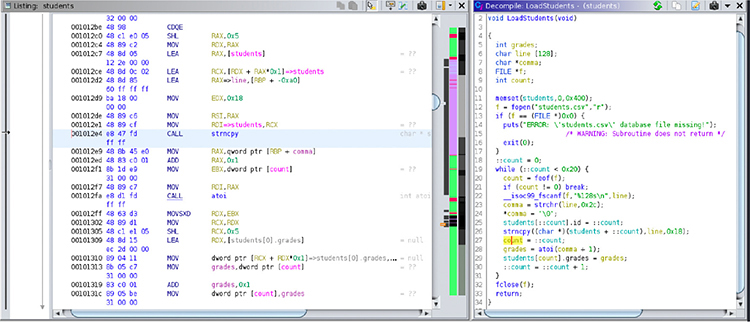
If we compare the original code with the default decompile view for the LoadStudents function, shown next, we might not find the decompile feature as useful as it can be. We will proceed to improve the students program readability by assigning data types to values in the main function.
The source code shows a for loop incrementing a counter variable by 1 on each iteration that’s used as an index for the students global variable, which is an array of our defined type Student. Prior to annotation, the decompiled C representation of the corresponding assembly code will show the index counter variable multiplied by 0x20 (which is the size for the Student data). Also, given that the decompiler is still unaware of the data types for each variable, every value reference will be type-casted, thus complicating source code readability even more.
We can easily improve readability by setting variables with their correct data type annotations and renaming the variables. Let’s pretend we don’t have the source code so that we can experience the most common scenario expected during real reverse engineering. Follow these steps:
1. Go to the LoadStudents function by searching it on the Symbol Tree view, and then go to the Decompile window to make some annotations. We will change variable names, data types, and function signatures based on the operations and functions they are related to in the code.
2. Based on the way the variable is dereferenced and being set at offsets of 32 (0x20) multiplied by count index variable, we know it is an array. Some values near the offset are being set, as shown next:
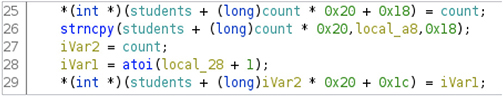
• On line 25, an integer value is dereferenced at 24 (0x18) bytes from the offset (count * 32), so it’s safe to assume it is a pointer to an integer value (int *). The name should be “id,” as it is being set from the counter index variable.
• On line 26, the strncpy function is copying a string corresponding to the student’s name read from the CSV file into the base offset (count * 32), so it’s a character array of unknown size. However, we can guess it’s 24 bytes because it’s where the previous value offset is, and it shouldn’t overwrite a member of its own structure (char [24]). We’ll call this structure member “name.”
• On line 28, the iVar1 is being set from the atoi function called on the grades value in the CSV, which returns an integer, and then it is set at offset 0x1c from the base offset (count * 32). Therefore, let’s assume this is an integer as well. This is the student’s structure “grade” member.
3. Now we can define our custom Student structure data type for the elements in the students array. Go to the Data Type Manager window, right-click the “student” program data types, select the New submenu and click the “structure” item.
a. Name the structure Student and set its size to 32 bytes.
b. Go to the first row on the table (offset 0), double-click the DataType field, and type char[24]. Then double-click the Name field and type name.
c. In the second row (offset 24), set the DataType field to int and set the Name field to id.
d. Repeat the same thing on the third row (offset 28) and set the Name field to grades.
e. If your Structure Editor window looks like the one in Figure 4-2, click the Save icon and close the window. The structure is now ready to be used.
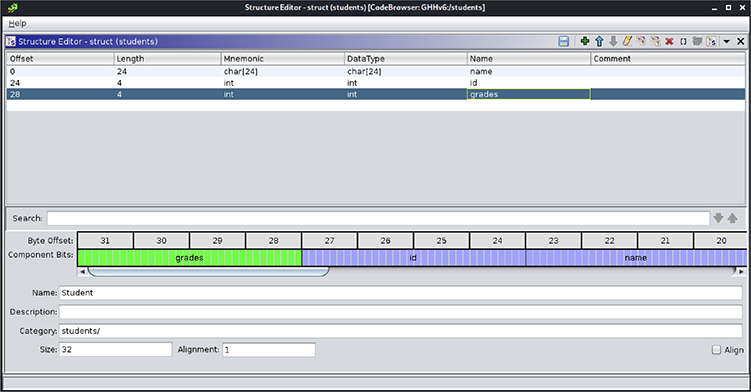
Figure 4-2 Structure Editor window showing the structure to be used
4. Place the cursor over any instance of the students global variable and press CTRL-L to change its data type from undefined[1024] to Student[32] (our struct has a size of 32, and 1024 divided by 32 equals 32).
5. Change the rest of the variables and functions based on their context. For instance, the local_20 variable is being set as the result of an fopen function; therefore, it should be set as a FILE * data type, and its name should be something like fh.
a. Press CTRL-L to change its type to FILE *.
b. Select the variable name and press L, or right-click and then select Rename Variable to change the variable name to fh.
c. To avoid casting the call to fopen, right-click the function, click Edit Function Signature, and, if needed, change the function signature to set its correct calling argument and return data types.
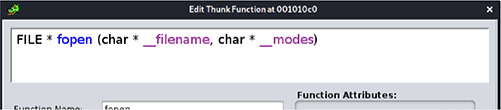
If you are unsure about the signature of standard functions, use the programmer’s manual by running man 3 fopen in a terminal window.
After completing this process, you should notice that the readability of both the decompiled and listing disassembled code is greatly improved, as shown next. Also, every other function referencing the annotated variables, functions, and data types will benefit from this effort.
Lab 4-2: Binary Diffing and Patch Analysis
When vulnerabilities are discovered and reported, vendors proceed to patch their products and publish their updates. Sometimes the update’s change log is limited in detail regarding the patched bug, and in order to understand the changes and develop exploits, binary diffing becomes necessary.
This lab will walk you through the process of discovering a vulnerability affecting the students grades management tool by means of binary diffing. The vulnerability should be easy enough to spot by simply inspecting the code, but, again, we will pretend we only have access to the binary files to better simulate a real-world scenario.
Setup
Ghidra provides a code difference feature that enables you to compare the difference between two binaries with the same address layout and position. This is useful for binary patched comparisons with a one-to-one offset correlation, but it doesn’t correlate code in terms of context and execution flow.
Fortunately, we can extend Ghidra’s capabilities by installing plug-ins such as BinDiffHelper1 for the excellent BinDiff tool. To do so, follow these steps:
1. Install the Gradle build automation tool, version 6.5, by running the following commands:

2. Clone and compile the BinExport2 plug-in from the official repository. This plug-in automates the BinExport difference database-generation process:
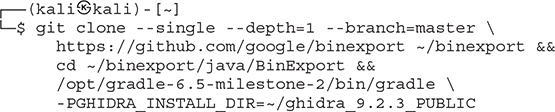
The compile process could take a few minutes. Once it is done, a BinExport plug-in ZIP file should have been created inside the ~/binexport/java/BinExport folder.
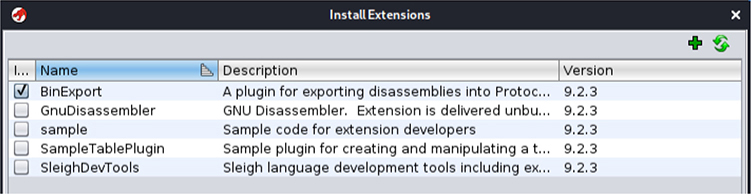
3. On Ghidra’s project window, go to the File | Install Extension menu and click the plus sign (+) icon to add the plug-in’s ZIP file to the ~/binexport/java/BinExport/dist folder, as shown next:
4. Click OK and restart Ghidra so that the plug-in changes are applied.
5. In a terminal window, download and install BinDiff v6 from the official site3:

Installation of the .deb package will prompt you for the IDA Pro path. Leave this empty to specify we are interested in the experimental Ghidra extensions.
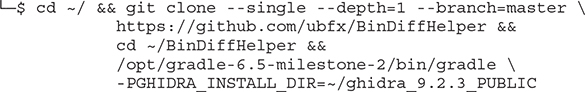
6. Clone and compile the BinDiffHelper plug-in from the official repository:
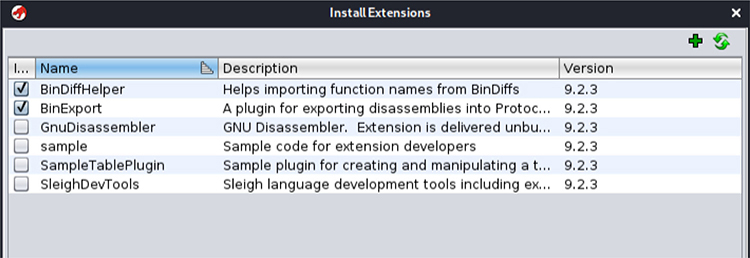
7. On Ghidra’s project window, go to the File | Install Extension menu and add the plug-in’s Zip file to the ~/BinDiffHelper/dist/ folder, as shown next.
8. Restart Ghidra so that plug-in changes are applied.
Binary Diffing
Now that the plug-ins have been installed, let’s continue the lab by exploring the binary diffing process:
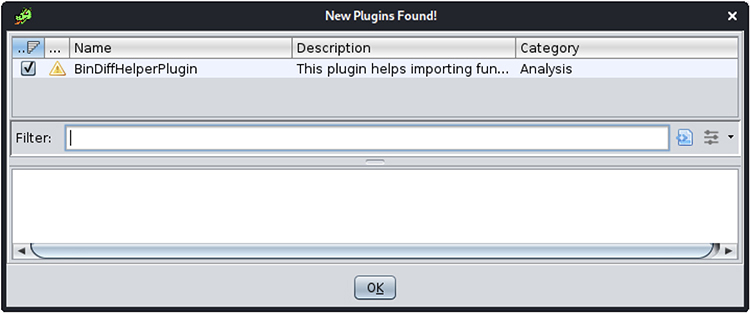
9. Open the students-patched program file. You will be prompted that new extensions have been detected:
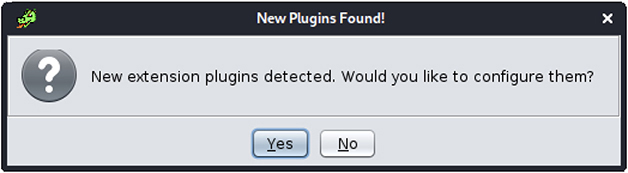
Select Yes to configure the new plug-ins, and in the next window, click OK:
10. Run Auto-Analyze and save the project.
11. Repeat steps 9 and 10, but this time with the students program file.
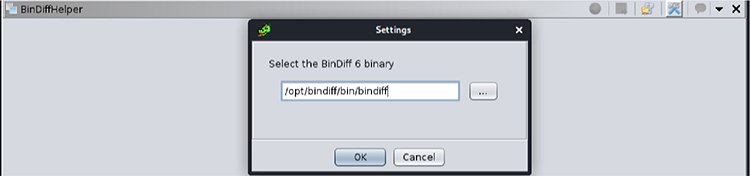
12. Open the Window/BinDiffHelper plug-in window. Click the configure icon to set the correct BinDiff 6 binary path (/opt/bindiff/bin/bindiff), as shown next:
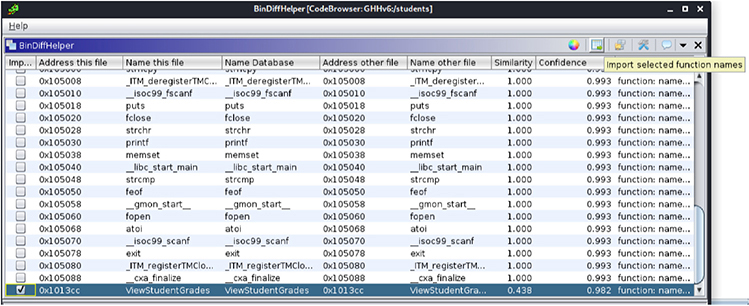
13. Open the students-patched program by clicking the “Open a file for comparison” icon. You should now see Similarity and Confidence scores for each function. Go to the ViewStudentGrades function at the bottom, select the import checkbox, and click the “Import Selected Function” icon.
Patch Analysis
The tool has revealed differences between the programs on the ViewStudentGrades function, as shown next:
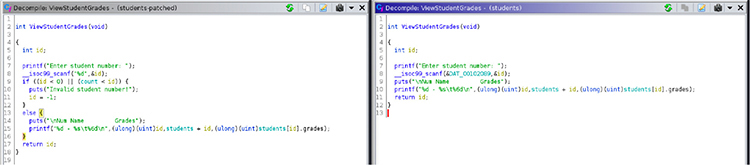
A quick inspection of the decompilation of both versions’ functions reveals there was no boundary checks for the students array index when parsing the user’s input with the atoi function. That means we can select any positive or negative index number, allowing us to treat any 32-byte-aligned address as a Student data structure.
The “Change grades” option allows for changing students’ grades if the correct password is set. It turns out that we can use this vulnerability to our favor. If we go to Windows | Symbol Table and search for the admin_password symbol, we’ll notice it is located at offset 0x001040a0. That is exactly 64 bytes before the students array base address (0x001040e0).
What would happen if we use the “View grades” option and select student number -2?
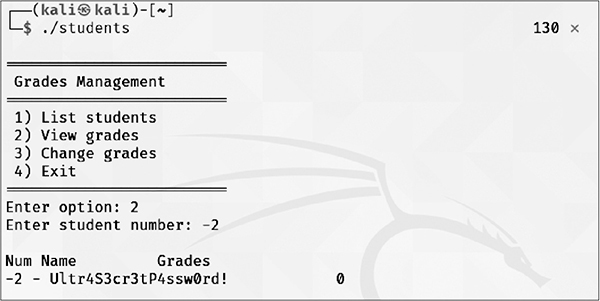
As you can see, treating admin_password’s memory as a Student structure type variable will end up having the password exactly on the structure’s “name” position. We have found a read exploitation primitive and can now read 24 bytes from any 32-bytes-aligned memory value.
But that’s not all. Notice how we control the index value and grades member value for the students structure in the ChangeStudentGrades function. That means we can write 4 bytes at any location 28 bytes from any 32-bytes-aligned memory address.
Summary
In this chapter, we covered basic Ghidra features and functionality to get you started, leaving the door open for you to explore more advanced topics. We looked at topics such as the Ghidra interface, improving readability with annotations, and how to use Ghidra for binary diffing and patch analysis. Take the time to explore other powerful and advanced Ghidra features, such as automating reverse engineering tasks with Ghidra scripts and the endless possibilities its plug-in system allows.
For Further Reading
Ghidra’s Embedded Help Press F1 or click Help on any menu item or dialog.
Ghidra’s Wiki ghidra-sre.org/CheatSheet.html
Recon MTL 2019 (by ghidracadabra and emteere) github.com/NationalSecurityAgency/ghidra/wiki/files/recon2019.pdf
Black Hat USA 2019 (by Brian Knighton and Chris Delikat) github.com/NationalSecurityAgency/ghidra/wiki/files/blackhat2019.pdf
References
1. BinDiffHelper, https://github.com/ubfx/BinDiffHelper.
2. BinExport, https://github.com/google/binexport.
3. zynamics BinDiff, https://www.zynamics.com/bindiff.html.