
CHAPTER 9
Introduction to Threat Hunting
In this chapter, we cover the following topics:
• Threat hunting basics
• Normalizing data sources with OSSEM
• Data-driven hunts using OSSEM
• Hypothesis-driven hunts using MITRE ATT&CK
• The Mordor project
• The Threat Hunter Playbook
What is threat hunting? Threat hunting is based on the assumption that an adversary is already in the network and you need to track them down. This is a topic that requires quite a bit of knowledge about (1) how adversaries operate and (2) how systems operate normally and when under attack. Therefore, this is a topic that cannot be covered fully in this chapter. However, we aim to give you an overview of the basics, from which you can expand over time.
Threat Hunting Basics
Threat hunting is a systematic process of hunting for an adversary who is already in the network. We are talking about a breach that has already started, and the goal is to shorten the amount of time the attacker can dwell in the network. Once the attacker is discovered, a proper incident response can be applied to remove them from the network and restore operations back to normal. Therefore, threat hunting is not incident response, although in many ways they work together and may often be composed of people with the same skill sets. However, ideally, there is a separate threat hunting team that hunts full time for any adversaries in the network. In a budget-constrained organization, a hunter may switch hats after an adversary is discovered and perform incident response functions. Likewise, a threat hunter is not a penetration tester. Again, the two may have similar backgrounds and skill sets, but the mindset is different. A penetration tester is seeking ways into and across a network to discover vulnerabilities and get them fixed, before an adversary finds them. The threat hunter assumes a breach has already occurred and is more focused on finding the trail of an adversary and detecting them once inside a network than they are focused (initially) on how the adversary got there.
Types of Threat Hunting
There are several types of threat hunting, include the following:
• Intel-driven hunts
• Data-driven hunts
• Hypothesis-driven hunts
Intel-Driven Hunts
Intel-driven hunts are guided by cyberthreat intelligence and the indicators of compromise derived from open and closed source intelligence. For example, a file hash may be an indicator of compromise, and it’s worth checking for the existence of that file across the environment. Further, the tactics, techniques, and procedures (TTP) of particular threat actors are of interest to any threat hunter, and these are often found in intelligence reports and from information shared by others. However, we will not focus on this type of hunting, as the techniques deployed are used in the other, harder scenarios.
Data-Driven Hunts
Data-driven hunts are performed by searching for anomalies in the mounds of data within an organization. The best way to perform these types of hunts is by using an analytic platform, such as Splunk or Elasticsearch, to cut through the haystacks of data, looking for the needles. Further, the traditional Security Information Event Management (SIEM) device is a valuable starting point for data-driven hunts. However, a threat hunter will likely outgrow the capability of even the best SIEMs available, particularly when they start to perform inner and outer joins on disparate data sources, including unstructured data sources, which is difficult if not impossible for most SIEMs. We will explore data-driven hunts in this chapter.
Hypothesis-Driven Hunts
As you will recall from Chapter 1, at the top of the pyramid of pain is the TTP of an adversary. The behavior of an adversary is the most difficult thing to discover. The good news is that adversaries often repeat what works, and it is that repetition that gives us a clue as to what to look for with a given adversary group. The MITRE ATT&CK framework is the collection of many known (public) TTPs and has even been used to indicate certain advanced persistent threat (APT) groups’ activities. Using this framework as a source, we can use our imagination and build a hypothesis of an adversary’s actions within a network. Any hypotheses may be then tested; first by ensuring we have the proper data sources to see the target behavior and then by building analytics to search for that behavior in a given network environment. Finally, we can build alerts to let us know when that behavior happens in the future. In this way, we can methodically work our way through the MITRE ATT&CK framework, building a coverage map as we go. One key concept at this point is to recognize that we will often be starting in the middle of the framework, as we are assuming compromise to start with. Then, if we discover signs of a hypothesis being true, we can work in both directions across the framework: (1) to work forward and find the ultimate depth of the penetration and risk to the environment, and (2) to work backward to find the source of the breach and to close that hole going forward. We will explore this type of hunting later in this chapter as well.
Workflow of a Threat Hunt
The basic workflow of a threat hunt is as follows:
1. Perform a data source inventory, gap assessment, and remediation effort.
2. Determine the type of hunt to perform and the search criteria.
3. Ensure you have the data required to satisfy the search criteria.
4. Perform the search.

TIP Emulate the threat as well as ensure the search and data are what’s expected, before relying on the search results more generally.
5. Check results. If attacker behavior is found, continue investigation and notify the incident response (IR) team.
6. If attacker behavior is not found, return to the top. Then rinse and repeat.
That’s it. Sure, you will need to learn a lot during this process about how your operating systems in your environment work, how log data is generated, transmitted, and stored, and how an adversary moves through a network, particularly when they look like a normal user, but that is all part of it. It will take a while, maybe even years, before you become proficient at threat hunting. So let’s begin now!

NOTE It is important to realize that becoming a threat hunter is a journey that will take years before you can consider yourself an expert. We will strive to show you the basics in this chapter and equip you with the tools to hone your craft, over time. However, there is no substitute for you putting in your 10,000 hours, which is true for topics covered in the rest of this book as well. So, this chapter is not intended to be an exhaustive source or explanation of threat hunting. It would take an entire book to do that (see the “For Further Reading” section for a good one). For those with experience in threat hunting, we hope you find a few new tips in this chapter, but it is really aimed at those new to the topic.
Normalizing Data Sources with OSSEM
We will start by discussing data sources, the need for normalizing logs from various data sources, and the Open Source Security Event Metadata (OSSEM) project and tools that aid in that process. As discussed previously, the first step in any threat hunt is understanding your data sources and then performing a gap analysis and remediation project if you are missing data. Likely, as you progress, you will find out you are missing key data, and you can adjust further as you go.
Data Sources
The problem with data is that each device, operating system, and application (source) produces logs in a different format. To make matters worse, some vendors, such as Microsoft, have several forms of logging; therefore, depending on what you are seeking, the data may very well be in a format that’s different from the other logs from that vendor. For example, Microsoft stores logs in Event Viewer (EVT), exposes API-level access to kernel-level logs via Event Tracing for Windows (ETW), and may forward logs via Windows Event Forwarding (WEF) servers. Further, Microsoft provides a tool, Sysmon, that provides system-level logs for processes, files, and network activities in a lightweight manner.1, 2 Each of these logging methods, to mention just a few, provide a different format. So, how are we to normalize those log sources, and the hundreds of other sources, into a searchable and scalable format?
OSSEM to the Rescue
The Open Source Security Event Metadata (OSSEM) Project comes to the rescue.3 The brothers Roberto and Jose Rodriguez created the OSSEM Project to help researchers share data and analytics, in a standard format, so the field could move forward faster, not losing time translating security relevant log formats. As mentioned several times in this chapter, we owe the Rodriguez brothers a debt of gratitude for all they have provided to those of us in this field.
The OSSEM Project is split into three parts:
• Common Data Model (CDM) Provides for a common schema of data, using schema entities and schema tables to allow for the abstraction of logs (for example, when discussing network logs, the HTTP, Port, and User-Agent entities have been defined).
• Data Dictionaries (DD) Collections of CDM entities and tables that define a particular event log. Many common log formats have been defined, and you are free to define your own.
• Detection Data Model (DDM) A collection of data objects and relationships required to define attacker behavior, such as mapping the MITRE ATT&CK framework to logs. Much work has been done here to complete a great deal of the framework (note that your participation and contributions are welcome4).
Together, the components of the OSSEM enable our data-driven and hypothesis-driven threat hunting. As you will see in a moment, we can rely on this tool to speed up our analysis and not get bogged down in log formats, field names, and so on. Using OSSEM is a real time-saver.
Data-Driven Hunts Using OSSEM
First, we will use OSSEM to perform a data-driven hunt. We will start by providing a refresher of the MITRE ATT&CK framework, visualizing the data using OSSEM, and then diving right in and getting our hands dirty hunting.
MITRE ATT&CK Framework Refresher: T1003.002
You will recall the MITRE ATT&CK framework from Chapter 1. In this chapter, we will apply it to hunt for adversarial behavior. To start with, we will take a look at sub-technique T1003.002, OS Credential Dumping.5 This sub-technique describes how an adversary may extract credential information from the Windows Security Account Manager (SAM), either from memory or from the Windows registry, where it is stored. The SAM is a big target for attackers, for obvious reasons: it contains the local credentials for the host.
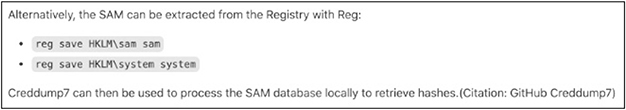
As explained in the framework, a number of automated tools may be used to grab the SAM, or a simple command from the administrator’s command-line window will suffice:
reg save HKLMsam sam
reg save HKLMsystem system
Let’s take a look at what OSSEM tells us about this sub-technique.
Lab 9-1: Visualizing Data Sources with OSSEM
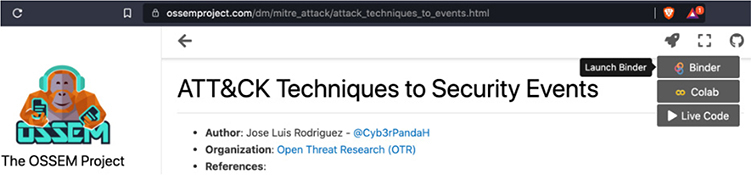
Start by visiting https://ossemproject.com/dm/mitre_attack/attack_techniques_to_events.html.
Then, hover over the rocket ship (launch) icon on the upper-right corner of the site and click Binder to launch a Jupyter notebook, for free, on the Binder site.
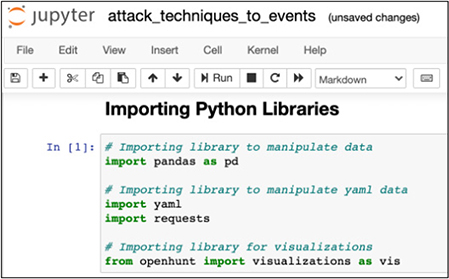
This Jupyter notebook allows for live, interactive processing of Python, and all the associated libraries, from the convenience and safety of your browser. It will take a moment to load up (it’s free after all, thanks to the generous donations of those listed at the top of the site page). When it loads, you will see the following screen. Click in the gray block of code and then click the Run button at the top or press SHIFT-ENTER to process that block of code.
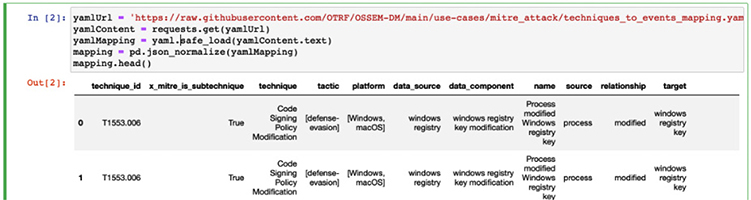
Go ahead and execute the next block of code as well. It will take a while to run, as the MITRE ATT&CK techniques are pulled and parsed. While it is running, you will notice an asterisk in brackets ([*]) on the left side of the block of code. When it completes, the asterisk will turn into a number representing the block of code. The head() command will show the first five items in the mapping, starting with 0, as shown next:
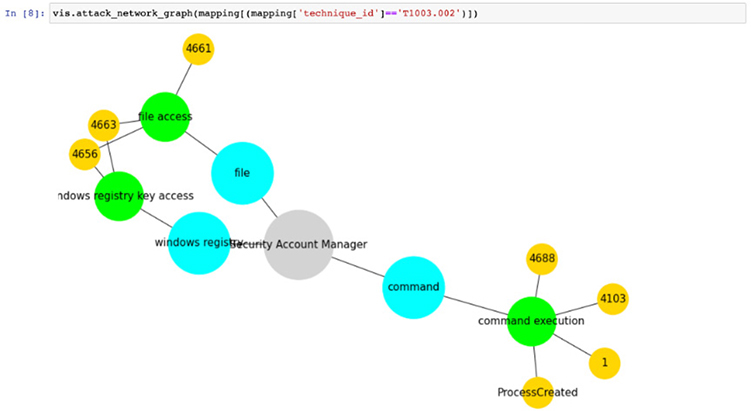
After a short wait, you can continue by executing the next block(s) of code (each explained by a heading and text prior to the block), which uses OSSEM to show the data sources and components of the T1003.002 sub-technique. Adjust the code to test for T1003.002, as shown next. This is the beauty of Jupyter notebooks: they are dynamic and you can experiment with them to learn.
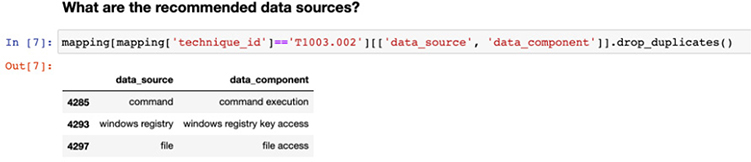
Here, we can see the command, registry, and file data sources are useful in detecting command execution, Windows registry key access, and file access, respectively.
Now modify the next block of code to once again represent the T1003.002 sub-technique.
Now we see the event IDs used to find activity associated with the T1003.002 sub-technique. This is powerful, as you now can get to hunting with this data without worrying about the other event IDs. You have three paths to search for this activity: files, Windows registry, and command-line logs.
Execute the next command and scroll to the right of the data window to see the details of the graphical data. You will need to modify the code in the block, as shown next, for T1003.002:
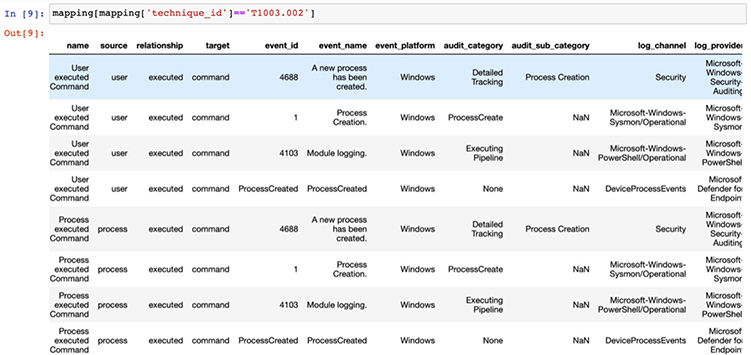
On the right side of this list are log channels and their associated log providers (sources). So, for example, we can see that when looking for the command execution route of this attack, we can hunt for event IDs of 4688 and 4103 for command line and PowerShell execution, respectively. These event IDs are fired when either a user or process performs command execution, so we are covered when the attacker types at a command line or executes scripts that launch processes to execute the commands—which is good. We also notice that Sysmon logs include an event ID of 1 for this activity. It turns out that event ID 1 is associated with all process creation and is less specific in this case, so we will stick with the other two event IDs.
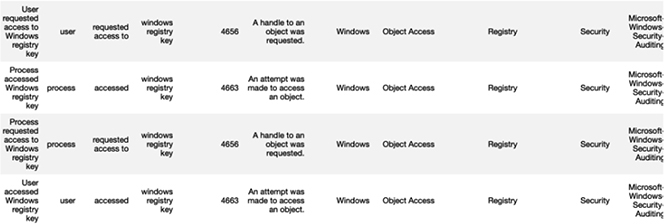
Scrolling down a bit, we see similar data for the techniques that directly access the SAM from the registry:
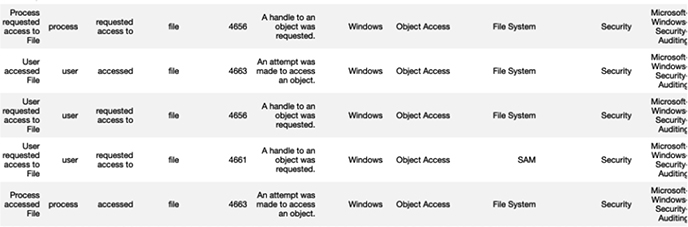
And even further down, we see data from the techniques that are associated with direct file access to the SAM object:
Now, let’s learn another technique to emulate attacker behavior in order to practice finding it in the logs. Cyber threat emulation (CTE) is a force multiplier and really accelerates your learning.
Lab 9-2: AtomicRedTeam Attacker Emulation
Let’s turn our attention to the AtomicRedTeam scripts to emulate the MITRE ATT&CK T1003.002 (SAM) attacks. Using the same lab setup from Chapter 8, “cd” into the c:ToolsAtomicRedTeamatomicsT1003.002 folder on the Windows 10 host.

NOTE If you don’t see a c:Tools folder, then you likely had an issue during the install; in that case, go to your host system and, from your administrator PowerShell window, run vagrant provision win10. The same is true with the DC and WEF servers. Further, if a lab in this chapter hangs, you may need to restart through vagrant halt system name, then vagrant up system name. If this happens a lot, consider adding more RAM or running from the cloud (with more RAM). The labs worked as demonstrated on Windows 10 hosts, but your mileage may vary on other operating systems.
Also, from a web browser, open the following URL:
https://github.com/redcanaryco/atomic-red-team/blob/master/atomics/T1003.002/T1003.002.md
Scroll down to see how the AtomicRedTeam tool will emulate the attack, or you could type these commands manually. Do they look familiar? They should, because these are the same commands we saw on the MITRE ATT&CK framework page.
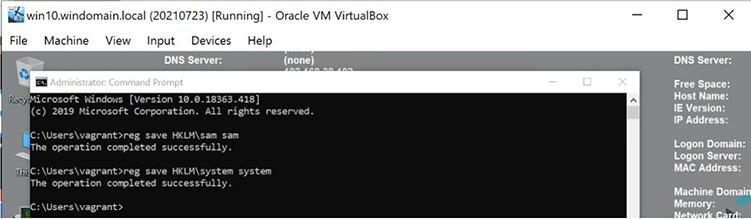
Now, from your administrator command-line prompt (on a Windows 10 host), type the commands shown in the previous illustration to manually simulate an attacker.
Now, open your Kibana dashboard (from last chapter). Next, let’s add a column to our Kibana results list by finding #event_id in the left-side panel’s search box and clicking the Add button.
From now on, you will have event_id as a header on the top of the search results list. Refresh the page to see it.
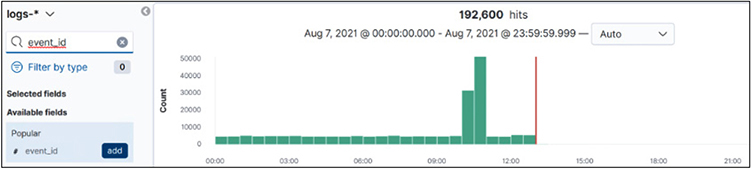
Next, search for the command “reg save HKLMsam”. Note that you have to use quotes to escape the backslash. Ensure you click the calendar and then select Today:
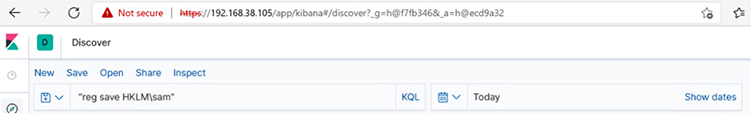
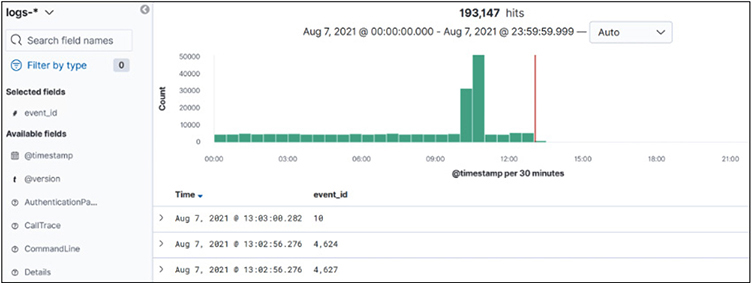
You should see the following search results:
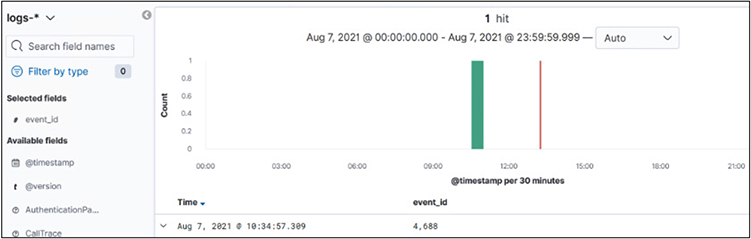
We see the event ID in the search results as 4,688 (disregard the comma). Recall from the OSSEM diagram shown earlier that this is one of the expected event IDs for command execution. This is a key learning point: we found the “event_id” this time by searching for a very specific attacker technique. Going forward, we will work in the other direction.
By expanding that log and scrolling down a bit in the log results, we see the actual command line the attacker typed in, as expected:

Obviously, this is a basic example in a clean test environment, but don’t worry. Next, we will ramp it up.
Exploring Hypothesis-Driven Hunts
Now that we have seen a data-driven threat hunt, let’s explore a hypothesis-driven threat hunt.
Lab 9-3: Hypothesis that Someone Copied a SAM File
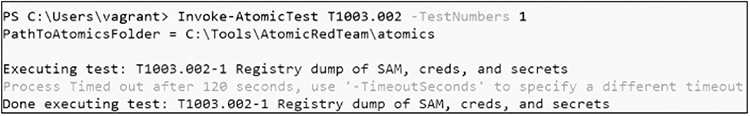
In this lab, we will pursue (hunt) based on the hypothesis that someone copied a SAM file within our domain. To speed up the learning cycle, we will use the automated test functionality of AtomicRedTeam tools, called Invoke-AtomicTest, to run the test in a consistent manner and save us all the typing involved with the attacks.
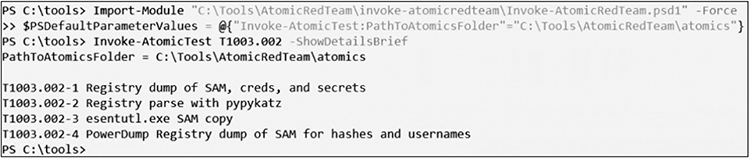
From an administrative PowerShell window on the Windows 10 host, set up the environment using the following command (copy/paste from https://detectionlab.network/usage/atomicredteam/).

Next, invoke the test, using either a single test, multiple tests, or the full test sequence for T1003.002, as shown in the following code. The -ShowDetailsBrief argument will show the test actions, but not perform them, so it is a good idea to do this first.
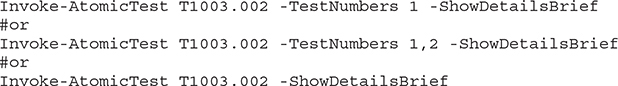
The following image shows the entire test sequence for the last command:
Great! Now, launch the first command (test 1), without -ShowDetailsBrief, to execute the attack, as shown next:
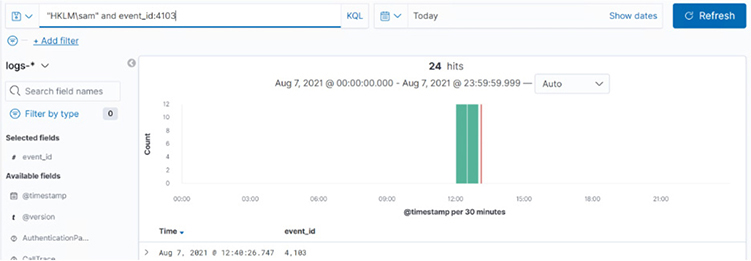
Since we already know there are three ways the SAM file copy can be detected—command, file, and registry (see the diagram and tables that follow it in Lab 9-1)—we can use this information to start hunting. We recall that the event IDs of 4688 and 4103 are indicators of command execution. Since we already looked at 4688, let’s search this time for 4103. Open your Kibana console and search for “HKLMsam” and event_id:4103, and you should see some hits, as shown next:
Take a moment to familiarize yourself with the log output; in particular, look at the Payload field. Expand the log and scroll down to see details, as shown here:
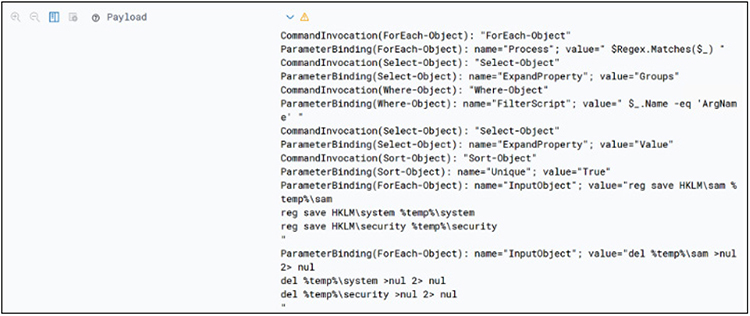
Now you know what a PowerShell payload looks like in log format. If you try this in your production network, you would search for the same logs, but without the date constraints.
Crawl, Walk, Run
So far in this chapter, you have learned to crawl (manually) and walk (with automated scripts by AtomicRedTeam). You have the basics of threat hunting down, but only for one MITRE ATT&CK sub-technique. In order to walk faster, you have to practice now with other techniques, working your way through the MITRE ATT&CK framework by ensuring you have the correct data sources, emulating the attack, and then learning how to identify it in logs. Increasingly, over time, you will gain experience and most importantly learn more about how Windows logs work.6 For extra credit, pursue the file and registry access for T1003.002, shown at the end of Lab 9-1.
Take a moment to work through a few more examples using the AtomicRedTeam scripts.7 When you are ready to start jogging, continue on in this chapter.
Enter Mordor
In this section, we will use the Mordor datasets8 we installed in the last chapter and start jogging as threat hunters. In order to pick up the pace, we will use the prerecorded attacker data, captured in the summer of 2020 by Roberto Rodriguez,9 based on the earlier work from the MITRE Engenuity ATT&CK Evaluations report.10 We will load the APT29 attack data, prerecorded by Rodriguez, to simulate the APT29 group in our network from a data perspective. This is powerful, as we can be spared the time to set up and execute all those commands. To learn more about the setup and the actual attack sequence, see the “References” section at the end of this chapter.
Lab 9-4: Hypothesis that Someone Other than an Admin Launched PowerShell
In this lab, we will set out to prove the hypothesis that someone launched PowerShell, other than an admin. Note that this may or may not be malicious, but it is a good place to start. Depending on the size of your network, you may have a lot of PowerShell being used, but you should be able to isolate your administrator users and then detect others who are running PowerShell. By the way, this is a good first step, but ultimately you will want to monitor and investigate all your admin activities as well. After all, if one of them is compromised, the attacker would love to leverage their privilege within the network.
In order to get an idea of all the ways PowerShell may be launched, we return to our OSSEM Jupyter notebook from Lab 9-1. You may need to restart it if it has timed out—it is free after all! Checking the MITRE ATT&CK framework, we see that T1059.001 is the technique for launching PowerShell locally:
![]()
Let’s look at the OSSEM diagram of that technique, as shown next. Get in the habit of doing this.
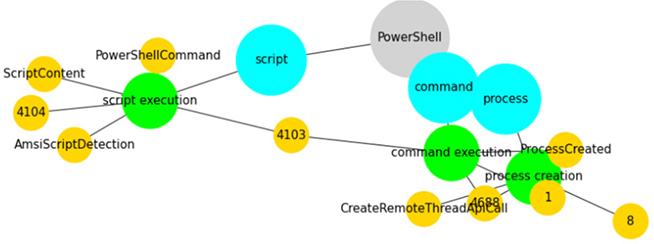
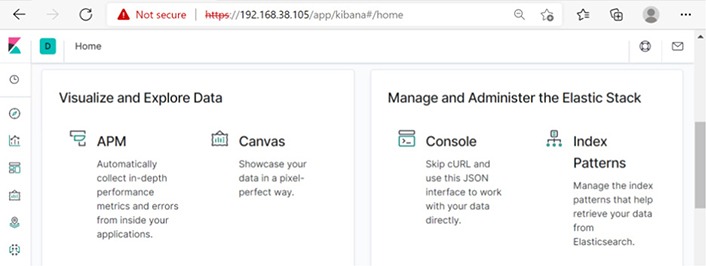
Here, we see several paths to detecting PowerShell execution, through scripts, the command line, and process creation. Since we loaded the Mordor data in the last chapter, let’s create an index. Click the K icon in the upper-left corner of your Kibana portal to go to the home page; then scroll down and click Index Patterns under Manage and Administer the Elastic Stack:
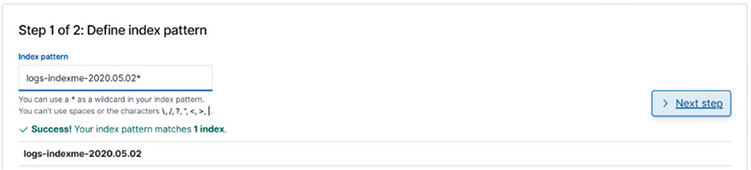
Next, click the blue Create Index Pattern button at the top of the screen:

Type logs-indexme-2020.05.02* in the Index Pattern field and then click the Next Step button:
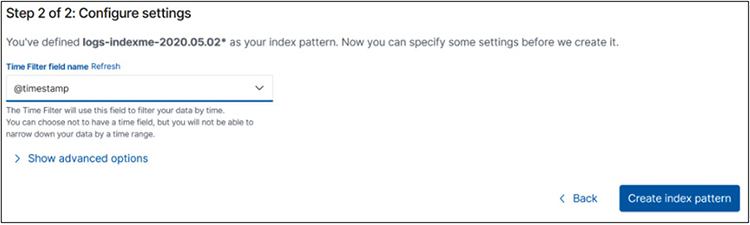
For Time Filter Field Name, select @timestamp and click the Create Index Pattern button:
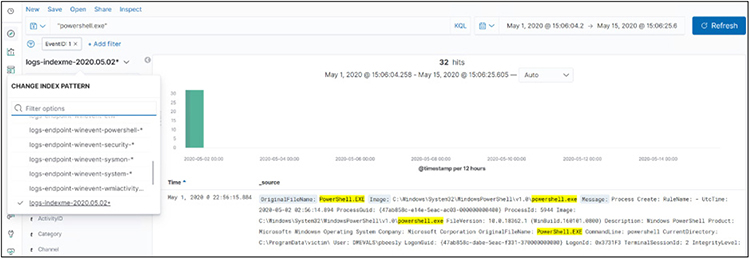
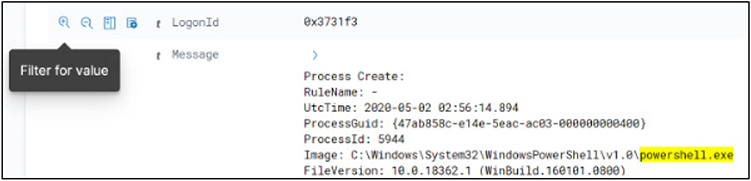
Now that the index is created, you may select it on the left side of the Kibana panel. Then, search for “powershell.exe” with a filter of EventID: 1 and a date range, as shown next:
Now that we have all the powershell.exe logs within our environment, we can filter for a particular indexed field value; for example, we could open (expand) a log and scroll down to LogonID (0x3731f3). LogonID remains steady throughout the session of the user and is useful in tracking their other activities. So, let’s hover over the magnifying glass (with plus sign), as shown next, and then select Filter For Value.
This will add the filter for LogonId: 0x3731f3, showing us the rest of the logs. Next, search for “cmd.exe”, as shown next, to look for command-line activity:
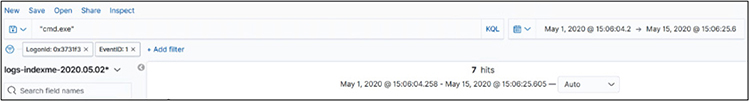
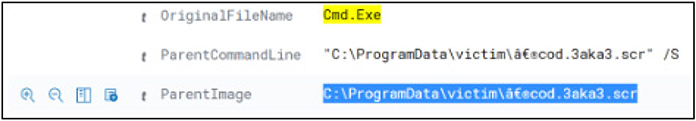
We see seven hits. Scrolling down through the logs, we see a clue: the ParentImage field (the file that was used to create the current process) has an odd name. Looks like a screensaver file.
Now, searching for that filename, we see we have five hits. Scrolling through those logs, we see our user: DMEVALSpbeesly.
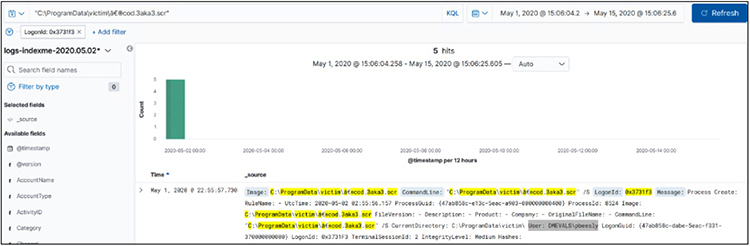
Now we know this user, and she is no admin. She should not be running PowerShell, so let’s keep looking. Adding her username to the query, as follows, we find network connections in the logs:
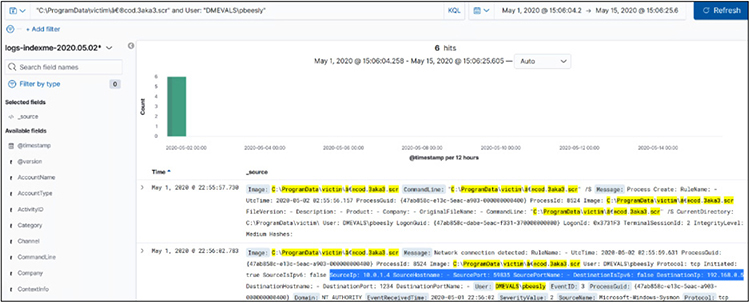
What have we learned? Reverse engineering the attack so far, we have learned that the attacker has done the following:
1. The user DMEVALSpbeesly executed “C:ProgramDatavictim‮cod.3aka3.scr”.
2. That file opened a network connection.
3. That file then opened cmd.exe.
4. Cmd.exe opened PowerShell.
As you have seen, we started with a hypothesis, but in the process, we landed in the middle of the MITRE ATT&CK framework, in the execution phase. Then we worked backward to find the source of the activity and the user and machine. Now, it is likely time to contact the incident response team and work with them to determine the extent of the attack, as we only have the beginning at this point—at least until we get to the next lab!
Threat Hunter Playbook
So far, you have learned to crawl, walk, and then run (well, perhaps jog) in threat hunting. Now let’s learn how to sprint by using the Threat Hunter Playbook by, you guessed it, the Rodriguez brothers.11
Departure from HELK for Now
Up to this point, we have been able to use the DetectionLab environment, augmented with HELK to (1) practice finding isolated attacks with AtomicRedTeam scripts and (2) use the Mordor datasets from Chapter 8 to practice on more comprehensive attack data. Now we have reached the limit of our DetectionLab environment. The reason is one of required resources. You may recall back in Chapter 8 that we selected 4 when installing HELK. That step installed the following items:
![]()
That selection (2) required 5GB of RAM, and that is all we had left after installing the rest of DetectionLab on the prescribed system requirements of 16GB RAM. Now, if you have more than 16GB of RAM available or installed in the cloud (selecting a larger system, such as Standard_D3_v2), then you may select the next level of 3:
![]()
As indicated, this version has Spark and Jupyter, which are required to go further in this chapter. Now, what if you do not have those system requirements and do not want the extra expense of a larger cloud instance? We have you covered, so don’t worry. The rest of this chapter takes advantage of a provision of the Rodriguez brothers, Threat Hunter Playbook, complete with a web-based runtime environment for you to continue learning.
Spark and Jupyter
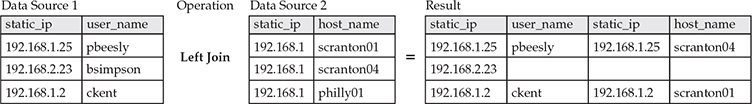
There are several reasons why Spark and Jupyter are required to advance our learning. As good as Elasticsearch is, it is not a relational database, so it turns out that joins are computationally expensive.12, 13 A join is a function common to SQL that allows us to combine data, as part of a query, to be more targeted in our investigations. For example, if we had two data sources, one with static_ip and user_name and the other with static_ip and host_name, we could join them in the following ways.
A left join, returns records from the left source, with matches from the right source:
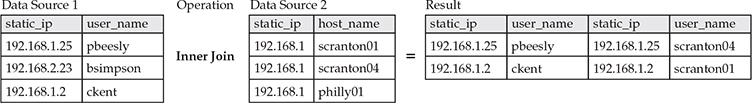
An inner join returns only records with matching values in both left and right sources:
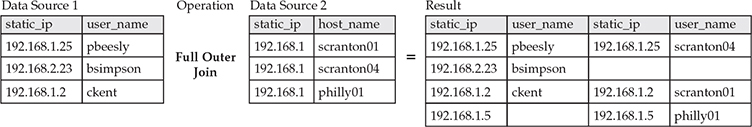
A full outer join returns records when there is a match from either source:
These joins can be performed with Apache Spark, using data from Elasticsearch, which is particularly useful when threat hunting, allowing us to enhance or enrich our data by combining several data sources.14 We will see this play out in the next lab.
Lab 9-5: Automated Playbooks and Sharing of Analytics
NOTE Before we get started with this lab, please understand that we are going to switch learning environments in order to advance our knowledge and capability. Now, in the future, you may switch back to the built-in playbooks, but again, you will need more system resources, as explained previously.
In order to share analytics and provide a more robust training environment, the Rodriguez brothers developed a set of Jupyter notebooks stored on the Binderhub platform.15, 16
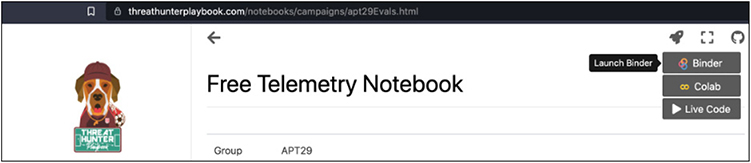
First, visit https://threathunterplaybook.com/introduction.html.
On the left side of the screen, click the Free Telemetry Notebook link. This will load the Jupyter notebook page that has the Mordor dataset and all the analytics ready for you to learn.

Then, click the rocket icon at the top of the screen and launch the Binder link.
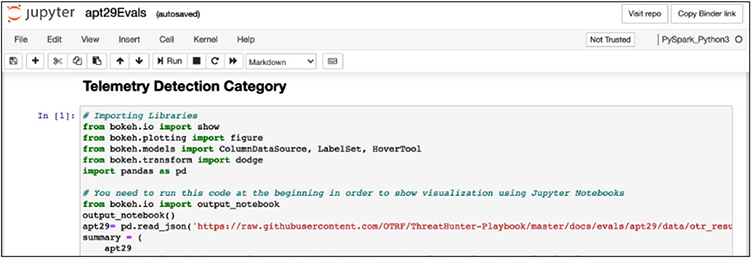
The Jupyter notebook may take a few minutes to launch, but be patient. When it loads, click in the first block of code and then click the Run button at the top or press SHIFT-ENTER to run that block of code and load the required libraries. Remember, some of the steps in this library will take a while. You will see the in-progress symbol, [*], on the left of the code block and a number when it completes. Be sure to let those code blocks complete before moving on.
Be sure to read the text that is displayed above each code block to understand it; then keep clicking the Run button or pressing SHIFT-ENTER to execute the subsequent code blocks until you get to the Decompress Dataset code block. As of the writing of this chapter, there is an error on the notebook when pulling Mordor data, and you have to change the command to the following URL (confirm as below before running this block):
![]()
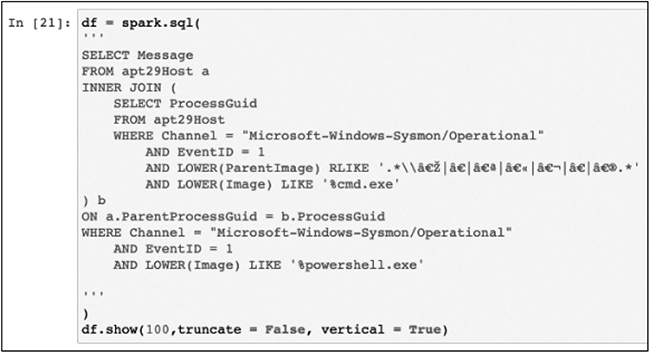
Continue executing the code and comment blocks until you get to the following step:
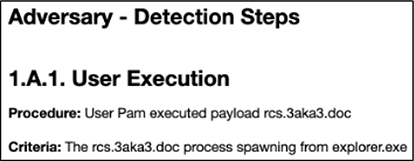
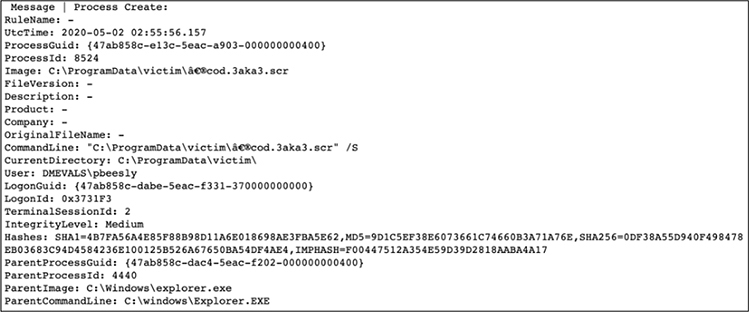
The next block of code you execute is Spark SQL, which selects records from the apt29Host temp view from the Sysmon/Operational channel, where EventID = 1, ParentImage includes “%explorer.exe”, and Image (filename) includes “%3aka3%”. This information picks up from our previous hunt, where we found that Pam clicked a screensaver with this name. Let’s see how deep this rabbit hole goes!
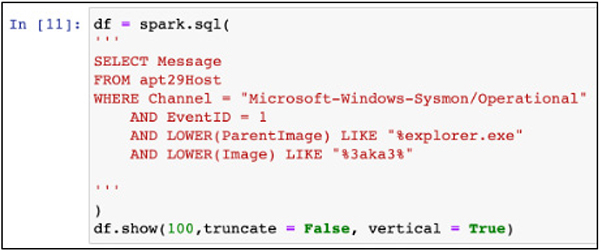
This code returns a record with a log entry as follows:
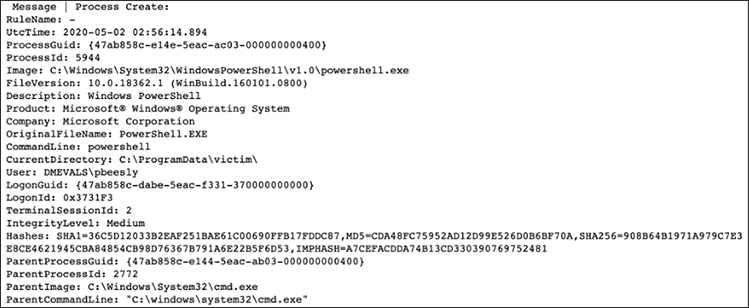
This should be familiar now. Keep going, carefully studying each step, looking over the shoulder of Roberto Rodriguez, who prepared this for you. You will see the network connection we found previously; you will also see cmd.exe launched. It is interesting to see the process in the other direction. Remember we said previously that you will often start in the middle of the MITRE ATT&CK framework and then work left and right to find the adversary. You will find the queries simple, until you get to “1.B.2. PowerShell,” where we have our first join statement.
Remember from earlier that an inner join returns a joined record with matches from both data sources (in this case “a” and “b”), which are defined in the top and bottom of the INNER JOIN statement. The results are three records, one of which is shown here (the data of which we have seen before). Thanks to the join, we see the user ID, the command executed, the parent command line, the logon ID, hash values, and more, all in one view.
You can now see that you can work manually with Elasticsearch, or with the assistance of Apache Spark SQL, to perform advanced join operations. As a homework assignment, keep executing the steps in the notebook to learn even more. Happy hunting!
Summary
In this chapter, we tackled the topic of threat hunting. As stated at the beginning of the chapter, your threat-hunting skills will need to be developed over years of practice, and this chapter helped established the basics. We started with a discussion of data sources and how to normalize the data using OSSEM. Then we moved on to basic threat-hunting processes, including data-driven and hypothesis-driven hunts. We worked through a series of labs, designed to scratch the surface of the skills required and to give you a framework from which to expand your knowledge. Finally, we showed how to extend these skills in a real operational network, beyond your lab.
For Further Reading
Red Canary, Atomic Red Team github.com/redcanaryco/atomic-red-team
MITRE ATT&CK® Navigator mitre-attack.github.io/attack-navigator/
Threat Hunting with MITRE ATT&CK® www.threathunting.se/2020/05/24/threat-detection-with-mitre-attck-and-atomic-redteam/
SANS: Building and Growing your Threat Hunting Program www.sans.org/media/analyst-program/building-maturing-threat-hunting-program-39025.pdf
Valentina Costa-Gazcón. Practical Threat Intelligence and Data-Driven Threat Hunting: A Hands-on Guide to Threat Hunting with the ATT&CKTM Framework and Open Source Tools. Packt Publishing, 2021. www.amazon.com/Practical-Threat-Hunting/dp/1838556370
Threathunting.net www.threathunting.net/reading-list
“Hunt Evil: Your Practical Guide to Threat Hunting” www.threathunting.net/files/hunt-evil-practical-guide-threat-hunting.pdf
References
1. Harisuthan, “Threat Hunting Using Sysmon – Advanced Log Analysis for Windows,” Security Investigation, July 2021, https://www.socinvestigation.com/threat-hunting-using-sysmon-advanced-log-analysis-for-windows/ (accessed August 31, 2021).
2. Roberto Rodriguez, “Categorizing and Enriching Security Events in an ELK with the Help of Sysmon and ATT&CK,” Medium, July 2018, https://posts.specterops.io/categorizing-and-enriching-security-events-in-an-elk-with-the-help-of-sysmon-and-att-ck-6c8e30234d34 (accessed August 30, 2021).
3. “OSSEM – The OSSEM Project.” https://ossemproject.com/intro.html (accessed August 30, 2021).
4. Jose Luis Rodriguez, “Defining ATT&CK Data Sources, Part I: Enhancing the Current State,” Medium, https://medium.com/mitre-attack/defining-attack-data-sources-part-i-4c39e581454f (accessed August 31, 2021).
5. “OS Credential Dumping: Security Account Manager,” MITRE ATT&CK, https://attack.mitre.org/techniques/T1003/002/ (accessed August 31, 2021).
6. Roberto Rodriguez, “Windows – Threat Hunter Playbook.” https://threathunterplaybook.com/library/windows/intro.html (accessed August 31, 2021).
7. Red Canary, “Atomic Red Team,” GitHub. https://github.com/redcanaryco/atomic-red-team (accessed August 31, 2021).
8. Roberto Rodriguez, “Enter Mordor: Pre-recorded Security Events from Simulated Adversarial Techniques,” https://posts.specterops.io/enter-mordor-pre-recorded-security-events-from-simulated-adversarial-techniques-fdf5555c9eb1 (accessed August 31, 2021).
9. Roberto Rodriguez, “Mordor Labs – Part 1: Deploying ATT&CK APT29 Evals Environments via ARM Templates to Create Detection Research Opportunities,” Open Threat Research, June 2020, https://medium.com/threat-hunters-forge/mordor-labs-part-1-deploying-att-ck-apt29-evals-environments-via-arm-templates-to-create-1c6c4bc32c9a (accessed August 31, 2021).
10. C. T. Corp, “Your Complete Introductory Guide to Understanding the MITRE Engenuity ATT&CK Evaluation Results,” CyCraft, June 2021, https://medium.com/cycraft/your-complete-introductory-guide-to-understanding-the-mitre-engenuity-att-ck-evaluation-results-7eb447743b88 (accessed August 31, 2021).
11. “Introduction – Threat Hunter Playbook.” https://threathunterplaybook.com/introduction.html (accessed August 07, 2021).
12. Roberto Rodriguez, “Welcome to HELK!: Enabling Advanced Analytics Capabilities,” Medium, April 2018. https://posts.specterops.io/welcome-to-helk-enabling-advanced-analytics-capabilities-f0805d0bb3e8 (accessed August 31, 2021).
13. Roberto Rodriguez, “Threat Hunting with Jupyter Notebooks – Part 3: Querying Elasticsearch via Apache Spark,” Medium, June 2019. https://posts.specterops.io/threat-hunting-with-jupyter-notebooks-part-3-querying-elasticsearch-via-apache-spark-670054cd9d47 (accessed August 31, 2021).
14. Roberto Rodriguez, “Threat Hunting with Jupyter Notebooks – Part 4: SQL JOIN via Apache SparkSQL,” Medium, May 2019, https://posts.specterops.io/threat-hunting-with-jupyter-notebooks-part-4-sql-join-via-apache-sparksql-6630928c931e (accessed August 31, 2021).
15. “Welcome to HELK!: Enabling Advanced Analytics Capabilities,” op. cit.
16. Roberto Rodriguez, “Threat Hunter Playbook + Mordor Datasets + BinderHub = Open Infrastructure for Open Hunts,” Open Threat Research, December 2019, https://medium.com/threat-hunters-forge/threat-hunter-playbook-mordor-datasets-binderhub-open-infrastructure-for-open-8c8aee3d8b4 (accessed August 31, 2021).