9.3 OO Data Modeling Using Unified Modeling Language (UML)
Entity-relationship (ER) diagrams are not well suited to representing objects because they do not allow representation of methods. The OMG defines and maintains standards for the Unified Modeling Language (UML), which was developed as a standard for software models. UML class diagrams allow us to express OO database concepts more naturally than standard ER diagrams. FIGURE 9.5 shows a UML class diagram for part of the revised University database, in which we show many of the features of such diagrams. The choices made in constructing this diagram are intended to demonstrate different features of the diagramming notation, and do not represent the only, or necessarily the best, possible model for the example.
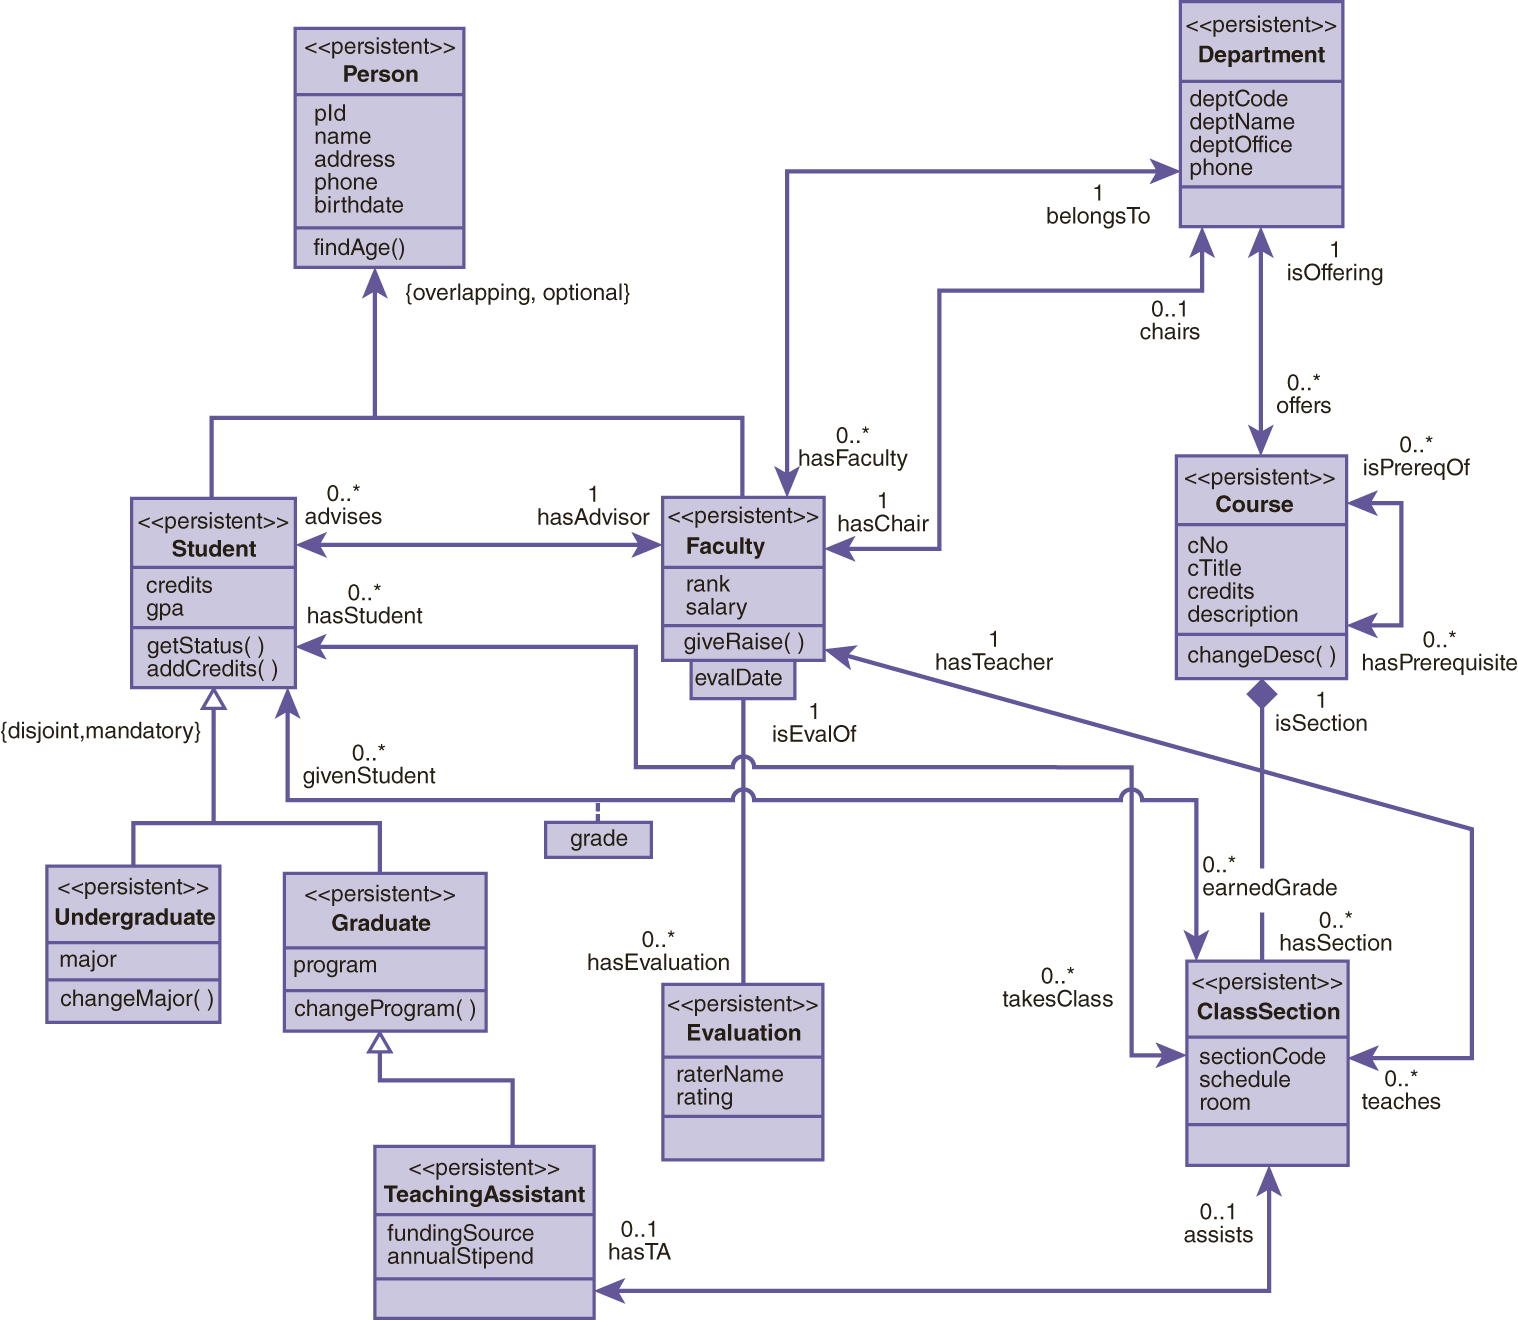
FIGURE 9.5 A UML Class Diagram
In a UML class diagram, rectangles represent classes. Class rectangles are subdivided into three sections: the top one for the class name, the middle for the attributes, and the bottom for the methods. The string in guillements (<<>>) above the class name is called a stereotype. The <<persistent>> stereotype indicates that the class is persistent, which means it maps to a database and its objects will persist in storage after the program terminates. Generalization hierarchies are represented by lines connecting the subclasses to the superclass, with a triangle pointing toward the superclass.
In Figure 9.5, Person is specialized into Student and Faculty, and Student is specialized into Undergraduate and Graduate. Graduate has a subclass, TeachingAssistant. Note that for this example, TeachingAssistant is not a subclass of Faculty. A filled generalization triangle represents overlapping subclasses, which means an object can belong to both subclasses, while a blank (outline-only) triangle represents disjoint ones. The diagram shows that a Person can be both a Student and a Faculty member, but a Student cannot be both Undergraduate and Graduate. If each member of the superclass must belong to a subclass, we describe the specialization as mandatory, as opposed to optional. Specialization constraints can be written on the line near the triangle, enclosed in curly brackets. For example, we write {overlapping, optional} for the specialization of Person into Student and Faculty, which shows that not every Person has to be a Student or a Faculty but some could be both, and {disjoint, mandatory} for Student into Undergraduate and Graduate to show that every Student must be either Undergraduate or Graduate but not both.
Relationships between classes are also shown by lines. In UML, we distinguish between an association, which is either a unidirectional or bidirectional relationship between classes, and aggregation, which is a type of relationship that connects a whole to its parts. Associations, or binary connections between classes, are represented by lines connecting the class rectangles. Several associations, such as the one connecting Department and Course, are shown in Figure 9.5. The name of the association may optionally appear on the line. Any descriptive attribute of the relationship is shown in a box connected to the association line by a dotted line, as shown in the grade attribute of the association that connects Student to ClassSection.
Role names can also appear on association lines if they are needed for clarity, but their placement is opposite to that in an ER diagram, appearing at the head (arrow) of the directed line from a class to the class it relates to. For one of the associations between Department and Faculty, we have used role names hasChair (from Department to Faculty) and chairs (from Faculty to Department) to show that it connects the chairperson with the department.
Aggregation is a special type of relationship that connects a whole to its parts. If the phrase describing the relationship of one class to another is that it “is part of” the other, and the class is clearly subordinate to the other, then aggregation is the better representation of the relationship. We represented the relationship between Course and ClassSection as an aggregation. The aggregation is represented by a line with a diamond on the side of the class that is the aggregate. If the aggregation is not given a name, the aggregation line is interpreted to mean “has.”
Participation constraints and cardinality for both association and aggregation relationships are specified using min..max notation. Each relationship line connecting classes has a pair of integers, min..max, along with the optional role name. The first integer of the pair, min, specifies the least number of relationship instances in which an object must participate. A min of 0 means that there may be objects that do not participate in instances of the relationship, so the participation is partial. If min is 1 or more, the participation is total, meaning that each object must participate in at least one instance of the relationship. The value of max is the greatest number of relationship instances an object can participate in. This value could be 1, N, or * (to represent many), or some constant integer, such as 10. If both min and max have a value of 1, we simply write the single integer 1 instead of 1..1. In UML diagrams, we call these multiplicity indicators, and we place them at the head of the arrow for the relationship. For example, the 0..* with the label offers at the head of the arrow going from Department to Course indicates that a Department can offer no courses or many courses, while the 1 with the label isOffering at the head of the arrow from Course to Department means that a Course is an offering from exactly one Department.
In Chapter 3, we saw that in extended entity-relationship (EER) diagrams, parentheses are used around the values, which are separated by a comma, and the constraints are placed between the entity rectangle and the relationship diamond, essentially placing them opposite their placement in UML (shown in Chapter 3.) The multiplicity indicator placement in EER diagrams is sometimes described as “look here,” while the placement in UML diagrams is “look there.”
Recursive relationships between members of the same class, called reflexive associations or reflexive aggregations, are shown by an association line or aggregation line going from a class back into itself. The relationship that connects courses and their prerequisites is a reflexive association. Role names appear on the line, with multiplicity indicators at each end. On the diagram we show that a Course may have zero to many prerequisites and that a Course may be a prerequisite for zero to many other courses.
Weak entities can be represented by a box attached to the associated strong owner entity, with the discriminator (partial key) appearing in a box beneath the owner’s class rectangle. Figure 9.5 illustrates Evaluation as a weak entity, dependent on Faculty. For this example, we assume the same faculty member is never evaluated twice on the same day, so we use evalDate as the discriminator.