
Creating the responsive supply chain
- Using the volume/variability matrix
- Product ‘push’ versus demand ‘pull’
- The Japanese philosophy
- The agile supply chain
- The foundations of agility
- A routemap to responsiveness
One of the biggest challenges facing organisations today is the need to respond to ever increasing levels of volatility in demand. For a variety of reasons product and technology life cycles are shortening, competitive pressures force more frequent product changes and consumers demand greater variety than ever before.
To meet this challenge the organisation needs to focus its efforts upon achieving greater agility such that it can respond in shorter time-frames both in terms of volume change and variety change. In other words it needs to be able to quickly adjust output to match market demand and to switch rapidly from one variant to another. To a truly agile business, volatility of demand is not a problem; its processes and organisational structure as well as its supply chain relationships enable it to cope with whatever demands are placed upon it.
Agility in the sense of the ability to match supply with demand is not necessarily synonymous with ‘leanness’. Much has been written about lean manufacturing – often with reference to the automobile industry.1 The lean approach to manufacturing seeks to minimise inventory of components and work-in-progress and to move towards a ‘JIT’ environment wherever possible. However, while ‘leanness’ may be an element of ‘agility’ in certain circumstances, by itself it will not enable the organisation to meet the precise needs of the customer more rapidly. Indeed it could be argued that, at least until recently, the automobile industry, for all its leanness, is one of the least agile industries around. Webster’s Dictionary makes the distinction clearly when it defines lean as ‘containing little fat’ whereas agile is defined as ‘nimble’.
Agility has many dimensions and the concept applies as much to networks as it does to individual companies. Indeed, a key to agile response is the presence of agile partners upstream and downstream of the focal firm. Whilst organisations may have internal processes that are capable of rapid response, their agility will still be constrained if they face long replenishment lead-times from suppliers, for example.
Agility, as we have said, is not synonymous with ‘leanness’ but it can build upon it. Leanness in a sense is about doing more with less. It owes its origins to the Toyota Production System (TPS) and its preoccupation with the reduction or elimination of waste (muda).2 Lean manufacturing is characterised by ‘level schedules’, i.e. a forward plan to ensure that the use of resources is optimised.
The backdrop against which lean thinking was originated was the Japanese automobile industry of the 1970s. This was an industrial context typified by the volume manufacture of relatively standard products (i.e. low levels of variety) and a focus on achieving efficiencies in the use of resources and in maximising economies of scale. In this type of situation, i.e. standard products and relatively predictable demand, experience has shown that lean practices work well.
However, in market environments where demand is uncertain, the levels of variety are high and consequently volume per SKU is low, then a different response is required. Whilst efficiency is always desirable, in the context of unpredictable demand it may have to take second place to ‘effectiveness’ as the main priority for supply chain management. Effectiveness in this context means the ability to respond rapidly to meet the precise needs of an often fragmented marketplace. In other words, rather than the emphasis being on producing standard products for mass markets ahead of demand, the requirement becomes one of producing multiple product variants (often customised) for much smaller market segments in response to known demand.
Figure 6.1 reflects the different contexts in which the ‘lean’ and ‘agile’ paradigms might work best.
Figure 6.1 Agile or lean?

In reality, within the same business it is likely that there will exist the need for both lean and agile supply chain solutions, as some products will have predictable demand whilst for others demand will be far more volatile. In fact it can be argued that rather than the conventional ‘one size fits all’ strategy for supply chain design, the need today is for multiple supply chain solutions. One way to identify what types of supply chain strategies might be appropriate in different circumstances is to position the products in an organisation’s portfolio according to their supply and demand characteristics.
‘Supply characteristic’ in this context means the lead-time of replenishment. This could be replenishment of the product itself if it is bought in (e.g. a retailer) or of components in the case of a manufacturer. Clearly, if replenishment lead-times are short then a different supply chain strategy can be employed than when lead-times are long.
Demand conditions may be characterised by the predictability of demand. One measure of demand predictability is the variability of demand; by definition demand that does not vary much from one period to another is easier to predict.
Figure 6.2 shows four broad generic supply chains strategies dependent upon the combination of supply/demand conditions for each product.
Figure 6.2 Generic supply chain strategies

In those cases where demand in predictable and replenishment lead-times are short, then a ‘Kanban’ type of solution is indicated. This is a philosophy of continuous replenishment where, at its extreme, as each product is sold or used it is replaced.
In the top left-hand box where lead-times are long but demand is predictable, then a ‘lean’ type approach will be appropriate. Materials, components or products can be ordered ahead of demand and manufacturing and transportation facilities can be optimised in terms of cost and asset utilisation. Conversely, the bottom right-hand corner is the real domain of the agile supply chain. Here demand is unpredictable but lead-times are short, enabling ‘quick response’ type solutions – the extreme case being make-to-order (but in very short time-frames).
The top right-hand corner presents an interesting situation: lead-times are long and demand is unpredictable. In situations such as this, the first priority should be to seek to reduce lead-times because the variability of demand is almost certainly outside the organisation’s control. Lead-time reduction would enable the application of agile solutions. However, if lead-times cannot be reduced the next option is to seek to create a hybrid lean/agile solution. These hybrid solutions require the supply chain to be ‘de-coupled’ through holding strategic inventory in some generic or unfinished form, with final configuration being completed rapidly once real demand is known. This is the classic ‘postponement’ strategy. An alternative form of postponement where the final physical configuration cannot be delayed is to postpone the actual distribution of the product by holding it in fewer (or even only one) locations and using express transportation to move it to the final market or point-of-use once actual demand is known.
The goal of a hybrid (or ‘leagile’ as it is sometimes termed) strategy should be to build an agile response upon a lean platform by seeking to follow lean principles up to the de-coupling point and agile practices after that.3 Figure 6.3 illustrates this idea.
Figure 6.3 The de-coupling point

A good example of a de-coupling point enabling a lean/agile hybrid strategy is provided by the paint industry. Today, consumers can be offered customised solutions in terms of the colour of paint through the use of paint mixing machines located in retail outlets. The retailers only need to stock a relatively small number of tints and the base paint to provide an almost infinite number of final colours. Thus the paint manufacturer can utilise lean processes in producing base colours in volume but can provide an agile and timely response to end users. This example also illustrates the principle of seeking to reduce complexity whilst providing the requisite level of variety that the market demands.
Using the volume/variability matrix
It will be apparent from the earlier discussion that the choice of supply chain strategy for any given product or family of products needs to be tailored to their demand and supply characteristics. In the case of demand characteristics there are two particularly important elements: volume and variability. Volume measures the level of demand for a product over a period of time, e.g. daily, monthly, annually. Variability refers to the extent to which the level of demand changes from one time period to another.
A good starting point for identifying appropriate supply chain strategies for specific products is to calculate, at the individual SKU level, the average demand per day (or other appropriate time unit) and compare it with the variability of demand for that same item. Variability can be measured by calculating the coefficient of variation for the item – defined as the standard deviation of demand divided by the mean. If this analysis is performed across the entire product range of the business the results can be portrayed as a scatter diagram on a two-dimensional volume/variability matrix as shown in Figure 6.4 below where each dot represents a specific SKU.
Figure 6.4 Volume/variability matrix

There is no hard and fast rule for where the cut-off point between high and low should fall on either axis. However the 80/20 principle is generally appropriate for the volume dimension, i.e. the level of daily demand above which the top 20% of the products fall. For variability a coefficient of variation of 1.0 or more is often suggested as reflecting a high level of variability.
Why do this analysis? The main reason for producing such a matrix is to develop appropriate supply chain strategies for the product portfolio depending upon which quadrant an individual SKU is located in. Figure 6.5 on the next page provides a starting point for the development of a segmented approach to supply chain planning.

For each quadrant of the matrix, specific supply chain strategies can be developed as illustrated in the box below.
Indicative supply chain strategies
Quadrant 1: Low volume, high variability
Products in this quadrant should be regularly reviewed to understand their role in the portfolio and their financial performance. Are there opportunities for margin improvement through cost engineering? Stock should be managed and held centrally and forecasts agreed with customers. Explore make-to-order possibilities. Minimum order quantities should reflect economic batch size.
Quandrant 2: Low volume, low variability
Because these products have low levels of demand variability they should be easier to forecast using statistical methods. Production should be planned to maximise efficiencies and best use of capacity. Deliveries should be pre-planned to maximise consolidation opportunities.
Quadrant 3: High volume, high variability
These products sell in volume but with difficult to predict peaks and troughs. One strategy is to separate the ‘base’ demand from the ‘surge’. In other words identify the floor level of demand below which sales volume rarely falls and manage this as predictable and stable. For the surge demand explore opportunities for postponement and late configuration. Forecast for capacity over a period and use contract manufacturing where appropriate.
Quadrant 4: High volume, low variability
Sales levels for these products are generally easier to predict and volumes are high. Where possible a ‘make-to-rate’ continuous replenishment strategy should be adopted. Relationships with key accounts should be developed to enable the implementation of VMI arrangements. The focus should be on optimising capacity and asset utilisation throughout the supply chain.
Product ‘push’ versus demand ‘pull’
There have been many new ideas and concepts in business management over the last 30 or so years, some of which have endured while others have soon been discarded. However, perhaps one of the most significant principles to become widely adopted and practised is that of just-in-time. Just-in-time (JIT) is a philosophy as much as it is a technique. It is based upon the simple idea that wherever possible no activity should take place in a system until there is a need for it.
Thus no products should be made, no components ordered, until there is a downstream requirement. Essentially JIT is a ‘pull’ concept, where demand at the end of the pipeline pulls products towards the market and behind those products the flow of components is also determined by that same demand. This contrasts with the traditional ‘push’ system where products are manufactured or assembled in batches in anticipation of demand and are positioned in the supply chain as ‘buffers’ between the various functions and entities (see Figure 6.6).
The conventional approach to meeting customer requirements is based upon some form of statistical inventory control which typically might rely upon reordering when inventory levels fall to a certain predetermined point – the so-called reorder point (ROP).
Under this approach a reorder point or reorder level is predetermined based upon the expected length of the replenishment lead-time (see Figure 6.7). The amount to be ordered may be based upon the economic order quantity (EOQ) formulation which balances the cost of holding inventory against the costs of placing replenishment orders.
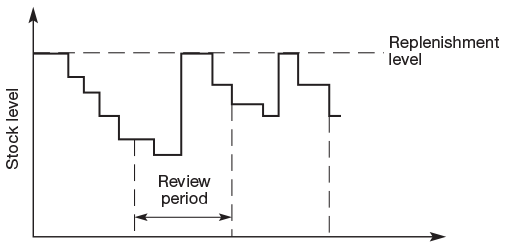
Alternative methods include the regular review of stock levels with fixed intervals between orders when the amount to be ordered is determined with reference to a predetermined replenishment level, as in Figure 6.8.
There are numerous variations on these themes and the techniques have been well documented and practised for many years. However, they all tend to share one weakness – they frequently lead to stock levels being higher or lower than necessary, particularly in those cases where the rate of demand may change or occurs in discrete ‘lumps’. This latter situation frequently occurs when demand for an item is ‘dependent’ upon demand for another item, e.g. demand for a TV component is dependent upon the demand for TV sets; or where demand is ‘derived’, e.g. the demand for TV sets at the factory is determined by demand from the retailer, which is derived from ultimate demand in the marketplace.

The implications of dependent demand are illustrated in the example given in Figure 6.9, which shows how a regular off-take at the retail level can be converted into a much more ‘lumpy’ demand situation at the plant by the use of reorder points.
A similar situation can occur in a multi-level distribution system where the combined demand from each level is aggregated at the next level in the system. Figure 6.10 demonstrates such an occurrence.
The common feature of these examples is that demand at each level in the logistics system is dependent upon the demand at the next level in the system. Demand is termed ‘dependent’ when it is directly related to, or derives from, the demand for another inventory item or product. Conversely, the demand for a given item is termed ‘independent’ when such demand is unrelated to demand for other items – when it is not a function of demand for other items. This distinction is crucial because whilst independent demand may be forecast using traditional methods, dependent demand must be calculated, based upon the demand at the next level in the logistics chain.

Figure 6.8 The review period method of stock control
Using the example in Figure 6.10 it would clearly be inappropriate to attempt to forecast demand at the factory using data based upon the pattern of combined demand from the regional centres. Rather it has to be calculated from the identified requirements at each of the preceding levels. It is only at the point of final demand, in this case at the depots, where forecasts can sensibly be made – in fact in most cases demand at the depot would itself be dependent upon retailers’ or other intermediaries’ demand, but as this is obviously outside the supplier’s direct control it is necessary to produce a forecasted estimate of demand.

The classic EOQ model has tended to channel our thinking towards the idea that there is some ‘optimum’ amount to order (and hence to hold in stock). The EOQ model arrives at this optimum by balancing the holding cost of inventory against the cost of issuing replenishment orders and/or the costs of production set-ups (see Figure 6.11).
The EOQ can be easily determined by the formula:

where,
A = Annual usage
S = Ordering cost/set-up cost
i = Inventory carrying cost

Figure 6.11 Determining the economic order quantity

So, for example, if we use 1,000 units of product X a year, each costing £40, and each order/set-up costs £100 and the carrying cost of inventory is 25 per cent then:
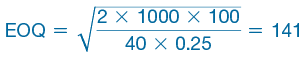
The problem is that this reorder quantity means that we will be carrying more inventory than is actually required per day over the complete order cycle (except on the last day). For example, if the EOQ were 100 units and daily usage was 10 units then on the first day of the cycle we will be overstocked by 90 units, on the second day by 80 units and so on.
To compound the problem we have additional inventory in the form of ‘safety’ stock, which is carried in order to provide a safeguard against demand during the replenishment lead-time being greater than expected and/or variation in the lead-time itself.
The result is that we end up with a lot of unproductive inventory, which represents a continuing drain on working capital.
The Japanese philosophy
It has often been said that the scarcity of space in industrialised Japan has made the nation conscious of the need to make the most productive use of all physical resources, including inventory. Whether this is true is of academic interest only – what is the case is that the widely held view in Japanese industry is that inventory is waste.
An analogy that is frequently drawn in Japan is that an organisation’s investment in inventory is like a large, deep lake (see Figure 6.12). Well below the surface of this lake are numerous jagged rocks, but because of the depth of the water, the captain of the ship need have no fear of striking one of them.
Figure 6.12 Inventory hides the problems

The comparison with business is simple: the depth of the water in the lake represents inventory and the rocks represent problems. These problems might include such things as inaccurate forecasts, unreliable suppliers, quality problems, bottlenecks, industrial relations problems and so on. The Japanese philosophy is that inventory merely hides the problems. Their view is that the level of water in the lake should be reduced (say to level ‘B’ in Figure 6.12). Now the captain of the ship is forced to confront the problems – they cannot be avoided. In the same way if inventory is reduced then management must grasp the various nettles of forecast inaccuracy, unreliable suppliers and so on.
The Japanese developed the so-called Kanban concept as a way of lowering the water in the lake. Kanban originated in assembly-type operations but the principles can be extended across the supply chain and to all types of operations. The name Kanban comes from the Japanese for a type of card that was used in early systems to signal to the upstream supply point that a certain quantity of material could be released.
Kanban is a ‘pull’ system that is driven by the demand at the lowest point in the chain. In a production operation the aim would be to produce only that quantity needed for immediate demand. When parts are needed on the assembly line, they are fed from the next stage up the chain in just the quantity needed at the time they are needed. Likewise this movement now triggers demand at the next work station in the chain, and so on.
By progressively reducing the Kanban quantity (i.e. the amount demanded from the supplying work station), bottlenecks will become apparent. Management will then focus attention on the bottleneck to remove it by the most cost-effective means possible. Again the Kanban quantity will be reduced until a further bottleneck is revealed. Hence the Kanban philosophy essentially seeks to achieve a balanced supply chain with minimal inventory at every stage and where the process and transit quantities of materials and stock are reduced to the lowest possible amount. The ultimate aim, say the Japanese, should be the ‘economic batch quantity of 1’!
In fact this logic does not necessarily conflict with the traditional view of how the economic batch (or order) quantity is determined. All that is different is that the Japanese are seeking to minimise the batch quantity by shifting the curve that represents the cost of ordering or the cost of set-ups to the left (see Figure 6.13). In other words, they focus on finding ways to reduce set-up costs and ordering costs.
The effect of moving the curve to the left on the economic batch/order quantity is seen in Figure 6.14.
The agile supply chain
To be truly agile, a supply chain must possess a number of distinguishing characteristics, as Figure 6.15 suggests.
Firstly, the agile supply chain is market-sensitive. Market-sensitive in this context means that the supply chain is capable of reading and responding to real demand. Most organisations are forecast-driven rather than demand-driven. In other words, because they have little direct feed-forward from the marketplace by way of data on actual customer requirements, they are forced to make forecasts based upon past sales or shipments and convert these forecasts into inventory. The breakthroughs of the last decade in the use of IT to capture data on demand direct from the point-of-sale or point-of-use are now transforming the organisation’s ability to hear the voice of the market and to respond directly to it.

Figure 6.14 Reducing the economic batch/order quantity

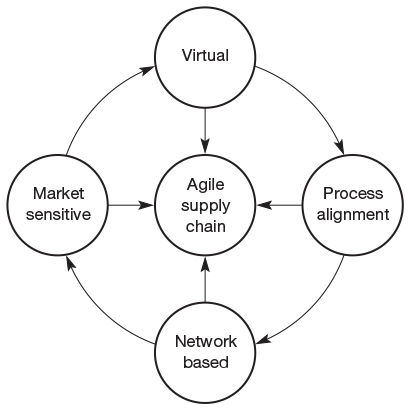
The use of IT to share data between buyers and suppliers is, in effect, creating a virtual supply chain. Virtual supply chains are information based rather than inventory based.
Conventional logistics systems are based upon a paradigm that seeks to identify the optimal quantities and the spatial location of inventory. Complex formulae and algorithms exist to support this inventory-based business model. Paradoxically, what we are now learning is that once we have visibility of demand through shared information, the premise upon which these formulae are based no longer holds. E-commerce and the Internet have enabled partners in the supply chain to act upon the same data, i.e. real demand, rather than be dependent upon the distorted and noisy picture that emerges when orders are transmitted from one step to another in an extended chain.
Supply chain partners can only make full use of shared information through process alignment, i.e. collaborative working between buyers and suppliers, joint product development, common systems, and shared information. This form of co-operation in the supply chain is becoming ever-more prevalent as companies focus on managing their core competencies and outsource all other activities. In this new world a greater reliance on suppliers and alliance partners becomes inevitable and, hence, a new style of relationship is essential. In the ‘extended enterprise’, as it is often called, there can be no boundaries and an ethos of trust and commitment must prevail. Along with process integration comes joint strategy determination, buyer/supplier teams, transparency of information and even open-book accounting.
This idea of the supply chain as a confederation of partners linked together as a network provides the fourth ingredient of agility. There is a growing recognition that individual businesses no longer compete as stand-alone entities but rather as supply chains. Managing networks calls for an entirely difference model than the conventional ‘arm’s-length’ approach to managing customer and supplier relationships. Clearly a much higher level of collaboration and synchronisation is required if the network is to be truly agile. It can be argued that, in today’s challenging global markets, the route to sustainable advantage lies in being able to make best use of the respective strengths and competencies of network partners to achieve greater responsiveness to market needs.
The foundations of agility
It will be apparent that agility is not a single company concept but rather it extends from one end of the supply chain to the other. The concept of agility has significant implications for how organisations within the supply/demand network relate to each other and how they can best work together on the basis of shared information.
To bring these ideas together, a number of basic principles can be identified as the starting point for the creation of the agile supply chain.
1 Synchronise activities through shared information
Synchronisation implies that all parties in the supply chain are ‘marching to the same drumbeat’. In other words, through shared information and process alignment there is in effect one set of numbers and a single schedule for the entire supply chain. This somewhat Utopian vision is increasingly becoming reality as web-based technology enables different entities in a network to share information on real demand, inventory and capacity in a collaborative context.
In the fast moving consumer goods (FMCG) sector there is a growing number of examples of supply chain synchronisation made possible by the retailers’ increasing willingness to share point-of-sale data with manufacturers. One such instance is the web-based system established by the UK’s biggest retailer, Tesco. The Tesco Information Exchange is an extranet that enables Tesco’s suppliers to access their own sales data, item by item. This data is updated several times a day and potentially can provide manufacturers with the means to link their production schedules to Tesco’s replenishment requirements.
In the automobile industry most of the volume car manufacturers have established ‘seamless’ processes with their first-tier suppliers based upon providing immediate access to production plans and schedules. This enables JIT deliveries to be achieved without the need for major buffers of inventory at the first-tier level.
In the United States the ‘quick response’ initiative in the apparel industry has linked retailers to garment manufacturers and also to the fabric producers through shared information. The impact of this collaboration has been a significant improvement in the competitiveness of that industry.
2 Work smarter, not harder
Detailed examination of the processes that together constitute a supply chain inevitably highlights the fact that a large proportion of the end-to-end time is ‘non-value-adding’. In other words, time is being spent on activities that typically create cost but do not create a benefit for the customer. Time spent in inventory is a classic example of non-value-adding time. Supply chain mapping can reveal where this idle time occurs; to attack it then requires a review of the processes that precede or follow that idle time. Process time is directly correlated with inventory, e.g. if it takes three weeks from raising a purchase order to receiving the goods, at least three weeks of inventory will be required to buffer ourselves during that lead-time.
Business process re-engineering (BPR) is the term frequently applied to the activity of simplifying and reshaping the organisational processes with the goal of achieving the desired outcomes in shorter time-frames at less cost. Many processes in the supply chain are lengthy because the constituent activities are performed in ‘series’, i.e. in a linear, ‘one after the other’ way. It is often possible to re-engineer the process so that those same activities can be performed ‘in parallel’, i.e. simultaneously.
Time compression in a supply chain can be achieved not necessarily by speeding up activities, but rather by doing fewer things, i.e. eliminating where possible non-value-adding activities. Many existing practices in business are performed for historical reasons; there was once a justification for those practices but, with changed conditions, that justification may no longer exist.
Supply chains can be transformed in terms of their agility by the rigorous application of process re-engineering principles.
3 Partner with suppliers to reduce in-bound lead-times
Conventionally, firms have maintained an arm’s-length relationship with suppliers. Suppliers have often been chosen on the basis of price rather than their responsiveness. A major opportunity exists for reducing in-bound lead-times through close working with key suppliers. Because in the past there was often a view that suppliers should be held at ‘arms length’, many opportunities for improving responsiveness have been missed. As supplier agility is one of the main requirements in the creation of a more responsive supply chain it is perhaps surprising that some businesses even now have few collaborative programmes with suppliers in place.
Using joint supplier/customer teams to explore opportunities for re-aligning and re-engineering processes, on both sides of the interface, which impact overall responsiveness can produce significant dividends. Because, conventionally, companies have designed processes in a vacuum, it is not surprising to find that those processes do not align easily with their supply chain partners’ processes. Many companies have gained real benefits for example by allowing their suppliers to access their own information and planning systems, e.g. providing access to enterprise planning systems such as SAP.
Often suppliers may well be able to transfer knowledge and best practice from their operations to their customers’ – and vice versa. In either case, the opportunities to reduce in-bound lead-times by closer partnership across the supply chain are considerable.
4 Seek to reduce complexity
Complexity comes in many guises in supply chains. Complexity may be generated by multiple variants of the same product, e.g. different pack sizes, or by each product in a family having greatly different bills of material, or by frequent product changes, and so on. Complexity can also be generated through cumbersome processes that involve many different stages and hand-offs. Simplification is an obvious remedy for complexity but one which may not always be available. However, there will often be opportunities to reduce complexity by questioning the reasons why things are the way they are.
For example, is the level of product variety greater than the customer actually requires? Often product proliferation is driven by sales or marketing departments and may not actually achieve additional sales but spread the same total demand over a greater number of SKUs. The greater the fragmentation of demand the harder it becomes to manage availability in that the variability of demand at the individual item level will tend to be higher.
Simplification can sometimes be achieved through seeking greater commonality of components or sub-assembly across a family of products. For example, in automobile design it is increasingly the case these days that several different models of car are built on the same platform and share common components and sub-assemblies ‘under the skin’.
The point about complexity is that it provides a barrier to agility as well as generating cost. Complexity in the supply chain is addressed in more detail in Chapter 9.
5 Postpone the final configuration/assembly/distribution of products
Postponement refers to the process by which the commitment of a product to its final form or location is delayed for as long as possible. When decisions on the final configuration or pack have to be made ahead of demand there is the inevitable risk that the products that are available are not the ones the customer wants. For example, the customer may want a blue five-door car with air-conditioning but the dealer has a red, three-door with a sunroof. Or, again, there may be a blue five-door car available but it is at a different dealer at the other end of the country.
The philosophy of postponement would ideally begin on the drawing board so that products are designed with late configuration in mind. The longer that products can remain as generic ‘work-in-progress’ then the more flexibility there will be to ensure the ‘right product in the right place at the right time’.
An example of late configuration is provided by Hewlett Packard and its DeskJet printers. These products are designed so that they can be manufactured as generic, but incomplete, units. They are then localised at regional centres where the appropriate power pack, plug and cable, local packaging, etc., are added. In this way inventory is minimised but availability is enhanced.
Postponement may not always be feasible in terms of late configuration but there may be scope for spatial postponement through holding inventory in just a few locations with the ability to ship the product rapidly to the location required when an order is received.
6 Manage processes not just functions
For centuries, organisations have followed an organisational logic based upon the ‘division of labour’ whereby activities take place within functions or departments. Whilst this functionally based organisational concept may ensure the efficient use of resources, it is actually inwardly focused and tends to lead to a ‘silo’ type mentality. It also seems to be the case that these functionally based organisations are slow to respond to changes in the market or business environment. Because there are often multiple ‘hand-offs’ as things get passed from one function to another, there is an inevitable lengthening in the time to respond. In functionally based businesses the new product development activity, for example, is often lengthy as it moves from R&D to product engineering to market research and eventually into production.
Conversely, those companies who are able to respond rapidly to changing customer requirements tend to focus more upon managing ‘processes’. Processes are the horizontal, market-facing sequences of activities that create value for customers. They are cross-functional by definition and are usually best managed through the means of interdisciplinary teams. The critical business processes that cut across the organisation would include innovation, customer relationship management and supplier relationship management.
The way businesses are organised can have a significant impact upon their agility: those companies with cumbersome, multi-level decision-making processes tend to be far slower to respond to market changes than their competitors who give autonomy to self-managed process teams.
A further reason why process management is critical to agility across the wider supply chain is that process alignment between entities in that chain is clearly facilitated if organisational structures are horizontal rather than vertical.
7 Utilise appropriate performance metrics
It is a truism that performance measurement shapes behaviour. This is particularly the case in business organisations where formal measurement systems drive the business. In functionally based organisations these measurements often are based upon departmental budgets and are underpinned by objectives such as cost minimisation, asset utilisation and efficiency, and productivity improvement. Whilst on the face of it these objectives may appear to be desirable, they will not necessarily encourage agile practices within the organisation. If, for example, a manufacturing facility is measured on, say, unit cost of production then the incentive will be to go for big batch sizes to take advantage of economies of scale. However, such actions will probably lead to a loss of flexibility and the creation of additional inventory. If, on the other hand, time-based metrics were to be employed then the focus could be on cycle time reduction, set-up time reduction and other measures that encourage agile practices.
A further incentive to agility can be created by linking processes to customer-based metrics. One such widely used measure is ‘perfect order achievement’. A perfect order is one where the customer gets exactly what they want at the time and place they want it. It will also usually be the case that different customers may well have different requirements and expectations, so the definition of what constitutes a perfect order will have to be specific to each segment, channel or even individual key accounts.
A fundamental tenet of agility is customer responsiveness, hence the need to ensure that the primary measures of business performance reflect this imperative. ‘Time-to-market’ and ‘time-to-volume’ are powerful metrics employed by companies such as Sony and Canon where short life cycles dictate a focus on rapid response to fast-changing technologies and volatile customer demand.
In the past, the focus of many companies was primarily on efficiency, i.e. a continuing search for lower costs, better use of capacity, reduced inventories and so on. These are still worthy goals today but the priority has shifted. Now the emphasis must be on effectiveness. In other words, the challenge is to create strategies and procedures that will enable organisations to become the supplier of choice and to sustain that position through higher levels of customer responsiveness. This is the logic that underpins the concept of the agile supply chain.
A routemap to responsiveness
As we observed earlier, conventional supply chains are typically designed from the factory outwards. In other words, they tend to be structured to enable the company’s internal efficiencies to be optimised. So, for example, in a manufacturing environment the objective has often been to achieve low-cost production with high levels of capacity utilisation with the consequent need to warehouse products which are manufactured in economic batch sizes.
By contract, a customer-driven supply chain recognises the primacy of the needs of the customer. Rather than the ‘one size fits all’ philosophy of the conventional supply chain, the implication of adopting a customer-driven approach is that there will be a high level of tailoring and customisation of the service offer to meet individual customer needs.
This raises the question of how can multiple supply chain solutions be delivered in practice? Clearly the need is for flexibility in the processes that underpin the supply chain. Whilst it would be impractical to have dedicated physical supply chains for individual customers there is no reason why the service package cannot be differentiated according to the requirements of these customers.
At a high level it can be argued that there are three types of customer: those driven by cost, those driven by service/responsiveness and those seeking specific solutions (e.g. a retailer requiring shelf-ready packaging). The first of these equates pretty well to the idea of a ‘lean’ supply chain, the second to an ‘agile’ supply chain and the third to a ‘customised’ supply chain.
These supply chains may often share common facilities and processes but they will be configured in different ways. There are three dimensions that provide the platform for any supply chain strategy and they are all substitutable to an extent: time, inventory and throughput capacity.
What this means is that for each of the three customer types there will need to be a particular balance between time (lead-times), inventory and throughput capacity. So, for example, the lean supply chain needs predictability – to enable longer planning horizons so that low-cost sourcing can be used and production and transport assets utilised to the full. Conversely, an agile supply chain may require local suppliers with access to additional capacity when required. Customised supply chains tend to be appropriate where the customer is big enough to support an investment in dedicated facilities or resources.
Whatever the chosen supply chain, ultimately its ‘architecture’ must be market-driven. However, for supply chains to become truly market-driven there has to be a sustained focus on responsiveness across the business and its wider supply chain. There are many prerequisites for responsiveness and Figure 6.16 summarises the key elements.
The responsive business will have agile suppliers and will work very closely with them to align processes across the extended enterprise. It will also be very close to its customers, capturing information on real demand and sharing that information with its partners across the network. Internally the business will also be focused on agility through the way it organises – breaking through functional silos to create process teams. In terms of its manufacturing and sourcing strategy, the responsive business will seek to marry the lean and agile paradigm through de-coupling its upstream and downstream processes, utilising the principles of postponement wherever possible.
Those companies that can follow this routemap will be more likely to be the leaders in their field. More often than not, when we look at the successful companies in any market, they tend to be the ones that have demonstrated their ability to respond more rapidly to the changing needs of their customers. The case study that concludes this chapter underlines the challenges that organisations must confront as they seek to become more responsive to customer needs.

World Duty Free
World Duty Free (WDF) is the UK’s biggest airport duty free goods retailer, accounting for 90% of all UK airport duty free sales. WDF is wholly owned by the Italian group Autogrill, in which Benetton have a 40% stake.
Even though WDF has experienced significant growth in recent years (partly organic and partly through merger – in particularly the merger in 2009 with Spanish duty free retailer, Alpha), it has been faced with an increasing degree of market turbulence and volatility of late. At the macro level the world recession has had a big impact on passenger numbers generally, and particularly at regional airports which have a higher proportion of leisure passengers. Sources of volatility at a micro level include the security arrangements at airports where the length of time taken to process passengers will vary according to daily changes in procedures (e.g. requesting passengers to remove their shoes), which itself directly impacts the amount of time individual passengers will have available for duty free shopping.
Further sources of volatility at a micro level can be airlines changing their departure times – for example, passengers leaving the UK for non-EU destinations can generally buy goods at a lower price and if the time of the flight changes or the plane is delayed there can be a significant change in demand patterns. A further impact on sales is created when airlines either withdraw a service or change airports – Ryan Air moving some of its services from one airport to another because of lower landing charges is a case in point.
Against this background of uncertainty and increasingly unpredictable demand, WDF is seeking to make the transition from a ‘forecast-driven’ to a ‘demand-driven’ business.
One of the strategies that it has adopted is to focus on its single distribution centre (based near London Heathrow Airport) to find ways in which its existing capacity can be used more flexibly. Using what are in effect ‘Six Sigma’ methodologies, WDF has been able to improve the utilisation of capacity and to improve flow-through so that it can cope better with the peaks and troughs in demand. So successful has this strategy been that WDF was able to cope with the opening of Terminal 5 without additional warehousing capacity. A further degree of flexibility in the Heathrow distribution centre is through the use of agency staff.
Becoming demand-driven requires a ‘JIT’ delivery philosophy based upon more frequent deliveries to their air-side outlets based on more frequent demand signals, i.e. point-of-sale data polls. The intention is, where possible, to move to a ‘continuous replenishment’ philosophy whereas products are sold they are rapidly replenished.
WDF has recognised that demand-driven supply chains require suppliers to be highly responsive. They are actively examining ways in which suppliers’ in-bound lead-times can be reduced – particularly through a greater level of shared information and the introduction of VMI arrangements.
With a product range of approximately 15,000 SKUs there is inevitably a ‘long-tail’ on their sales Pareto curve – for example 88% of their SKUs sell less than one unit per day per store. One response to this issue has been a focus on range rationalisation. Keeping control of variety is a continuing challenge with new product launches and promotions increasing every year. There are more and more niche segments, e.g. vodka with different flavours, different price points and positioning strategies. About half WDF’s SKUs change each year, making it difficult to use traditional methods of sales forecasting.
One realisation has been that WDF will need to move away from the traditional ‘one size fits all’ approach to a multiple supply chain strategy that seeks to manage the different volume and variability profiles of individual products in different ways. Equally, for certain products – particularly in more fashion-oriented categories such as sunglasses – they have to plan ahead for specific seasons and because of long lead-times need to order these products well in advance. Here the strategy is one of ‘when it’s gone, it’s gone’ which requires a completely different logistics capability to the ‘continuous replenishment’ type of products.
References
1. Womack, J.P., Jones, D.T. and Roos, D., The Machine that Changed the World, Macmillan, 1990.
2. Monden, Y., The Toyota Production System, Productivity Press, 1983.
3. Christopher, M. and Towill, D., ‘An Integrated Model for the Design of Agile Supply Chains’, International Journal of Physical Distribution and Logistics Management, Vol. 31, No. 4, 2001.