
Appendix AIntroduction to MCT: A Unified Metric for Lead Time
In today’s world, lead time is critical: offering products or services with short lead times provides competitive advantage in most industries. Hence, many improvement methods aim to reduce lead time as part of their overall goals. More important is the fact that, properly measured, lead time can be a strong indicator of total enterprise-wide waste. Thus, lead time reduction can be a powerful approach to reducing organizational waste. In addition, reducing lead time results in improvement of key performance metrics including cost, quality, and on-time delivery.
MCT (the acronym is explained in the next section) is a time-based metric that defines lead time in a precise way so that it properly quantifies an organization’s total system-wide waste. At the same time, when suitably used, MCT does not need to be data-intensive and can be relatively easy to apply. Thus, MCT provides a simple yet powerful metric for measuring improvement. This has been proven in practice, with hundreds of industry projects spanning over a decade (see “For Further Reading”).
Applying MCT in Both Manufacturing and Non-Manufacturing Contexts
Historically, the acronym MCT comes from the phrase “Manufacturing Critical-path Time.” Although in this book we are concerned with MCT only in the context of manufacturing, in actual fact the scope of MCT extends beyond manufacturing. MCT has been used in several contexts, including in office operations such as quoting and engineering; in new product introduction; in supply chains; in healthcare operations; and in insurance companies.
Thus, we have found it best to just use the acronym MCT (pronounced “em-see-tee”) as a metric. For example, in looking at the process for making quotations, we can use the term “MCT-quoting” to label the metric for the time to make the quotations. Similarly, we could use “MCT-hiring” to denote the metric for the time it takes to hire new employees, and so on.
Need for MCT Definition
Why is a precise definition needed for a seemingly obvious concept such as lead time? There are three main reasons:
“Lead time” can mean different things. Consider a supplier of bearings that stocks its standard bearings in distribution centers (DCs) around the U.S. The lead time for this supplier could be either (i) the lead time seen by U.S. customers, typically three days for the bearings to be picked from the DC and arrive at the customer’s site; or (ii) the lead time to make a fresh batch of bearings, typically 85 days from starting the first process to arrival at the DC. Now suppose the supplier receives an order for custom bearings (not stocked at a DC). There are two more possible lead times: (iii) the lead time quoted by the sales department; and (iv) the lead time actually achieved by the supplier in delivering these custom bearings. We could continue with examples of other “lead times.” There is clearly need for a standard, because you can’t have a goal of reducing something until you can agree on how to measure it.
Traditional definitions of lead time focus only on the result. A typical definition of lead time is: “The time from when an order is transmitted by a customer until the order is received by that customer”—but this focuses only on a result. It does not give any indication of how order fulfillment is achieved and specifically does not capture waste in the process of how that lead time is achieved.
MCT quantifies enterprise-wide waste. Other improvement methods identify individual instances of waste, such as: producing defective parts, or a worker needing to walk around the factory to find a missing tool. However, such wastes measure the micro impact of operational problems—they do not give insight into macro system-wide waste. As will be shown in this appendix, MCT does indeed provide insight into enterprise-wide waste. Later sections will also show that MCT extends naturally to an organization’s supply chain, and thus also provides insight into waste in the extended enterprise.
In summary, MCT provides management with a precisely defined metric that gives a unified measure of system-wide waste in a single number. Thus, examining the before-and-after MCT values for an improvement project makes it clear whether improvements have been achieved.
MCT Definition and Application
This is the central concept in this appendix, so it is highlighted here.
MCT The typical amount of calendar time from when a customer submits an order, through the critical path, until the first end-item of that order is delivered to the customer.
Key terms in this definition are now explained briefly.
typical amount The purpose of MCT is to highlight the biggest opportunities for improvement. For effective use of MCT, don’t get bogged down with trying to determine details; limit the scope of the MCT analysis and keep data gathering simple.
calendar time Customers view delivery in terms of a specific calendar date, and don’t care which days your organization is or is not working. MCT measures in real time, not working time, and keeps the focus on the calendar date.
customer submits an order This should be when the clock starts as far as the customer is concerned.
through the critical path This requires the following rules to be observed:
All necessary activities must be completed “from scratch”—for example, if components need to be fabricated, then pre-built stocks of these items cannot be used to reduce the MCT value; you must include the time to make the components.
Include all the normal queuing, waiting, and move delays that jobs incur—do not use values for rush (hot) jobs.
Time spent by material at any stage, including all inventory holding points, must be added into the MCT value.
If there are multiple paths involved, e.g., where components must be completed, or sub-tasks must be performed before a main task, then MCT is the value for the longest path from start to finish.
the first end-item Even though the customer might have ordered a batch of parts, this sharpens the focus on delivery of the first end-item. Here, end-item should be interpreted as the first usable set of items for the customer. Example: the customer needs to mount a support strut on a machine, and the supplier provides the strut and two mounting brackets for this operation. For the customer to complete one assembly operation they must receive one strut and two mounting brackets. Hence, this set is the “first usable set of items.”
is delivered MCT ends when the order is delivered to the customer’s point of receipt. This can be interpreted as needed for different business contexts, as shown below. In the specific case where you are analyzing the supply of components to a customer, MCT must include all logistics times (it is important to quantify the impact that logistics time has on a firm’s ability to respond to customers).
Detailed explanations of all the above concepts along with calculation rules and tips for calculation can be found in the MCT Quick Reference Guide (see “For Further Reading”).
Applying MCT in Various Business Contexts
MCT is not just a metric for manufacturing and part-production. The words “customer,” “order,” and “delivered” can be interpreted freely for non-manufacturing situations. For example:
Quotation process: “order” can be a request for quotation.
Engineering change process: “customer submits an order” can be the sales department requesting an engineering improvement, and “is delivered” can be when the improvement has been incorporated into the first shipped product.
Employee hiring process: “customer” can be a manager who needs an employee; “order” can be the manager’s request to Human Resources for hiring the employee; and “is delivered” can be when the employee arrives for his/her first day at work.
Preview of MCT Map, Gray Space, and White Space
An MCT analysis is typically conducted for a portion of an enterprise—a subset that has been targeted for improvement. The initial goal is to produce an MCT Map for that subset and to calculate the corresponding value of MCT. It will be shown that the MCT Map provides a high-level picture of opportunities for improvement, and the MCT (value) provides a benchmark to gauge subsequent improvements. This section defines some terminology related to MCT Maps.
MCT Map This is a graphic representation of the flow of an order through the specified subset of the organization. A simple example illustrates an MCT Map and the corresponding MCT.
Figure A.1 shows an MCT Map for an order from receipt at a company until the order is loaded onto a truck for shipping. The flow in Figure A.1 is from left to right and the representation is intuitive, as seen in the figure. In this example, sales activities and processes prior to receipt of order are not shown; also not shown are any processes used in shipping and logistics after the order leaves the company. This illustrates that the scope of an MCT Map is typically limited to a subset of an enterprise, as required for the goals of a specific project. In Figure A.1, the MCT for this subset is 14 days (= 2 + 9 + 3).
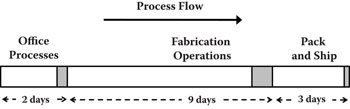
Figure A.1Example of an MCT Map.
Gray Space This illustrates the total time when something is actually happening to an order: for example, someone is working on it, or it is being machined, or it is in an oven. This total time is shown by the rectangles with the shaded gray. These are customarily placed at the end of the operations for which this time occurs. For instance, the order spends nine days in Fabrication Operations, and the Gray Space can be seen at the end of this nine-day segment. Note: while Gray Space might resemble the term “touch time” used in other approaches, it is not the same! There are specific rules for calculating the amount of the Gray Space: more details can be found in the MCT Quick Reference Guide.
White Space This illustrates the remaining time spent by the order in a particular area; this is the time when nothing is happening to the order! This is customarily placed before the Gray Space for the same area. Looking at the Fabrication Operations again, you can see the White Space preceding the Gray Space.
Insights from MCT Maps
While an MCT Map seems simple, it is a powerful tool that can provide many insights.
The MCT Map is drawn roughly to scale, so that the magnitude of the various elements is apparent. This provides a visual overview—you can quickly see where the greatest opportunities lie.
For initial insights, times within various segments can be aggregated. In Figure A.1, say the Fabrication operations include three processes: turning, milling, and drilling. In reality, each process has its own White Space and Gray Space. These details may not be readily available, but the total time for an order to go through Fabrication may be known roughly. So, in Figure A.1 we add together the working times for the three operations to get the total Gray Space in Fabrication, and the remainder of the time in Fabrication is aggregated into one White Space. This approach is acceptable for initial analysis, following which it can be decided if more detailed data are needed in any area.
Figure A.1 illustrates the typical situation, in that Gray Space (working time) is usually a very small proportion of total MCT.
Experience with hundreds of projects in manufacturing companies has shown that Gray Space is typically less than 5% of MCT. In some instances, particularly with companies making large batches of products, the Gray Space can even be less than 1%. In other words, only during a very small amount of a job’s total MCT is someone actually working on that job! Projects in other industries, such as insurance and healthcare, have shown that the Gray Space is often less than 20%—and many times less than 10%—in other types of businesses as well.
Thus, right off the bat, an MCT Map usually provides an important insight to the management at a company. To see this, consider that traditional cost-reduction or efficiency-improvement approaches focus on reducing the working time for processing jobs. Since the Gray Space is a tiny fraction of the MCT, these traditional approaches typically have limited impact on lead time. The MCT Map therefore shows that management needs to think outside the box of traditional cost/efficiency approaches if it wants to significantly reduce lead time. (One such approach that targets lead time reduction using methods that are different from the traditional cost/efficiency approaches is Quick Response Manufacturing or QRM; see Appendix B.)
Not the Same as a Gantt Chart or PERT/CPM Analysis
Traditionally, stocks of raw material or pre-built components are used to reduce lead time to the customer, so a point that confuses people is why time spent in inventory increases the MCT value. Another confusion arises because one of the MCT rules states that components need to be built “from scratch.” So, if we are building those components, why do we need to add the time sitting in inventory? A third misunderstanding is that people familiar with project management methods see the words “critical path” in MCT and assume that it is a variation of the Critical Path Method (CPM) or the related method of PERT (Program Evaluation and Review Technique). A final misconception that occurs is when seasoned Industrial Engineers take a cursory look at an MCT Map and say, “This is the same as a Gantt Chart, so what’s new here?”
The answer to all these lies in the fact that MCT is not a metric for physical lead time to a customer. Since CPM, PERT, and the Gantt Chart are all tools used for scheduling or project management, they have to work with actual, physical lead times. MCT is indeed a time-based metric, but it is a metric that quantifies the total system-wide waste and displays all the opportunities for improvement. Everyone knows that inventory consumes capital and occupies space, but as shown in the next section, “The Business Case for MCT” the waste due to MCT is much more and involves many overhead activities.
An example shows how both the above points (stock and “from scratch”) add together in a worst-case situation. Suppose your customer’s products are failing in the field and the root cause is found to be a component supplied by you. Analysis by your engineers shows that this component cannot be reworked; it has to be made with a new design. Now, all existing stocks will need to be scrapped. Plus, you will have to go through all the fabrication processes “from scratch.” Hence, by adding together the values of the stock and the “from scratch” times, the MCT metric quantifies the full magnitude of this entire effort.
Note that since there is no work being done on parts while they are sitting in any type of inventory, the time spent in inventory is always classified as White Space.
The Business Case for MCT
While everyone has heard that “time is money,” time (as measured by the MCT metric) is actually a lot more money than most managers realize! Long MCTs add layer upon layer of overhead and indirect costs, much more than managers anticipate. Industry projects have shown that reducing MCTs results not only in quick response to customers, but also in lower costs and improvements in other metrics.
This happens because MCT is a strong indicator of enterprise-wide waste. Consider an extreme situation: if all the MCTs in your organization were reduced by 90%, what are all the activities, resources, and systems that are in place today that could be reduced, simplified or eliminated altogether? Also, what are the new opportunities that might be available to your business? Stop here for a moment and make a list of answers to these two questions for your organization; then read further.
Activities/resources that could be reduced or eliminated include planning, forecasting, warehousing, inventories, expediting of late jobs, rescheduling, and more. If these items could be reduced or even eliminated if your MCTs were shorter, they represent “waste” in your enterprise because of long MCTs. New opportunities from short MCTs could include increasing sales through rapid delivery of existing products, and gaining market share through rapid introduction of new products. Again, these opportunities are being missed (or “wasted”) today, because of long MCTs.
Does reducing MCT really help to trim down these “wastes”? Experience with hundreds of projects has shown that the waste reduction is substantial, and the resulting improvement in performance metrics is very significant. These results have been documented in conference presentations, industry publications, and books. Following are some examples (see “For Further Reading” for additional references).
Impact on On-Time Performance
Long MCTs have a dysfunctional impact on the accuracy of planning, forecasting, and scheduling, resulting in poor delivery performance. MCT reduction can dramatically improve on-time delivery performance.
A supplier of hydraulic valves reduced its MCT by 93%, and its on-time delivery improved from 40% to 98%. A manufacturer of wiring harnesses reduced MCT by 94% and its on-time delivery rose from 43% to 99%. (These examples also illustrate the huge opportunity for MCT reduction that exists in organizations—over 90%!—because most of the MCT consists of White Space.)
Impact on Quality
A long MCT hides numerous quality problems throughout your enterprise and supply chain. Conversely, as MCT is reduced, quality issues are discovered quickly, root causes can be found, and improvements put in place.
The above supplier of hydraulic valves, after reducing MCT by 93%, witnessed reductions in quality rejects from 5% to 0.15%. A company making seat assemblies reduced MCT by 80% and saw its rework rate plummet from 5.0 to 0.05%. These are not incremental improvements; they represent 30-fold to 100-fold reductions in defect rate!
Impact on Cost
As enterprise-wide waste is eliminated, this impacts overall operating costs. Less time is spent on planning, scheduling, expediting, and so on. Fewer resources are involved in warehousing and material handling. There is less investment in inventory, space, and possible obsolescence of materials. As these results cumulate over time, companies see significant reductions in cost. (Here “cost” refers to total product cost, including overhead.) The wiring harness manufacturer documented a 20% reduction in product cost, and the seat assemblies company experienced a 16% reduction.
National Oilwell Varco (NOV) makes oil drilling equipment, with annual sales of over $20 billion. At its factory in Orange, California, NOV reduced the MCT of a product line from 75 to 4 days. When the project was evaluated, management found that the cost of that product line had also been slashed by 30%!
Note that traditional accounting methods do not adequately take into consideration the cost impact of MCT, which can therefore impede the financial justification and hence implementation of strategies to reduce MCT. However, a recent book, The Monetary Value of Time, provides a novel framework for assessing the value of MCT in terms of organizational strategy and competitive advantage (see “For Further Reading”). This framework enables companies to develop MCT-based metrics and accounting methods to ensure that their cost accounting and financial justification approaches support MCT reduction efforts.
Impact on Profitability
Nicolet Plastics (Mountain, Wis.) decided to focus on MCT reduction as a key strategy. The results, in just three years, were nothing short of amazing. According to Joyce Warnacut, Chief Financial Officer, “The most impressive impact … has been on Nicolet Plastics’ earnings before interest and taxes (EBIT). The EBIT for 2012 alone was roughly equal to the EBIT for the 10-year period from 2000 through 2009 combined!”
Impact on Productivity and Market Share
RenewAire in Madison, Wisconsin, makes Energy Recovery Ventilation Systems. Chuck Gates, President, decided to focus on MCT reduction, and with his team he reduced MCT by over 80%. Even though RenewAire, a small company, was competing with international giants, it was able to increase its market share by 42% over five years. At the same time, the company significantly improved its productivity; while its revenue grew by 140%, it required only a 73% increase in total employees for this growth in sales.
Phoenix Products Company, Milwaukee, Wisconsin, manufactures industrial lighting for applications that include lighting of mines, shipyards, and monuments. Phoenix was struggling with long lead times, late deliveries, and rising costs, all of which provided opportunities for competitors from low-cost countries. In 2004, Scott Fredrick, CEO, decided to focus on MCT reduction. By 2013, MCTs across all product lines had been reduced by 50% along with impressive improvements in other metrics: compared with 2004, by 2013 Phoenix had achieved a 70% increase in revenue per labor hour, and a 30% reduction in overhead. During the same period Phoenix gained substantial market share: its sales grew at an average annual rate of 12.4%, versus 2% for the industry as a whole.
Impact on Space and Office Productivity
Elimination of wasted resources and activities can result not only in reduced costs but also increased output with the same resources. Alexandria Industries in Alexandria, Minnesota, provides custom aluminum extrusions. In 2002, the President, Tom Schabel, decided to focus on MCT reduction. By 2012, Alexandria Industries had reduced its MCT for extrusions by 83%, from six weeks to five days, and realized a 58% increase in revenue per square foot.
As mentioned in several places in this appendix, MCT is not just a metric for parts production and shop floor operations; it can be applied to other business processes. Alexandria Industries reduced MCT in the office by 50% to 75% for processes such as estimating, quoting, and order processing, and over the same time period it experienced a 62% increase in business handled per office employee in those areas.
MCT Maps Help Visualize Data for Complex Operations
An MCT map is a powerful way to communicate insights from an MCT analysis. The MCT map can also help with getting buy-in from management and employees on improvement opportunities.
We now show how to make an MCT Map for a more complex operation, along with the insights that this map provides. Madison Ventilation Products (MVP), a hypothetical company, is engaging in improvement projects. For one of the projects, the improvement team decides to focus on the product line “MVP Industrial Fans,” including the main fabrication/assembly operations and the first-level supply chain for three purchased items. Following are the results of data gathering. Refer to Figure A.2, starting at the top-right corner. Incoming orders are processed through Office Operations, which take an average of nine days, of which one day is working time. We will use the abbreviation [9(1) days] from here on, to denote [total (working) days]. (All data have been converted to calendar days here). The supplied components are Forgings [36(3) days], Sheet Metal [9(1) days], and Motors [29(3) days]. Incoming material for these items is stored in a warehouse (WH) for 13, 4, and 11 days, respectively. In-house operations involve fabricating Fan Blades [14(1) days] and Enclosures [9(1) days]. These are placed in a staging area (Stg.) where they wait [3 and 2 days], before going through Assembly [3(0.5) days]. Completed Fans are stored in a Finished Goods area [13 days], then Packed [1(0.25) day] and Shipped [2(2) days] to the Customer.

Figure A.2Process map for MVP industrial fans.
Figure A.3 shows the MCT Map for MVP Industrial Fans. To understand the MCT Map, start with Figure A.2 and trace the three paths going counter-clockwise from the Customer and back to the Customer. Next, trace each of these paths starting from the left side of the MCT Map in Figure A.3 and follow each of the bars for the components. Note that Office Operations are common to each path and are repeated in each bar. The vertical line indicates that these components are supplied to Assembly (it helps visualize the bill-of-materials). On each path, working times are shown as Gray Space and the remaining times as White Space. The MCT Metric for MVP Industrial Fans is derived from the longest path and equals 94 days. To see this, trace these numbers in Figure A.2 for the path with Forgings: 9 + 36 + 13 + 14 + 3 + 3 + 13 + 1 + 2 = 94. As explained earlier, the MCT Map does not need to cover details for the whole company, it can be used to look at a subset of the operations; here, this map is for MVP Industrial Fans only.

Figure A.3MCT map for MVP industrial fans.
Comparison with Value Stream Mapping (VSM)
Value Stream Mapping (VSM) is a popular tool used for improvement projects. However, in the initial project stages, MCT Mapping has several advantages over VSM:
An MCT Map is simpler, and provides an easy-to-see, high-level view of the operation: compare the example of a Value Stream Map in Figure A.4 with the MCT Map in Figure A.3.
An MCT Map represents time proportionally. In the VSM in Figure A.4 it is not easy to pick out the largest segments of time, while in the MCT Map these segments jump out at you. So, the MCT Map helps to target the largest opportunities (White Space).
An MCT Map visually highlights the large amounts of White Space versus the small amounts of Gray Space, emphasizing the need to focus on the White Space.
An MCT Map identifies the critical path, ensuring that improvements are targeted at processes that will make a significant difference. Note: the scale (X-axis) goes from right to left for a reason: you can easily read off the lengths of the other paths to know when another path might become critical.

Figure A.4Example of Value Stream Map (VSM).
Note, however, that the two approaches are not contradictory; in fact, they can be complementary. You should begin with MCT Mapping because it shows you the forest before you look at the trees. But once you determine that you need to focus on an area, you could develop a detailed VSM for that area. Or, if you already have a VSM, you can convert the data to quickly make an MCT Map (see “For Further Reading”); this will help you get insights into where to focus your project.
Using MCT in Supply Management and in Other Industries
Modern approaches to supply management emphasize not only supplier performance but also supplier improvement, so it is important to have metrics that support both these aspects. Surprisingly, the traditional metrics are not as effective as one might think! When added as a metric for suppliers, MCT can complement the long-standing trinity of supply management metrics of Quality, Cost, and Delivery (QCD), and assist with strategic supply management initiatives (see “For Further Reading”). Suppliers with long MCTs should be encouraged to engage in activities to reduce their MCT. These MCT reductions will result in higher quality, lower cost, and improved on-time delivery; all of these will benefit the customer as well.
MCT should also be a factor in sourcing decisions. A supplier with short MCT should be given some preference over one with a long MCT, even if the latter has lower cost. This is because a supplier with long MCT results in a number of hidden costs, both in its own operation as well as in the customer’s operation. Since MCT includes logistics time, this also implies giving preference to local suppliers over those that are half-way around the world.
Although MCT originated in manufacturing, it can be applied in other industries. MCT Maps have been used for insights into Healthcare operations, for example, Patient flow through an Emergency Room (ER), and in the Insurance Industry, for example, to illustrate the flow for Claims Processing.
Motivating Teams to Drive MCT Reduction
Earlier in this appendix, we described how reducing MCT has resulted in manifold benefits at companies. Hence, as part of their continuous improvement programs, organizations should encourage their teams to reduce MCT. An MCT-based metric that helps motivate MCT reduction is the QRM Number, defined as follows:

The two quantities on the right side of the equation denote the average MCT measured over an initial (base) period and the average MCT achieved during the current performance period. (The acronym QRM comes from Quick Response Manufacturing; see Appendix B.)
Using the QRM Number has several advantages over using the raw MCT values for teams, as illustrated by an example. Suppose an improvement team starts with an average MCT of 12 days. During the next three evaluation periods it reduces this to 10 days, then 8 days, and finally to 7 days. Table A.1 shows the values of both MCT and the QRM Number, along with the calculation details.
Period |
MCT |
Calculation |
QRM Number |
|---|---|---|---|
1 |
12 days |
(12/12) × 100 |
100 |
2 |
10 days |
(12/10) × 100 |
120 |
3 |
8 days |
(12/8) × 100 |
150 |
4 |
7 days |
(12/7) × 100 |
171 |
The advantages of using the QRM Number over the “raw” MCT values for the purpose of motivating teams are:
Reducing MCT results in an increasing QRM Number. Figure A.5 graphs a team’s progress over time as measured by both raw MCT and the QRM Number. Improvements by the team result in the MCT curve going down, but the QRM Number curve going up. Literature on motivation shows that people react more favorably to a graph going up than to one going down. Thus, the QRM Number graph better motivates the desired behavior (MCT reduction).
Equal reductions of lead time in the future result in larger increases in the QRM Number. The team reduced MCT by two days in the second period, and again by two days in the third period (equal improvements in MCT). However, the team was rewarded by a 20 “point” increase in QRM Number in the second period but 30 points in the third period. This makes sense because (i) proportionally, there is a larger reduction in the third period, but also (ii) at first it is easy for teams to find a lot of “low-hanging fruit,” but then it gets harder to find ideas for improvement. This remark leads to the next advantage.
As MCT reduction gets increasingly difficult, the QRM Number continues to motivate teams. Figure A.5 shows that while the MCT graph starts to flatten out, the QRM Number graph continues to rise significantly, thus motivating the team to keep improving. Table A.1 shows that although the team got 20 points for the second-period improvement of two days, it actually gets more points (21) for the fourth-period improvement of just one day!
The QRM Number provides a single measure that can be used throughout the organization regardless of the type of work. For example, if an organization has improvement teams working in various office operations as well as several shop floor areas, the progress of all the teams can be easily compared by tracking their QRM Numbers.

Figure A.5Graphs of MCT and QRM Number for a team.
The QRM Number can also be used in Supply Management initiatives as described in the previous section. Using the QRM Number for suppliers helps to support supplier improvement projects using a time-based metric.
Summary: MCT Map and Metric Provide Clear Goal
Improvement projects can lose focus because they have multiple goals such as targets for cost, quality, efficiency, on-time delivery, and so on. These goals might conflict, and thus drive teams in different directions. In contrast, the MCT Map and MCT Metric supply a clear goal for a project: the MCT Metric provides a single number, and the goal is simply to reduce this number to a target derived from opportunities seen in the MCT Map. The justification for using this simple and unified goal was provided in the earlier section on “The Business Case for MCT”—namely, when MCT is reduced, key performance metrics improve.
For Further Reading
As background to the additional readings below, I would like to acknowledge the contributions of Paul Ericksen, who provided the original insight that resulted in the MCT metric. Paul worked with this author and the author’s students at the University of Wisconsin to lay the foundations for MCT and prove its use. Numerous students, professionals, and companies were involved with applying MCT and providing practical experiences that helped sharpen its definition and use. The following two-part series provides a perspective on the origins of MCT, how it proved its worth at a Fortune 500 company, and results from hundreds of projects.
“Lean’s Trinity,” by P.D. Ericksen, Industrial Engineer (Part I, October 2013, pages 39–43; Part II, November 2013, pages 29–32).
In the context of global supply chains and overseas sourcing, the next article explains the need for shifting to time-based supply management and the importance of using MCT as the key metric in this effort.
“Filling the Gap: Rethinking Supply Management in the Age of Global Sourcing and Lean,” by P.D. Ericksen, R. Suri, B. El-Jawhari, and A.J. Armstrong, APICS—The Performance Advantage, February 2005.
This booklet is a brief but comprehensive reference for practitioners on how to calculate and use MCT:
MCT Quick Reference Guide, by R. Suri, C&M Printing, 2014.
The next report justifies the use of MCT as a robust, unifying, and enterprise-wide metric to support order fulfillment and drive improvement projects. It contains rules for correctly converting Value Stream Maps to MCT Maps.
“Manufacturing Critical-Path Time [MCT]: The Enterprisewide Metric to Support Order Fulfillment and Drive Continuous Improvement,” by N.J. Stoflet and R. Suri. Technical Report, Center for Quick Response Manufacturing, University of Wisconsin–Madison, 2007.
The following book provides a novel framework for assessing the value of MCT in terms of organizational strategy and competitive advantage. This framework enables companies to develop MCT-based metrics and accounting methods to ensure that their cost accounting and financial justification approaches support MCT reduction efforts.
The Monetary Value of Time: Why Traditional Accounting Systems Make Customers Wait, by J.I. Warnacut, Productivity Press, 2016.