
Chapter 4
Trignometry for Animation
What we'll cover in this chapter:
- Colors on the canvas
- The drawing API
- Loading images
- Pixel manipulation
So far, the graphics drawn in the book example programs have used a few simple commands, and the “canvas drawing API” has been alluded to a number of times. But for the most part, the code has been provided without much explanation.
In this chapter, we look at creating visual content using the canvas element. Specifically, you'll see how to work with color using JavaScript, and take a brief tour of the canvas drawing API.
Colors on the canvas
Colors applied to the canvas element are specified using CSS-style strings, which can be formatted in a few ways:
"#RRGGBB"—Hexadecimal format, with red-green-blue components in the range 0-9, a-f."#RGB"—Hexadecimal format using short notation, is converted into the six-digit form by copying the component values, not by adding 0. E.g.,"#fb0"becomes"#ffbb00"."rgb(R, G, B)"—Functional notation format, with red-green-blue components as integers in the range 0-255."rgba(R, G, B, A)"—Functional notation format with alpha, is the same as the previous string, but the alpha value is a decimal number in a range of 0-1. If a color requires transparency, this is the format you must use.
Although the final color value is serialized as a string, you may want to manipulate individual color components as numbers. So you must convert the JavaScript types using a few parsing and concatenation techniques. After this is demonstrated, a pair of utility functions are introduced later in the chapter that will make this process easier, and are used throughout the book examples.
A color value can be any integer from 0 to 16,777,215 for what is called 24-bit color. That number is significant because there are 256 × 256 × 256 possible color values. The canvas element uses RGB color, which means that every color is described by its red, green, and blue components. Each of these component values can be an integer from 0 to 255. So, there are 256 possible shades each of red, green, and blue, resulting in the nearly 16.8 million colors.
This system is called 24-bit color because it takes eight bits—ones or zeros—to represent the number 256. Eight bits times three (red, green, and blue) means it takes 24 bits to represent the 16.8 million possible colors. Additionally, there is a 32-bit color system, which uses an extra value for transparency.
Now, because it's difficult to visualize what color 16,733,683 looks like, developers often use another system of representing such numbers: hexadecimal. If you've used color values in HTML, this should be familiar to you, but let's cover the basics anyway.
Using hexadecimal color values
Hexadecimal, or hex, is a base 16 system. In other words, each digit can be from 0 to 15, rather than 0 to 9 as in the usual base 10 (decimal) system. Since there are not any single digits to represent the numbers 10 to 15, we borrow the first six letters of the alphabet, A to F. So, each digit in a hex number can be from 0 to F. (In JavaScript, hex values are not case-sensitive, so you can use A through F or a through f.) To signify that we are using a hex number with the HTML canvas element, we prefix the string with the character '#'. In JavaScript, as with many other languages, we add a prefix 0x to the number. For example, the number 0xA is equal to decimal number 10, 0xF is equal to 15, and 0x10 is equal to 16. Respectively, the HTML hexadecimal string representations of these values would look like: '#A', '#F', and '#10'.
In decimal, each digit is worth ten times the digit to its right; so, the number 243 means two times 100, four times 10, and three times 1. In hex, each digit is worth 16 times its right-hand neighbor. For example, 0x2B3 means two times 256, B (or eleven) times 16, and three times 1.
For 24-bit colors, this goes all the way up to 0xFFFFFF, and, if you do the math, is equal to 16,777,215. Furthermore, those six hex digits can be separated into three component pairs. The first pair represents the red component, the second pair represents the green, and the last two digits represent blue. This is often referenced as 0xRRGGBB. (You would never put R, G, or B into an actual hex number; this is merely a symbolic way of telling you what color channel each digit controls.)
Remember that each component color can have a value anywhere from 0 to 255, or in hex, 0x00 to 0xFF. Thus, the color red can be represented as 0xFF0000, which denotes full red, zero green, and zero blue. Likewise, 0x0000FF is completely blue.
If you take the earlier mentioned example number, 16,733,683, and convert it to hex (you will see an easy way to do that), you get 0xFF55F3. You can easily separate the components into red = FF, green = 55, and blue = F3. Examining these values, you see that the red and blue are rather high, and green is much lower. So you can guess that this color is purplish, which is something you can't easily determine from the decimal value.
For any JavaScript operation that requires a number, it doesn't matter which format you use, decimal or hex. The numbers 16733683 and 0xFF55F3 have the same value; it's just that one is more readable to us humans. However, when working with the canvas element, you must remember to convert whichever numeric format into a proper CSS-style string.
You might wonder how to convert between these formats. Well, converting from hex to decimal is easy—just print the value. The console.log function in your debugging console prints to decimal for you:
console.log(0xFF55F3);
This prints 16733683. To see the hexadecimal representation of a decimal number, use the Number.toString method, specifying 16 as the radix:
var hex = (16733683).toString(16);

console.log(hex);
As the method name indicates, this converts the number to a string, and prints out the hexadecimal ‘ff55f3’. To use that value as a CSS-style formatted string, prepend the '#' character:
var hexColor = '#' + (16733683).toString(16);
This sets hexColor to a string value of '#ff55f3'. To convert this back into a decimal number, first chop off the '#' character at the beginning of the string using the String.slice method, then pass the remaining string to the built-in function window.parseInt, with a radix of 16:
var color = window.parseInt(hexColor.slice(1), 16);

console.log(color);
This prints out the number 16733683, and you can see we're right back where we started.
Combining colors
Let's say you want to combine three red, green, and blue numbers to form a valid overall color value. If you have three variables, red, green, and blue, and each of them holds an integer value from 0 to 255, here's the formula to do just that:
color = red << 16 | green << 8 | blue;
For example, to create the purple color value from separate components, set the red value to max, or 0xFF (decimal 255), the green component to 0x55 (decimal 85), and the blue value to 0xF3 (decimal 243):
This sets color to a value of 16733683, which is equal to the hex value 0xFF55F3. This formula uses two bitwise operators you might not have used before. Bitwise operators manipulate numbers on a binary level—on the ones and zeros. We look at how they work in the next section.
Bitwise combination
If you were to list the bits of a 24-bit color value, you would have a string of 24 ones and zeros. Breaking up the hex 0xRRGGBB into binary, there are eight bits for red, eight for green, and eight for blue:
RRRRRRRRGGGGGGGGBBBBBBBB
In the previous color combination formula, the first bitwise operator is <<, which is the bitwise left-shift operator. This shifts the binary representation of the value to the left by the specified amount of places. A red value of 0xFF, or decimal 255, can be represented in binary as follows:
11111111
Shifting it 16 places to the left gives you the following:
111111110000000000000000
As a 24-bit color number, this is red. In hex, this is 0xFF0000—again, red. Now, a green value of 0x55 (decimal 85) looks like the following in binary:
01010101
Shift this eight places, and you get this:
000000000101010100000000
The original eight bits now fall completely in the green range.
Finally, a blue value of 0xF3 (decimal 243) is this in binary:
11110011
Because these bits already fall into the blue range, you don't need to change it.
Now you have three values for red, green, and blue:
111111110000000000000000

000000000101010100000000

000000000000000011110011
You can add the values together to get a single 24-bit number, but there's a simpler way: Use the bitwise OR operator, the | symbol. This compares the digits of two numbers on a binary level and if either digit is equal to one, the result will be one. If both digits are zero, the result is zero. You can use OR for the red, green, and blue values together to say, “If this OR this OR this is one, the result is one.” This joins the three components into a single color value—and is readable once you understand how the operators work. Combine the example values and you get this result:
If you convert that to hex, you get 0xFF55F3. Of course, in JavaScript, you never see the bits or deal with the ones or zeros at all. You just write this:
var color = 0xFF << 16 | 0x55 << 8 | 0xF3;
Or, if you are working with decimal values, you can use this form:
var color = 255 << 16 | 85 << 8 | 243;
Again, it doesn't matter whether you use hex or decimal numbers; it's the same value.
Extracting component colors
You might have a color from which you want to extract the individual component values. Here's the formula to extract the red, green, and blue values from a composite color value:
red = color >> 16 & 0xFF;

green = color >> 8 & 0xFF;

blue = color & 0xFF;
If the value of color is 0xFF55F3, then red will be set to 255, green: 85, and blue: 243. Again, this formula uses two bitwise operators, which we walk through in the next section.
Bitwise extraction
In the previous formula, you probably guessed that >> is the bitwise right-shift operator, which shifts the bits so many places to the right. You can't have fractional bits, so any bits that are shifted too far right are discarded. Looking at the color value in binary representation, and beginning with red:
111111110101010111110011
When you shift the color value 16 places to the right, it becomes this:
11111111
This is simply 0xFF, or 255. For green, shift the color value eight places, and you get this:
1111111101010101
Here, you knocked the blue values out, but you still have the red ones hanging around. This is where you use another bitwise operator, &, which is called AND. Like OR, this compares two values, but says, “If this digit AND this digit are both one, then the result is one. If either one is zero, the result is zero.” You compare the value to 0xFF, so you compare these two numbers:
1111111101010101

0000000011111111
Because all the red digits are compared with zero, they all result in zero. Only the digits that are both one fall through, so you get this:
0000000001010101
This is the value 0x55. With blue, you don't need to shift anything. Just AND it with 0xFF, which preserves the blue and knocks out the red and green. This returns the value 0xF3.
Transparency
If you want to apply a color with transparency to the canvas element, you must use a string formatted in the CSS-style functional notation: “rgba(R, G, B, A)”. In this format, the red-green-blue components are integer values in the range of 0-255, whereas the alpha component is a decimal number in the range of 0-1. An alpha value of 0 is completely transparent, whereas a value of 1 indicates a color that is fully visible. For example, a color containing an alpha value of 0.5 has 50% opacity.
If you work with separate color components, you must concatenate them into a properly formatted string to use the color with the canvas element. For example:
var r = 0xFF,

    g = 0x55,

    b = 0xF3,

    a = 0.2,

    color = "rgba(" + r + "," + g + "," + b + "," + a + ")";


console.log(color);
This assembles and prints the string: “rgba(255,85,243,0.2)”, which represents a light-purple color, at 20% visibility, properly formatted to use with the canvas element.
Because these types of conversions are rather bothersome, we create a couple of utility functions to simplify this process in the next section.
Color utility functions
Now that we explained the process of combining and extracting color components, we create a pair of utility functions to do the work for us. This gives us a succinct way to convert color values from numbers to strings, and back again, while keeping the sample code uncluttered. Often when animating the canvas element, you need to manipulate the numeric color values using JavaScript, then format them as a CSS-style string.
The first utility function, utils.colorToRGB, takes a color value as an argument—as a number or hexadecimal string—and extracts its individual red, blue, and green components. Then, it concatenates them into a CSS-style string using the functional notation, which it returns. Additionally, the function accepts a second, optional, argument to indicate an alpha value, which is a decimal number between 0 and 1.
For example, passing the hexadecimal number 0xFFFF00 or string "#FFFF00" to utils.colorToRGB returns a string value: "rgb(255,255,0)". If we call it with an alpha value like utils.colorToRGB(0xFFFF00, 0.5), it returns "rgba(255,255,0,0.5)", which is the format that the canvas element is looking for.
Add the function to our global utils object and include it in the utils.js file, which we import in our documents. Remember, you can download this script, like all the other code in this book, from www.apress.com. Here's what the function definition looks like:
utils.colorToRGB = function (color, alpha) {

  //if string format, convert to number

  if (typeof color === 'string' && color[0] === '#') {

    color = window.parseInt(color.slice(1), 16);

  }

  alpha = (alpha === undefined) ? 1 : alpha;


  //extract component values

  var r = color >> 16 & 0xff,

      g = color >> 8 & 0xff,

      b = color & 0xff,

      a = (alpha < 0) ? 0 : ((alpha > 1) ? 1 : alpha); //check range


  //use 'rgba' if needed

  if (a === 1) {

    return "rgb("+ r +","+ g +","+ b +")";

  } else {

    return "rgba("+ r +","+ g +","+ b +","+ a +")";

  }

};
The second utility function is simple, but saves us some headache when converting colors back and forth between numbers and strings. The function, utils.parseColor, converts a color number value to a hexadecimal formatted string, or can convert a hexadecimal formatted string to a number.
Calling the function with a hexadecimal number like utils.parseColor(0xFFFF00), returns the string value: "#ffff00". Passing a CSS-style hexadecimal string returns the same string unmodified. The function also accepts a second, optional, parameter toNumber, which if set to true, returns a numeric color value. For example, calling utils.parseColor("#FFFF00", true) or utils.parseColor(0xFFFF00, true), both return the number 16776960.
This function enables us to use numbers when we need to, and easily convert back to the properly formatted strings that the canvas element requires. Again, we add this function to the utils global object in the file utils.js:
utils.parseColor = function (color, toNumber) {

  if (toNumber === true) {

    if (typeof color === 'number') {

      return (color | 0); //chop off decimal

    }

    if (typeof color === 'string' && color[0] === '#') {

      color = color.slice(1);

    }

    return window.parseInt(color, 16);

  } else {

    if (typeof color === 'number') {

      //make sure our hexadecimal number is padded out

      color = '#' + ('00000' + (color | 0).toString(16)).substr(-6);

    }

    return color;

  }

};
These utility functions are provided only for convenience, because you already know how they work from the previous sections. Perhaps you'll create a different function, or write the conversion explicitly in your own code, but they're here if you need them.
Now that you know how colors work in JavaScript and the canvas element, let's start using them.
The Drawing API
An API, or application programming interface, generally refers to the methods and properties that you can use in your program to access a collection of related functionality that is provided for you. In particular, the canvas drawing API is the properties and methods that enable you to draw lines, curves, fills, and so on, using JavaScript. This API has only a few methods, but they provide the foundation for all the animation we create in this book. Here are some of the commands we look at:
- strokeStyle
- fillStyle
- lineWidth
- save()
- restore()
- beginPath()
- closePath()
- stroke()
- lineTo(x, y)
- moveTo(x, y)
- quadraticCurveTo(cpx, cpy, x, y)
- bezierCurveTo(cp1x, cp1y, cp2x, cp2y, x, y)
- arcTo(x1, y1, x2, y2, radius)
- arc(x, y, radius, startAngle, endAngle [, anticlockwise])
- createLinearGradient(x0, y0, x1, y1)
- createRadialGradient(x0, y0, r0, x1, y1, r1)
- clearRect(x, y, width, height)
- fillRect(x, y, width, height)
Because this chapter serves as an overview for you to get the foundation to work through the rest of the book, we won't go into the details for each method. For a more exhaustive treatment of the canvas drawing API, see the specification at http://developers.whatwg.org/the-canvas-element.html, or read one of the more detailed guides listed at the beginning of this book.
The canvas context
Every canvas element contains a drawing context, an object that exposes the drawing API. To access the context, use the following code:
var canvas = document.getElementById('canvas'),

    context = canvas.getContext('2d'),
The first line uses the DOM interface to find our canvas element with an id of 'canvas'. Call this object's method getContext with the string argument '2d', which specifies the type of drawing API to use.
It's worth mentioning, this is the only standardized drawing context at the time of this writing. Although some vendors have experimented with a 3D API, this has not been implemented across browsers and is not part of the HTML5 specification.
Now that we have our canvas element and access to its context, we can start drawing with it!
Removing the drawing with clearRect
In most animations, we must clear the canvas every frame before drawing something else, which is how we simulate motion. By drawing something, erasing it, and drawing it someplace else, we can make a series of images look like a single object that has moved, rather than two frames displayed sequentially.
The method context.clearRect(x, y, width, height) clears the specified rectangle by erasing every pixel inside it, setting them to transparent black. As such, any previously drawn graphics, such as lines or fills, will no longer be visible. Because we use this method to clear entire animation frames, you will see it called in the examples like this:
context.clearRect(0, 0, canvas.width, canvas.height);
This creates a rectangle the size of the entire canvas element and positions it at the canvas origin, clearing everything that was previously drawn.
This is a complete canvas clear, but there are a few optimizations to consider. If you know that an animation will only affect a portion of the frame, you can specify a smaller rectangle in clearRect to save some processing. It's also possible to stack multiple canvas elements on top of each other. Because they're transparent, you see the composite image. This can be useful if you have a background image that you do not want to draw every frame. You can just place it as a background canvas or image element and animate over top of it.
Setting the line appearance
The context has a number of properties that change the appearance of subsequently drawn lines. Changing these properties does not affect previously drawn lines. Other than clearing them or drawing on them, there is no way to affect lines and fills that have already been drawn.
The most common line style properties you use are the color and width of the line:
strokeStyle: This property is used for setting the line color. The value can be a color value (CSS-style string), a gradient object, or a pattern object. By default, the line color is black:"#000000".lineWidth: This sets the line thickness from the path. So if using the default value of 1, the line width would extend a half-pixel to both sides; you cannot draw the line inside or outside of this path.lineWidthmust be a positive number.
There are some additional line style properties, but we just use their default values in this book:
lineCap: How the end point of each line is drawn, if it's flat, round, or sticks out. Possible values arebutt,round, andsquare, withbuttas the default.lineJoin: Determines how connecting segments are joined together, or how the “elbow” of the connection is drawn. Possible values areround,bevel, ormiter, withmiteras the default.miterLimit: When used withlineJoinset tomiter, this property determines how far the outside connection point will be placed from the inside connection point. It must be a finite number greater than 0, and the default value is 10.
To jump between different styles, use the methods context.save() and context.restore(). context.save() pushes the current state of the canvas onto a stack. This includes styles, such as strokeStyle and fillStyle, and also transformations that have been applied to the canvas. Additional style changes will be applied to subsequent draw commands. To return to the previous canvas state, call context.restore() to pop the current state off the stack and use the next one.
Drawing paths with lineTo and moveTo
There are a couple of different ways to implement line drawing in a graphics language. One is to have a line command that takes a starting point and an ending point, and draws a line between them. The other way is to have a lineTo command that takes a single point: the ending point of the line. This is how the canvas drawing API works, and it stores this information in a path.
The canvas context always has a current path, and there is only one current path. A path has 0 or more sub-paths, each consisting of a list of points connected by straight or curved lines. A closed path is one where its last point is connected to its first point by a straight line. To indicate that you're starting a new drawing path, call context.beginPath(). Because a path is just a list of positions for a line, to render it to the canvas you call context.stroke().
You move the path's position around on the canvas and draw lines to it. Because we need to start somewhere to draw from, we first move to point 0, 0 in this example:
On the canvas, there's now a line drawn from the top-left corner (0, 0), to 100, 100. After you draw a line, the ending point for that line is the starting point for the next one. Or, you can use the method context.moveTo to specify a new starting point for the next line.
Think of the drawing API as a robot holding a pen on a piece of paper. First, you move the pen to the start position at 0, 0. When you tell the robot to draw a line to a point, it moves the pen across the paper to that new position. For each new line, it moves from wherever it left off, to the next new point. context.moveTo is like saying, “Okay, now lift up the pen and move it to this next point.” Although it does not result in any new graphic content, it will affect how the next command is carried out. You generally call context.moveTo as your first graphics command to place the drawing API “pen” where you want to begin.
You now have enough drawing commands to do something interesting. Let's create a simple drawing program that will rely on the canvas drawing API for its content. Here's the example:
<!doctype html>

<html>

 <head>

  <meta charset="utf-8">

  <title>Drawing App</title>

  <link rel="stylesheet" href="style.css">

 </head>

 <body>

  <canvas id="canvas" width="400" height="400"></canvas>

  <script src="utils.js"></script>

  <script>

  window.onload = function () {

    var canvas = document.getElementById('canvas'),

        context = canvas.getContext('2d'),

        mouse = utils.captureMouse(canvas);


    function onMouseMove () {

      context.lineTo(mouse.x, mouse.y);

      context.stroke();

    }

    canvas.addEventListener('mousedown', function () {

      context.beginPath();

      context.moveTo(mouse.x, mouse.y);

      canvas.addEventListener('mousemove', onMouseMove, false);

    }, false);


    canvas.addEventListener('mouseup', function () {

      canvas.removeEventListener('mousemove', onMouseMove, false);

    }, false);

  };

  </script>

 </body>

</html>
You can find this file among the book's downloadable files (available from www.apress.com) as 01-drawing-app.html. In addition to the drawing functions, this program makes good use of event handlers (discussed in Chapter 2). Let's go through it piece by piece.
The example is based on the skeleton document found in Chapter 2, which you should be used to by now. At the top of the script, it uses the utility function utils.captureMouse to keep track of the mouse position. We imported this from the file utils.js. Event listeners for the mousedown and mouseup events are also added.
The mousedown event handler gets called whenever the user presses a mouse button on the canvas element; this is when the user wants to start drawing a line at the current mouse cursor position. The handler starts a new path and puts the virtual pen down at the mouse location by calling context.moveTo and passing in the mouse coordinates. It then adds a listener for the mousemove event.
At this point, every time the user moves the mouse, the onMouseMove function is called. It's the core of the program, but is simple. It draws a line to the current mouse location and strokes the path outline.
Finally, there's the mouseup event handler, which removes the mousemove handler so that nothing else is drawn to the canvas.
This is a fun little sketching program. If you set up some simple controls, you can build it into a full-featured drawing application. Create variables for color and width, use some HTML form elements to change them, and set the strokeStyle and lineWidth properties with the new values. But this left as an exercise for you to do on your own, if you are interested.
Drawing curves with quadraticCurveTo
The canvas drawing API provides a number of methods for drawing curves on a path. In the next couple of examples, we look at the method context.quadraticCurveTo, which connects two points with a curve using a control point. It starts off the same as context.lineTo, in that it begins its drawing at the point where the last drawing ended, or at the point where the last context.moveTo command moved the pen to. It also uses line styles in the same way as context.lineTo. The only difference is the shape of the line drawn.
context.quadraticCurveTo(cpx, cpy, x, y) takes two points as arguments: The first is a control point that affects the shape of the curve, and the second is the ending point of the curve. The shape is determined by a standard algorithm known as a quadratic Bézier curve. This function calculates a curve from one point to another, curving toward—but never touching—the control point. It's more like the curve is attracted to it.
Let's see it in action in the following document, 02-drawing-curves.html:
<!doctype html>

<html>

 <head>

  <meta charset="utf-8">

  <title>Drawing Curves</title>

  <link rel="stylesheet" href="style.css">

 </head>

 <body>

  <canvas id="canvas" width="400" height="400"></canvas>

  <script src="utils.js"></script>

  <script>

  window.onload = function () {

    var canvas = document.getElementById('canvas'),

        context = canvas.getContext('2d'),

        mouse = utils.captureMouse(canvas),

        x0 = 100,

        y0 = 200,

        x2 = 300,

        y2 = 200;


    canvas.addEventListener('mousemove', function () {

      context.clearRect(0, 0, canvas.width, canvas.height);


      var x1 = mouse.x,

          y1 = mouse.y;

      //curve toward mouse

      context.beginPath();

      context.moveTo(x0, y0);

      context.quadraticCurveTo(x1, y1, x2, y2);

      context.stroke();

    }, false);

  };

  </script>

 </body>

</html>
Load this file in your browser and move the mouse around. The script has two preset points for the beginning and ending points, and uses the mouse position for the control point. Notice that the curve never reaches the control point, but gets about halfway there.
Curving through the control point
If you want the curve to hit a point, the following formula calculates a control point, so the curve goes through the point you specify. Again, you start with x0, y0 and x2, y2 as the end points, and x1, y1 as the control point. We call the point you want to curve through xt, yt (t for target). In other words, if you want the curve to be drawn through xt, yt, what x1, y1 do you need to use? Here's the formula:
x1 = xt * 2 - (x0 + x2) / 2;

y1 = yt * 2 - (y0 + y2) / 2;
Basically, you multiply the target by two, and subtract the average of the starting and ending points. You can graph the whole formula and see exactly how it works. Or, you can test it, see that it works, and assume that it always will.
To see it in action, using the mouse coordinates as xt, yt, you need to change only two lines from the previous example. Change the following lines:
x1 = mouse.x;

y1 = mouse.y;
to the following:
Or you can check out 03-curve-through-point.html, where we did it for you.
Creating multiple curves
Next, you might want to create multiple curves, where instead of a single curve, you have a long line that curves smoothly in several directions. First, here is the wrong way to solve this problem, which is a common first attempt. In this example, you start out with a number of points, draw a curve from the first through the second to the third, then through the fourth to the fifth, then through the sixth to the seventh, and so on. Here it is in code (in document 04-multi-curve-1.html):
<!doctype html>

<html>

 <head>

  <meta charset="utf-8">

  <title>Multi Curve 1</title>

  <link rel="stylesheet" href="style.css">

 </head>

 <body>

  <canvas id="canvas" width="400" height="400"></canvas>

  <script>

  window.onload = function () {

    var canvas = document.getElementById('canvas'),

        context = canvas.getContext('2d'),

        points = [],

        numPoints = 9;


    //array of random point objects

    for (var i = 0; i < numPoints; i++) {

      points.push({

        x: Math.random() * canvas.width,

        y: Math.random() * canvas.height

      });

    }


    //move to the first point

    context.beginPath();

    context.moveTo(points[0].x, points[1].y);


    //and loop through each successive pair

    for (i = 1; i < numPoints; i += 2) {

      context.quadraticCurveTo(points[i].x, points[i].y, points[i+1].x, points[i+1].y);

    }

    context.stroke();

  };

  </script>

 </body>

</html>
The first for loop in the window.onload function sets up an array of nine points. Each point is an object with an x and y property, and they are randomly placed on the canvas.
We begin a new path, and the pen is moved to the first point. The next for loop starts at one and increments by two each time, drawing a curve through point one to point two, then through three to four, then through five to six, and then through seven to eight. The loop stops there, which is perfect because point eight is the last one. There must be a minimum of three points, and the number of points must be odd.
It seems like a well-reasoned program, until you test it. As shown in Figure 4-1, it doesn't look curvy at all. In fact, it looks a bit spiky. The problem is that there is no coordination between one curve and the next, except that they share a point.
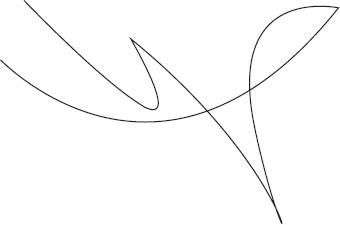
Figure 4-1. There are multiple curves going the wrong way. You can see where one curve ends and the next begins.
You must plug in a few more points to make it look right. Here's the strategy: Between each set of two points, you need a new point that sits exactly in the middle. You then use these as the starting and ending points for each curve, and use the original points as the control points.
Figure 4-2 illustrates the solution. In the figure, the white dots are the original points, and the black dots are the in-between points. You can see there are three context.quadraticCurveTo methods used here.
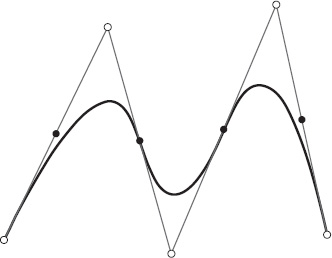
Figure 4-2. Multiple curves with midpoints
Notice in Figure 4-2 that the first and last midpoints are not used, and the first and last original points remain terminal points for the curves. You need to make in-between points only for the second point up to the second-to-last point. Here's an updated version of the previous random curves example (document 05-multi-curve-2.html):
<!doctype html>

<html>

 <head>

  <meta charset="utf-8">

  <title>Multi Curve 2</title>

  <link rel="stylesheet" href="style.css">

 </head>

 <body>

  <canvas id="canvas" width="400" height="400"></canvas>

  <script>

  window.onload = function () {

    var canvas = document.getElementById('canvas'),

        context = canvas.getContext('2d'),

        points = [],

        numPoints = 9,

        ctrlPoint = {};


    for (var i = 0; i < numPoints; i++) {

      points.push({

        x: Math.random() * canvas.width,

        y: Math.random() * canvas.height

      });

    }


    //move to the first point

    context.beginPath();

    context.moveTo(points[0].x, points[1].y);


    //curve through the rest, stopping at each midpoint

    for (i = 1; i < numPoints - 2; i++) {

      ctrlPoint.x = (points[i].x + points[i+1].x) / 2;

      ctrlPoint.y = (points[i].y + points[i+1].y) / 2;

      context.quadraticCurveTo(points[i].x, points[i].y, ctrlPoint.x, ctrlPoint.y);

    }


    //curve through the last two points

    context.quadraticCurveTo(points[i].x, points[i].y, points[i+1].x, points[i+1].y);

    context.stroke();

  };

  </script>

 </body>

</html>
In the new code, the second for loop starts at 1 and ends at numPoints - 2. This prevents it from processing the first and last pairs of points. It creates a new x, y control point, which is the average of the next two points in the array. Then, it draws a curve through the next array point to the new average point. When the loop ends, the index, i continues pointing to the second-to-last element; thus, you can draw a curve through that to the last point.
This time, you come up with a nice smooth shape—rather than those spikes—as shown in Figure 4-3. You are not limited to an odd number of original points anymore. As long as you start with at least three points, you'll be fine.
As a variation on this theme, the following code, document 06-multi-curve-3.html, creates a closed curve using the same technique. It computes an initial midpoint, which is the average of the first and last points, and moves to that. Then it loops through all the rest, figuring midpoints for each one, finally drawing its last curve back to the initial midpoint (see Figure 4-4).
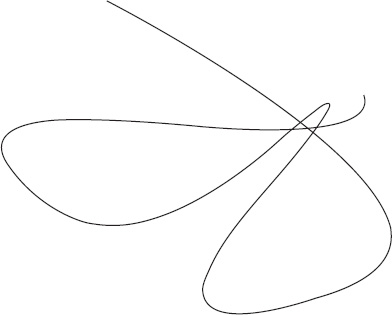
Figure 4-3. Smooth multiple curves
<!doctype html>

<html>

 <head>

  <meta charset="utf-8">

  <title>Multi Curve 3</title>

  <link rel="stylesheet" href="style.css">

 </head>

 <body>

  <canvas id="canvas" width="400" height="400"></canvas>

  <script>

  window.onload = function () {

    var canvas = document.getElementById('canvas'),

        context = canvas.getContext('2d'),

        points = [],

        numPoints = 9,

        ctrlPoint = {},

        ctrlPoint1 = {};


    for (var i = 0; i < numPoints; i++) {

      points.push({

        x: Math.random() * canvas.width,

        y: Math.random() * canvas.height

      });

    }


    //find the first midpoint and move to it

    ctrlPoint1.x = (points[0].x + points[numPoints-1].x) / 2;

    ctrlPoint1.y = (points[0].y + points[numPoints-1].y) / 2;

    context.beginPath();

    context.moveTo(ctrlPoint1.x, ctrlPoint1.y);


    //curve through the rest, stopping at each midpoint

    for (i = 0; i < numPoints - 1; i++) {

      ctrlPoint.x = (points[i].x + points[i+1].x) / 2;

      ctrlPoint.y = (points[i].y + points[i+1].y) / 2;

      context.quadraticCurveTo(points[i].x, points[i].y, ctrlPoint.x, ctrlPoint.y);

    }


    //curve through the last point, back to the first midpoint

    context.quadraticCurveTo(points[i].x, points[i].y, ctrlPoint1.x, ctrlPoint1.y);

    context.stroke();

  };

  </script>

 </body>

</html>
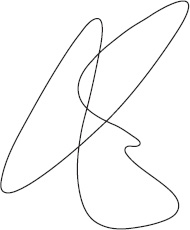
Figure 4-4. Multiple closed curves
Additional curves
Besides the context.quadraticCurveTo method we've been using, there are a few other methods for drawing curves, each with their own characteristic shape:
bezierCurveTo(cp1x, cp1y, cp2x, cp2y, x, y): Adds a point to the current path connected by a cubic Bézier curve with the two control points.arcTo(cp1x, cp1y, cp2x, cp2y, radius): Adds an arc to the path using two control points and radius, connected to the previous point by a straight line.arc(x, y, radius, startAngle, endAngle [, antiClockwise]): Adds an arc to the path described by the circumference of a circle, from the start angle to end angle, in the given direction (defaulting to clockwise), connected to the previous point by a straight line.
These methods are not used much in this book; however, context.arc shows up throughout the example code because it's an easy way to draw a circle. For example, this is how to draw a circle at point 100, 100 with a radius of 50:
context.beginPath();

context.arc(100, 100, 50, 0, (Math.PI * 2), true);

context.closePath();

context.stroke();
Creating shapes with fill
Now that we've drawn several paths using lines and curves, we use them to create shapes. The context.fill() method fills in the sub-paths with the current fill style.
The context.fillStyle property, like context.strokeStyle, is set using a CSS-style color string in hexadecimal or RGB format. The default is black, or "#000000". If you want to use a transparent color, recall that you need to format it as a proper RGBA string.
You can issue a context.fill() command almost any time during the process of drawing. This computes a shape from the current location on the sub-path to the beginning point. Generally, the drawing sequence is as follows:
beginPathmoveTolineStyle(if any)fillStyle(if any)- A series of
lineToandquadraticCurveTomethods (or similar curves) closePath(to close the shape)fill(shape color)stroke(shape outline)
You can use the first four methods in just about any order without affecting what is drawn. It's not required to specify a line or fill style, but if you do not, you will use the default color: black.
If you do not draw a line back to the original point from which you started, the canvas will still fill in the shape when you call the command context.fill—but it will not close the path and draw the completed outline. To do that, call the method context.closePath and the path will be automatically closed.
Go ahead and play around with drawing fills. You can even use the closed curve example from the previous section (06-multi-curve-3.html), because this example is already generating a closed shape. Throw in a context.fillStyle statement before the first context.quadraticCurveTo—for example, context.fillStyle = "#ff0000"—and finish off the code with context.fill().
If you do this, notice where sections of the curve cross over itself—here the fill kind of disappears. There's not much you can do about that, but for the most part, you won't draw shapes that intersect like this. On the other hand, you can use that behavior to create some interesting shapes.
Creating gradient fills
A gradient fill is a fill of at least two colors. A part of the shape starts out one color, and it slowly blends into another color, possibly transitioning through one or several other predefined colors on its way.
Specifying the gradient type
There are two types of canvas gradient fills: linear and radial. In a linear gradient fill, the gradient of colors lies along a line from one point to the other. Create a linear gradient with context.createLinearGradient(x0, y0, x1, y1), which paints along the line between point (x0, y0) and point (x1, y1). Figure 4-5 shows a few examples of linear gradient fills.

Figure 4-5. Linear gradient fills
A radial gradient fill starts in the center of the space you define and radiates outward in all directions, creating a circle. The first color you specify is at the center of the circle, and the final color is the edge. The method, context.createRadialGradient(x0, y0, r0, x1, y1, r1), takes arguments representing two circles each specified by a coordinate and a radius. Figure 4-6 shows an example of a radial fill.

Figure 4-6. Radial gradient fill
Setting gradient color stops
To see a gradient fill, you need at least two different color stops, or color positions, on the gradient. If that's all you specify, the fill blends from the first to the second. If you add more colors, the fill blends smoothly from the first, to the second, to the third, and so on, until it arrives at the last one.
You must also specify the position of each color in the fill by assigning it a decimal number from 0 to 1, where 0 is the start of the fill and 1 is the end. These numbers, one for each color, are called the ratio of the fill. For example, if you want a two-color fill, specify 0 and 1 as the ratios. To make an even blend of three colors, use 0, 0.5, and 1 as ratios—this puts the second color exactly in the middle of the other two. If you use 0, 0.1, 1 as ratios, the first color almost immediately blends into the second, and then very slowly blends into the third. Keep in mind that these are not pixel values, but fractions of 1.
With a ratio and color, add a color stop using the gradient's method Gradient.addColorStop(ratio, color):
var gradient = context.createLinearGradient(0, 0, 100, 100);

gradient.addColorStop(0, "#ffffff");

gradient.addColorStop(1, "#ff0000");
This creates a linear gradient from point (0, 0) to point (100, 100). It then defines two color stops using a start ratio of 0 and end ratio of 1. This gradient color starts as white and blends into red at the end.
The next step is to assign the gradient to context.fillStyle and draw a shape with it:
context.fillStyle = gradient;

context.fillRect(0, 0, 100, 100);
Here we use the convenience method context.fillRect. This draws and fills a rectangle path in the same way as our line drawing commands, but does not move the pen around much. Let's see how it all looks together on the canvas in the document 07-gradient-fill-1.html:
<!doctype html>

<html>

 <head>

  <meta charset="utf-8">

  <title>Gradient Fill 1</title>

  <link rel="stylesheet" href="style.css">

 </head>

 <body>

  <canvas id="canvas" width="400" height="400"></canvas>

  <script>

  window.onload = function () {

    var canvas = document.getElementById('canvas'),

        context = canvas.getContext('2d'),

        pt1 = {x: 0, y: 0},               //gradient start point

        pt2 = {x: 100, y: 100},           //gradient end point

        gradient = context.createLinearGradient(pt1.x, pt1.y, pt2.x, pt2.y);


    //gradient from white to red

    gradient.addColorStop(0, "#ffffff");

    gradient.addColorStop(1, "#ff0000");


    context.fillStyle = gradient;

    context.fillRect(0, 0, 100, 100);

  };

  </script>

 </body>

</html>
Test this in your browser and you see a white-to-red gradient square. Now, let's draw the square in a different location by altering the drawing code. Change the x and y position where you start the square (in 08-gradient-fill-2.html):
context.fillRect(100, 100, 100, 100);
The square is all red, what happened? The gradient starts at point 0, 0 and ends at point 100, 100, which is where the square begins. At this position, the gradient has already reached full red, and it's red from there on out. So again, you want the x, y of the gradient to start at the top-left point of the shape, like so:
pt1 = {x: 100, y: 100},           //gradient start point

pt2 = {x: 200, y: 200},           //gradient end point

gradient = context.createLinearGradient(pt1.x, pt1.y, pt2.x, pt2.y);
Here, the starting point of the gradient is the same as the starting point of the square. Using the same square, you can play around with gradient color stops to see what kind of effects you can create. First, try three colors:
//gradient from white to blue to red

gradient.addColorStop(0, "#ffffff");

gradient.addColorStop(0.5, "#0000ff");

gradient.addColorStop(1, "#ff0000");
Move the middle ratio around to see how that affects the gradient. Instead of 0.5, try 0.25 or 0.75.
The next example is a straight alpha blend. The colors are the same; only the alpha changes:
//all black alpha blend

gradient.addColorStop(0, "#000000");          //alpha 100%

gradient.addColorStop(1, "rgba(0, 0, 0, 0)"); //alpha   0%
Finally, instead of using points, define two circles and use a radial gradient:
c1 = {x: 150, y: 150, radius: 0},

c2 = {x: 150, y: 150, radius: 50},

gradient = context.createRadialGradient(c1.x, c1.y, c1.radius,

                                        c2.x, c2.y, c2.radius);
You can try all the same tricks that you used for the linear gradient fill in the radial version. Or, see how this looks in example 09-gradient-fill-radial.html.
Loading and drawing images
You might want to draw an external image into your animation. There are two ways to access the image: Load a URL while the script is running or use the DOM interface to access an embedded image element. After the image has loaded, you can render it to the canvas using the drawing API.
Loading images
To load an image at runtime, create a new Image object and set its src property to the URL path of an image file. When the image has finished loading, it executes the callback function set as its onload method. In this simple example, we draw the image to the canvas after it has been completely loaded (document 10-load-image.html):
<!doctype html>

<html>

 <head>

  <meta charset="utf-8">

  <title>Load Image</title>

  <link rel="stylesheet" href="style.css">

 </head>

 <body>

  <canvas id="canvas" width="400" height="400"></canvas>

  <script>

  window.onload = function () {

    var canvas = document.getElementById('canvas'),

        context = canvas.getContext('2d'),

        image = new Image();


    image.src = "picture.jpg";

    image.onload = function () {

      context.drawImage(image, 0, 0);

    };

  };

  </script>

 </body>

</html>
We drew the image to the canvas using the method context.drawImage, which takes an image element and an x and y position on the canvas. This code is placed within the image.onload callback; otherwise, the command would have executed before the image loaded, rendering nothing.
The context.drawImage method can be invoked in three ways, using multiple arguments:
drawImage(image, dx, dy): Draws an image at the canvas position (dx,dy), which is the upper-left corner of the image.drawImage(image, dx, dy, dw, dh): Scales the image usingdwfor width anddhfor height and draws it to the canvas position (dx,dy).drawImage(image, sx, sy, sw, sh, dx, dy, dw, dh): Clips an image to the rectangle (sx,sy,sw,sh), scales it to (dh,dw), and draws it at position (dx,dy).
Using image elements
You can also access an image element in your HTML document using the DOM. This has the advantage of already loading the image by the time the script gets to it. If you do it this way, use some CSS to hide the image element or you might see it rendered twice in your document. Here's the completed example (11-embed-image.html):
<!doctype html>

<html>

 <head>

  <meta charset="utf-8">

  <title>Embed Image</title>

  <link rel="stylesheet" href="style.css">

  <style>

  #picture {

    display: none;

  }

  </style>

 </head>

 <body>

  <canvas id="canvas" width="400" height="400"></canvas>

  <img id="picture" src="picture.jpg">

  <script>

  window.onload = function () {

    var canvas = document.getElementById('canvas'),

        context = canvas.getContext('2d'),

        image = document.getElementById('picture'),


    context.drawImage(image, 0, 0);

  };

  </script>

 </body>

</html>
Using video elements
Similar to drawing a still image, we can also render a video to the canvas—one frame at a time. The video element is an exciting addition to the HTML5 specification that allows movies to play in the web browser, without having to use plug-ins like Adobe Flash. While this isn't the kind of animation that this book is about, you can still create some interesting effects once it's displayed on the canvas.
To include a video in your document, add the following element to your HTML:
<video controls autobuffer>

  <source src="movieclip.mp4" type="video/mp4"/>

  <source src="movieclip.webm" type="video/webm"/>

  <source src="movieclip.ogv" type="video/ogg"/>

  <p>This browser does not support the <code>video</code> element.</p>

</video>
Here, the controls attribute adds buttons for the user to play and stop the video. autobuffer tells the browser to begin downloading the file immediately, so it's ready to play when the user starts it. The <p> element is provided as a fallback to warn the user if their browser does not support HTML5 video; and if it is supported, the warning is not displayed.
There are multiple <source> tags to provide alternatives for the video format. Due to licensing restrictions, different browsers support different video file formats. To make sure a video plays across HTML5-capable browsers, you must supply multiple versions of the it. MP4 is a closed format which, at the time of writing, is required by IE and Safari. WebM and Ogg are both open, royalty-free, formats that can be played in Chrome, Firefox, and Opera. Since this is a rapidly evolving area, test your videos and formats in as many browsers as you can to make sure they play correctly.
In the next example, we load a video and draw it frame-by-frame to the canvas element. Since a video is just a collection of still images played in order, the canvas is updated in an animation loop, which draws the current frame of the video. In this document, the canvas element is set to the same dimensions as the sample video in order to display the entire frame; you may need to adjust this depending on the size of your video. Here's the code (12-video-frames.html):
<!doctype html>

<html>

 <head>

  <meta charset="utf-8">

  <title>Video Frames</title>

  <link rel="stylesheet" href="style.css">

  <style>

  #movieclip {

    display: none;

  }

  </style>

 </head>

 <body>

  <canvas id="canvas" width="640" height="360"></canvas>


  <video id="movieclip" width="640" height="360" autoplay>

   <source src="movieclip.mp4" type="video/mp4"/>

   <source src="movieclip.webm" type="video/webm"/>

   <source src="movieclip.ogv" type="video/ogg"/>

   <p>This browser does not support the <code>video</code> element.</p>

  </video>

  <script src="utils.js"></script>

  <script>

  window.onload = function () {

    var canvas = document.getElementById('canvas'),

        context = canvas.getContext('2d'),

        video = document.getElementById('movieclip'),


    (function drawFrame () {

      window.requestAnimationFrame(drawFrame, canvas);


      context.drawImage(video, 0, 0);

    }());

  };

  </script>

 </body>

</html>
The important parts in bold. The autoplay attribute has been added to the video element which starts playing it as soon as the page loads. We need a way to start the video, since its HTML element has been hidden using CSS, and we do not have access to its built-in controls. If you don't have any videos handy, you can use the samples provided with the source code of this book at www.apress.com.
The video element is related to the audio element, which is also new in HTML5. But let's not get ahead of ourselves, you see how to add sound to your animations in Chapter 19.
Pixel manipulation
The drawing API provides direct access to the pixels that compose the image on the canvas. You can create, read, and write the pixel data, which can be used to make some really cutting-edge effects and animations in the web browser.
While direct pixel access is a powerful feature, manipulating them in a coherent way is an advanced topic. The code here is intended to demonstrate some interesting visual effects that you can create when working with pixels. Since we won't use these techniques anywhere else in the book, you can consider this section as optional. If you get a little confused by the code (the implementation is not the most straightforward), or just want to move on to good stuff in the next chapter, feel free to skip over it. You can always come back later.
Getting pixel data
Direct access to the pixels is provided by the ImageData object of the canvas context. To return a copy of the pixel data for a rectangular area on the canvas element, call:
var imagedata = context.getImageData(x, y, width, height);
This returns an object containing three properties: width, height, and data. The width and height properties are the size of the image in pixels, and data is an array representing the image data. We will look at this in more detail shortly.
To create a new, blank, ImageData object, specify the rectangle dimensions and call:
var imagedata = context.createImageData(width, height);
Alternatively, you can invoke this function with another ImageData object, e.g. context.createImageData(anotherImageData). This creates a new object with the same dimensions as the argument. The pixels of the new object are set to transparent black, as this method does not copy the image data.
When reading pixel data, any external asset rendered to the canvas—image or video—is served from the same domain as the document running the script. If a cross-origin image is drawn to the canvas, it is marked as dirty, and you will no longer be able to read the pixels; instead, a security exception error is thrown to the debugging console. This is in the HTML5 specification and is consistent with the same-origin security policy used by most web browsers. Consequently, even testing some examples on your local machine might be impossible. Unless your browser provides options to ignore this security policy, you'll need to upload everything to a server and test it from there.
Accessing pixel components
The data property of an ImageData object returns a one-dimensional array containing the values of the pixel component colors in RGBA order, specified as integers in the range 0 to 255. (Note that alpha is also assigned a value in this range; not the 0.0 to 1.0 range used in the CSS-style color format.) The pixels are ordered left to right, row by row, from top to bottom.
For example, here's an array representing the image data of a 2 × 2 square. Each of the four pixels is set to full red:
var pixels = [255, 0, 0, 255, 255, 0, 0, 255,

              255, 0, 0, 255, 255, 0, 0, 255];
The color components of the first pixel are marked in bold, and the array continues in groupings of four elements—RGBA—for every pixel in the image. Each has its red and alpha channels set to full (255), and its green and blue channels set to none (0).
You can access the values of any particular pixel by specifying an offset index for the array. Since each pixel is represented by four elements, you can iterate over the image data, pixel by pixel, using the following:
for (var offset = 0, len = pixels.length; offset < len; offset += 4) {

  var r = pixels[offset],     //red

      g = pixels[offset + 1], //green

      b = pixels[offset + 2], //blue

      a = pixels[offset + 3]; //alpha

}
Sometimes you may want to access the pixel at a specific coordinate in the image. Here's how you can determine its offset in the image data array:
var offset = (xpos + ypos * imagedata.width) * 4;
Once you have the offset index, you can access the pixel's component colors as before.
Painting pixel data
To paint an ImageData object onto the canvas, call context.putImageData(imagedata, x, y), where x and y specify the top-left corner of the canvas to start drawing.
A pixel can be changed by isolating it in the image data array and assigning new values to its color components. The updated pixel values can be painted to the canvas by passing it as the first argument to putImageData.
For example, to remove the red color channel from an image on the canvas, iterate over each pixel, setting its red component to 0:
var imagedata = context.getImageData(0, 0, canvas.width, canvas.height),

    pixels = imagedata.data


for (var offset = 0, len = pixels.length; offset < len; offset += 4) {

  pixels[offset]     = 0;                  //red

  pixels[offset + 1] = pixels[offset + 1]; //green

  pixels[offset + 2] = pixels[offset + 2]; //blue

  pixels[offset + 3] = pixels[offset + 3]; //alpha

}


context.putImageData(imagedata, 0, 0);
Here, the image data array is assigned to pixels. (JavaScript objects—and hence arrays—are assigned by reference, so a change to the pixels array is a change to imagedata.data, as they are the same object.) We iterate over the pixels, jumping four elements at a time, and assign the values for the color components. When we are finished, the updated imagedata object is drawn back to the canvas.
We'll use the same pixel iteration process in the next example. First, some red, green, and blue stripes are drawn to the canvas so we have some image data to work with. Then, new color values are calculated for each pixel by inverting the old ones, keeping in mind each component must be an integer from 0 to 255. Here's the code for exercise 13-invert-color.html:
<!doctype html>

<html>

 <head>

  <meta charset="utf-8">

  <title>Invert Color</title>

  <link rel="stylesheet" href="style.css">

 </head>

 <body>

  <canvas id="canvas" width="400" height="400"></canvas>

  <script>

  window.onload = function () {

    var canvas = document.getElementById('canvas'),

        context = canvas.getContext('2d'),


    //draw some red, green, and blue stripes

    for (var i = 0; i < canvas.width; i += 10) {

      for (var j = 0; j < canvas.height; j += 10) {

        context.fillStyle = (i % 20 === 0) ? "#f00" : ((i % 30 === 0) ? "#0f0" : "#00f");

        context.fillRect(i, j, 10, 10);

      }

    }


    var imagedata = context.getImageData(0, 0, canvas.width, canvas.height),

        pixels = imagedata.data;


    //pixel iteration

    for (var offset = 0, len = pixels.length; offset < len; offset += 4) {

      //invert each color component of the pixel: r,g,b,a (0-255)

      pixels[offset]     = 255 - pixels[offset];     //red to cyan

      pixels[offset + 1] = 255 - pixels[offset + 1]; //green to magenta

      pixels[offset + 2] = 255 - pixels[offset + 2]; //blue to yellow

      //pixels[offset + 4] is alpha (the fourth component)

    }


    context.putImageData(imagedata, 0, 0);

  };

  </script>

 </body>

</html>
This is a relatively simple transformation, but as you might expect, effects like these can get very complicated, and very processor intensive—especially when applied to animations. If you're making something other than a fun demo, be mindful of the burden you may place on the user's machine.
Converting a color image to grayscale is another effect we can calculate easily. The luminance of each pixel is calculated, where the color components are weighted to reflect the perceived intensity of different light wavelengths. Just in case you think we're making these numbers up as we go along, the formula is, in fact, defined by the International Commission on Illumination. Replace the pixel iteration for loop from the last example with this one (document 14-grayscale.html):
//pixel iteration

for (var offset = 0, len = pixels.length; offset < len; offset += 4) {

  var r = pixels[offset],

      g = pixels[offset + 1],

      b = pixels[offset + 2],

      y = (0.2126 * r) + (0.7152 * g) + (0.0722 * b); //luminance


  pixels[offset] = pixels[offset + 1] = pixels[offset + 2] = y;

}
Now it looks like the striped image is being displayed on an old black-and-white television.
Let's make the next example more dynamic by introducing some user interactivity. We can use the mouse position to affect the image data, and put the pixel processing in an animation loop to work on each frame.
You can see that we're using the distance formula from Chapter 3 to get the distance from the mouse cursor to the current pixel. The pixel iteration is slightly different in this example; we're using a double for loop to specify the pixel's coordinate location on the canvas element. The code here can be found in example 15-pixel-move.html:
<!doctype html>

<html>

 <head>

  <meta charset="utf-8">

  <title>Pixel Move</title>

  <link rel="stylesheet" href="style.css">

 </head>

 <body>

  <canvas id="canvas" width="400" height="400"></canvas>

  <script src="utils.js"></script>

  <script>

  window.onload = function () {

    var canvas = document.getElementById('canvas'),

        context = canvas.getContext('2d'),

        mouse = utils.captureMouse(canvas);


    (function drawFrame () {

      window.requestAnimationFrame(drawFrame, canvas);


      //draw some stripes: red, green, and blue

      for (var i = 0; i < canvas.width; i += 10) {

        for (var j = 0; j < canvas.height; j += 10) {

          context.fillStyle = (i % 20 === 0) ? "#f00" : ((i % 30 === 0) ? "#0f0" : "#00f");

          context.fillRect(i, j, 10, 10);

        }

      }


      var imagedata = context.getImageData(0, 0, canvas.width, canvas.height),

          pixels = imagedata.data;


      //pixel iteration

      for (var y = 0; y < imagedata.height; y += 1) {

        for (var x = 0; x < imagedata.width; x += 1) {


          var dx = x - mouse.x,

              dy = y - mouse.y,

              dist = Math.sqrt(dx * dx + dy * dy),

              offset = (x + y * imagedata.width) * 4,

              r = pixels[offset],

              g = pixels[offset + 1],

              b = pixels[offset + 2];


          pixels[offset]     = Math.cos(r * dist * 0.001) * 256;

          pixels[offset + 1] = Math.sin(g * dist * 0.001) * 256;

          pixels[offset + 2] = Math.cos(b * dist * 0.0005) * 256;

        }

      }

      context.putImageData(imagedata, 0, 0);

    }());

  };

  </script>

 </body>

</html>
When you run this script, you should see an effect that can be described as a “psychedelic flashlight.” The color values are passed to some trigonometry functions and scaled to fit within the range of color values. We're just having fun here, so don't worry about what these functions are doing exactly, just understand that we're trying to get some interesting looking colors. Feel free to change the values around and experiment with your own color combinations.
For the last example in this chapter, we bring it back home to the first example: the simple drawing application (01-drawing-app.html). But this time, we create a spray paint effect by drawing directly to the pixels. Here's the code (example 16-spray-paint.html):
<!doctype html>

<html>

 <head>

  <meta charset="utf-8">

  <title>Spray Paint</title>

  <link rel="stylesheet" href="style.css">

 </head>

 <body>

  <canvas id="canvas" width="400" height="400"></canvas>

  <script src="utils.js"></script>

  <script>

  window.onload = function () {

    var canvas = document.getElementById('canvas'),

        context = canvas.getContext('2d'),

        mouse = utils.captureMouse(canvas),

        imagedata = context.getImageData(0, 0, canvas.width, canvas.height),

        pixels = imagedata.data,

        brush_size = 25,

        brush_density = 50,

        brush_color;


    canvas.addEventListener('mousedown', function () {

      brush_color = utils.parseColor(Math.random() * 0xffffff, true); //to number

      canvas.addEventListener('mousemove', onMouseMove, false);

    }, false);


    canvas.addEventListener('mouseup', function () {

      canvas.removeEventListener('mousemove', onMouseMove, false);

    }, false);


    function onMouseMove () {

      //loop over each brush point

      for (var i = 0; i < brush_density; i++) {

        var angle = Math.random() * Math.PI * 2,

            radius = Math.random() * brush_size,

            xpos = (mouse.x + Math.cos(angle) * radius) | 0, //remove decimal

            ypos = (mouse.y + Math.sin(angle) * radius) | 0,

            offset = (xpos + ypos * imagedata.width) * 4;


        //pixel component colors: r,g,b,a (0-255)

        pixels[offset]     = brush_color >> 16 & 0xff; //red

        pixels[offset + 1] = brush_color >> 8 & 0xff;  //green

        pixels[offset + 2] = brush_color & 0xff;       //blue

        pixels[offset + 3] = 255;                      //alpha

      }


      context.putImageData(imagedata, 0, 0);

    }

  };

  </script>

 </body>

</html>
This script uses the event handlers we set up in the first example, and works the same way. When you press the mouse button, a random “paint” color is assigned and the pixel drawing code is started. Within an area around the mouse cursor, random pixels are filled in to simulate each splatter of paint. Play around with the brush size and density, and, if you're feeling adventurous, change the way individual color components are assigned to the pixels.
Pixel manipulation can be a powerful tool used for some advanced animations and effects. Although not the focus of this book, it's fun to experiment with, and another way to render images to the canvas element.
Important formulas in this chapter
You added a few more valuable tools to your collection in this chapter, mostly relating to handling color.
Convert hex to decimal
console.log(hexValue);
Convert decimal to hex
console.log(decimalValue.toString(16));
Combine component colors
color = red << 16 | green << 8 | blue;
Extract component colors
red = color24 >> 16 & 0xFF;

green = color24 >> 8 & 0xFF;

blue = color24 & 0xFF;
Draw a curve through a point
// xt, yt is the point you want to draw through

// x0, y0 and x2, y2 are the end points of the curve

x1 = xt * 2 - (x0 + x2) / 2;

y1 = yt * 2 - (y0 + y2) / 2;

context.moveTo(x0, y0);

context.quadraticCurveTo(x1, y1, x2, y2);
Summary
This chapter didn't cover much about animation, but it did show you a number of ways to create visual content, which you learn how to animate in future chapters. Specifically, the chapter covered color, the canvas drawing API, loading images, and pixel manipulation.
These provide the foundational drawing tools you need to build dynamic, expressive content for your animations. You use many of the techniques introduced in this chapter throughout the book, so it is useful for you to know and understand them well now. In fact, you get your first hands-on experience using several of these techniques in the next chapter, which covers velocity and acceleration.