
C H A P T E R 7
Load Balancing Basics
Load balancing means the ability to spread the load of processing for an application over a number of separate systems for an overall performance increase in processing incoming requests. This seems very simple; just splitting up the load helps it all gets done quicker. But although the concept is simple enough, there are a number of factors that can add heavy levels of complexity. Anyone who has ever managed a large group of people can attest to this.
This chapter explains the complexities in a load balanced environment. The information here should give you an introduction to the core concept of what load balancing is about. Armed with this knowledge, you should be able to progress into the later chapters that cover some very in-depth examples on how to perform several different types of load balancing. This chapter covers the following:
- What is load balancing?
- What resources are in play?
- How is it accomplished?
- The guiding principles of load balancing
- Understanding your system
- Planning for load balancing
- Monitoring load balancing
What Is Load Balancing?
Load balancing represents the ability to transfer any portion of the processing for a system request to another independent system that will handle it concurrently. It splits the load that comes into one server among a number of other devices. This has the advantage of reducing the amount of processing done by the primary receiving server—allowing it to handle more requests and increasing performance—as there is less competition for resources and there are more devices processing the whole of the load.
Often your systems will already be partially load balanced, as having a separate database server from your web server is indeed load balancing. This is a great example of traditional load balancing: adding additional servers to share the processing load of complex requests. It is right here that you can see the previous examples shine through.
Once your initial single web/database server reaches the point when each additional request placed upon it slows down the processing of other requests, you need to expand. This gives a significant performance increase to both the database and the web server, since they are no longer competing for CPU time to process their respective requests. While splitting up different applications that are used to process a request among separate servers is normally the first step, there are a number of additional ways to increase your ability to split up and process loads—and all for greater efficiency and performance.
What Computing Resources Are Available?
As mentioned, much of load balancing is about the distribution and allocation of resources to complete a task. In order to better understand how to allocate resources, you should understand these resources. As it stands, there are four major resources that make up a server. They are
- Processor (CPU)
- Memory (RAM)
- Network
- Storage (Disk)
Each of these resources is important in its own right and can adversely affect your system performance, so it is therefore important for you to understand them all!
Processor (CPU)
Everything that is done by a computer is processed in some form or another. From driving your display to dealing with every move of your mouse and every tap of your keyboard, the CPU of your system needs to process these inputs and use this processing to determine what needs to happen in response to these actions.
On top of creating actions and responses, your processor also powers your operating system. At all times your operating system is processing in the background—even an action as simple as keeping time. This means that the processor is one of the key performance measures on any system as it represents the ability to take a basic input and turn it into the correct output. Without enough processing power you can't keep up with the demand on your system. The example of separating a web site and database to different servers helps illustrate this. With the database on a new server, the web server now has all of the processing capabilities that were being used by the database, which includes the following:
- Keeping the database server alive and watching for requests.
- Taking requests for data from the database.
- Calling up the database and looking through it for each specific piece of information to match your query (this is a big one!).
- Making changes to the existing database tables (if applicable) for the query that it has received.
- Altering the data collected for the query into one cohesive response in the format you requested, even if it is the default format.
- Packaging and transferring the collated response to the portion of the system that requested it.
- Tracking that this request has been made, by whom, how it went, and what happened.
From these tasks, you can see that a simple database can use a large amount of processing; the larger and more complex a database, the more processing power it takes to maintain and use. While databases are heavily optimized to allow this to be done very efficiently, this is still a heavy consumption of resources. So giving your database its own server is very advantageous because it removes the competition between your web server and database, allowing them to process on their own with no interference. Splitting up different applications or different portions of applications to increase the processing power available to each is, in our view, the very core concept of load balancing.
Memory (RAM)
Memory is information that is stored by your OS in high-speed, short-term storage. This is where most of the common components of your operating system live; they live here because they can be accessed by the processor significantly quicker. RAM overutilization is not as big a problem as CPU overconsumption but it can still cause significant performance impact. One of the functions of most modern operating systems is called virtual memory, which is the ability for the operating system to begin writing portions of the data held in memory to long term disk storage. This, of course, means that the memory is slower to access, as disk storage is much slower than RAM.
Disk storage plays into the previously mentioned web server/database example. Most database systems consume a large portion of memory because they want to keep as much information as possible in memory so it can be accessed quicker. In cases when you have a large volume of processing requests on your web server, you can wind up writing portions of your database or web requests to disk, slowing you down. As with the processor, separating the two functions into two different servers means that you can increase the performance of both your database and web server.
Checking Performance of CPU and RAM with top
The Linux command top (Linux is case-sensitive) is used on most Linux systems to allow you to see the current processing, memory, and CPU use of your system. It is a great tool for diagnosing how each individual process on your server is performing. top allows you to see how much processing power and memory each individual application is using. To look into this in more depth, see Figure 7-1.
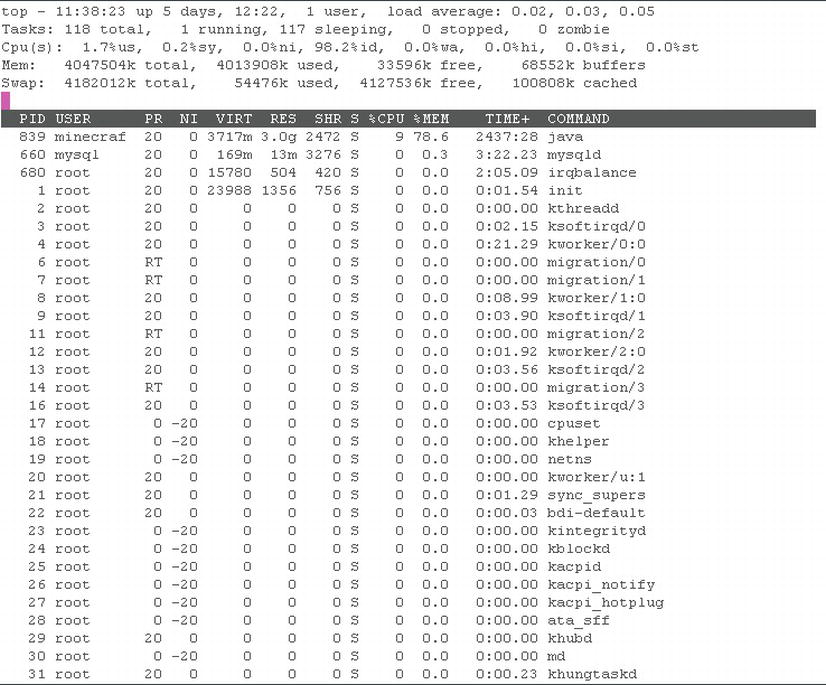
From Figure 7-1 you can see that the top section contains information dealing with the number of tasks on our system, followed by the current total processor usage (1.1%) for the whole system. Following this is the memory usage, which shows that 99% of our memory is currently in use. Finally, you can see the breakdown of which applications are using which resources at any given moment. This data shows that our most resource-consuming application is a Java application with process ID (PID) 839, which is consuming 78.6% of our memory and 9% of one of our CPUs; in other words, this application is consuming the most resources on this server—and of those resources it is consuming a significant amount of RAM but not really any CPU.
This kind of information is incredibly useful in diagnostics. In this instance, we were able to determine that we have one application that is consuming most of the memory; from there we can determine which process. From knowing which process, we can examine deeper to find out why this application is using resources and whether we should restart or terminate the application.
Network
Network represents the current throughput of a network device and the proportion currently being used for data transfer. In addition to the throughput, this also represents the time taken to transfer data between two points. Both of these can be crucial—if not enough capacity is available, no data can be transferred from point to point. As with all other metrics, excessive usage of these can have a severe impact on your system's performance. In this case, if your bandwidth is saturated, messages can be delayed or lost, so the determent here is evident. Even having a slow transmission speed can be severely detrimental; the packets may expire before they reach their destination, causing them to be lost.
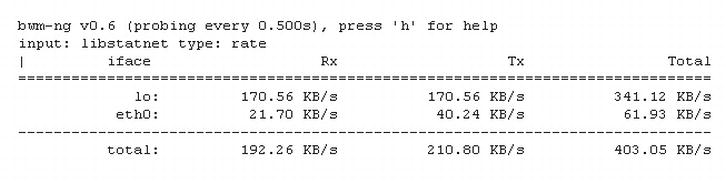
Figure 7-2. bwm-ng example
To monitor your bandwidth (amount of data in/out) you can use a tool called bwm-ng (bandwidth monitor). The output looks like Figure 7-2 and gives an “at-the-moment” snapshot of how much bandwidth you are using. This can be useful for knowing how much usage you are consuming moment to moment. In addition to bwm-ng, there are two other tools that can be used for network testing: ping and traceroute. These two tools are the bread and butter of network testing. Note that ping shows the availability of a connection to a particular host and the time it takes to return from it, and traceroute shows the same information plus the times taken on every single network “intersection” it crosses on the way to its destination. Ping is usually employed first to establish if connectivity is available and working in an acceptable manner.
![]() Note Invocation of ping is
Note Invocation of ping is ping <IP address or URL> and invocation of traceroute is traceroute <IP or URL>.
Keep in mind that traceroute differs from ping as it as a more sophisticated tool for diagnosing specific problems such as finding a bottleneck (point with delay) or finding where a connection drops off. This point can then become your basis for diagnosis, as you have now isolated where any connection issues stem from and can examine what may be causing these issue there—or you can point the finger at someone else.
Storage (Disk)
Storage refers to the amount of physical storage available to your server at any moment. Like network, this can be measured in two parts: the disk I/O (amount of disk input/output per second) and total volume consumed. For your purposes, disk I/O is fairly irrelevant as most of your applications will not be writing to disk regularly. Of course, there are advantages in monitoring and watching disk I/O, but these will be as beneficial as in other areas. We have said disk IO is not supremely important, but disk space usage is! When your server runs out of storage space, all kinds of errors can occur, any virtual memory that was in use can be over-written, and your system can grind to a halt.
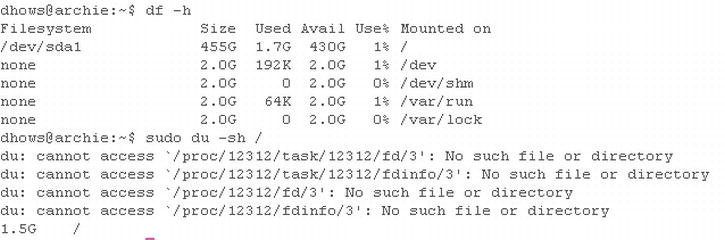
Figure 7-3. du and df example
As you can see from Figure 7-3, it's easy to monitor your disk usage with two simple commands du and df. du; they show the usage of every item and all subitems within its usage (in the example, you can even see errors that would prevent seeing the portions of the disk that the user doesn't have access to). This can be useful but consumes a lot of screen space, so it's normally used in the form du -sh (s standing for summary and h standing for human readable), which gives a nice neat output of the current usage of the disk. The second command df gives a brilliant output showing the current state of all the logical partitions attached to your server. This can be used to give you quick notification if one of your disks is full.
Load Balancing in Practice
Now that you have an understanding of the resources that one normally has to worry about, you can begin looking at how these resources can be effectively allocated. This allocation of resources to increase the effectiveness of applications is the core of load balancing and therefore our focus. The primary ways that load balancing is accomplished are as follows:
- Split applications over a number of servers, balancing the load over a number of servers (such as separate web and database servers).
- Add specialist components to applications in order to balance the amount of processing needed for each application function, such as caching of common web site data, saving time on the collection of this data from disk, or the creation of this data from database entries, etc.
- Create additional servers that can collectively share the load, which can greatly increase the amount of processing power available to complete the tasks required by a server.
Over the course of the next few chapters we will introduce several concepts for dealing with the second and third methods of load balancing, which includes things like SSL acceleration, SSL offloading, creating a load balancer to allow multiple servers to share load, and creating a highly-available (HA) cluster for processing requests.
Guiding Principles
With load balancing, as with just about any form of system modification, there are a number of guiding principles that inform most of what you are attempting to accomplish. Understanding them is key to successfully load balancing your system and will make the job of maintaining and further improving your load balancing and system performance easier.
Understand Your System
Principle one is understanding your system. This may seem easy at first, but is actually quite an in-depth undertaking. Understanding your system, in simple terms, is having knowledge of how your system goes about performing its day-to-day business tasks.
For example, in a web server you need to be aware of how connections come into your system and where they go. Once they get to their destination, what happens to the requests, what kind of response comes out, where does the information in that response come from, and how does this data get back to the initial requester? In addition, you should also look at understanding the normal traffic flow to your web site and the traffic pattern.
The traffic flow means how a user interacts with your web site, so you will learn how they log in, request common data, etc. This kind of information allows you to make tweaks to the areas of your system that you know will be trafficked significantly more, by having unchanging data (like a company logo) stored in cache or by having a cut-down view in your database that allows quicker request time for username and passwords (allowing quicker user logins).
Traffic patterns can be much more cryptic to understand but provide much more insight once deciphered. Each request that a user makes will have an impact on your system; however, under normal circumstances the actions of one user are insignificant. The actions of your entire user base are much different. Consider a football scores web site: it will be most active during the football season, on game day, during the hours that football games are being played. This kind of pattern allows you to preempt traffic problems by adding additional resources to cope during these peak periods.
The combination of these three items can be dynamite. Continuing with the football example, think of it this way: on game day you will see an increase in requests for the scoreboard pages and these requests place a heavy load on your database. In response, you can add a quick cached database view that shows only the current scores as relevant; in addition, you can cache certain versions of this page for “relevant” periods (say a minute or two). This means that anyone who requests access to your football scores would get the cached version of the page, which is updated every minute. The scores are still displayed and updated in near real time (on the timescale of a football fan), the load on the database is mightily reduced, and the pages can load quicker since they are cached and ready to display at a moment's notice.
Planning
Principal two is planning. Planning builds upon what was briefly mentioned in principle one and acts much as a yang to its yin. This is to say that planning is much less useful without information, and the information itself is not acted upon without good planning. Planning is about setting a goal, establishing the parameters of what you wish to accomplish, and finding out ways to accomplish what you have established.
Most IT texts talk about a number of things in this area but the key is simple: be proactive (act to prevent or pre-empt) rather than reactive (act in response to). If you are proactive in understanding your system, you will understand when your system is at its worst and you will take steps to lessen any issues before they occur.
Monitoring and Testing
Principal three works with both the two previous principals. Principal three is that you should monitor your system and that any change that you make should be monitored while it is tested. One of the key human foibles is that we are often wrong about things; this most certainly includes performance tweaks made to IT systems. As part of understanding your system, you need to monitor and be aware of how long a connection takes, or how much load you are expecting. Then extending this knowledge to your testing to make sure that any changes you make actually have a positive outcome.
This brings us to one of the biggest caveats that you will encounter during the course of this book. Not all performance tuning is suitable to all situations. We have tried to be as general in our focus here as we can and we have tried wherever possible to ensure that these changes are universally of benefit. This, however, isn't always the case, so with this in mind, always test the changes that you make to ensure that you are getting benefits from your changes.
Summary
Using these three principals means that you will take a very active focus on your system performance and load balancing. This active focus is what this chapter is about—having an understanding of what you are working with and a clear goal of where you want to go. Using the concepts covered in this chapter should give you a good grounding of what you can do to ensure that the rest of the advice and configurations in the latter chapters of this book provide as much advantage as possible.