
Visualizing Requirements
In Chapter 4, we discussed the importance of identifying requirements. In particular, we discussed use cases and how they can be used to gather and communicate requirements.
Once you have identified a requirement, you need to validate the requirement with the customer. If you find a problem with a requirement definition before implementation, it will save a lot of time and money over finding it later in the development process.
Customers’ eyes may glaze over if the requirement is not communicated in a way they can understand. Words are great, but sometimes diagrams are a more effective way to communicate requirements. Unified Modeling Language (UML) provides some tools for representing requirements and communicating them between the stakeholder and implementer communities.
We’re not going into a full discussion of UML in this book, but some of the tools in UML are so useful that they should be known to every technology manager. There are a lot of nuances in UML that are well beyond the scope of this chapter, but we’ll look at some of the main features of these diagrams so that you can interpret diagrams and even draft basic diagrams yourself.
We are also going to discuss data flow diagrams and entity relationship diagrams. These are frequently used side-by-side with the UML diagrams in order to specify functional requirements of databases.
Activity diagrams represent workflows. They include methods for representing choice, iteration, and concurrency.
The elements of an activity diagram are
- Activities are represented by rounded rectangles.
- Decisions are represented by diamonds.
- Concurrent activities are represented by horizontal bars marking the beginning and end of the concurrent activities.
- The beginning state is represented by a black circle.
- The end state is represented by a black circle inside another circle.
Activity diagrams may be the most familiar of the UML diagrams. They are similar to the types of flow charts that are used in a lot of different contexts.
In the activity diagram in Figure 13-1, a decision point decides whether Action 1 needs to be run before Action 2. Parallel Action 1 and Parallel Action 2 are then executed concurrently.
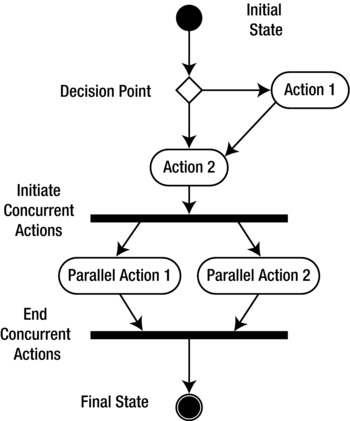
Figure 13-1. Activity diagram
Activity diagrams are useful for describing a step-by-step workflow in an easily readable summary format. This format is particularly suitable for presentations or to provide a discussion framework for working meetings.
Activity diagrams also have the concept of a swim lane. This is a large box around a group of activities that are mostly logically separated from other activities.
UML statechart diagrams look superficially like activity diagrams. The primary difference is that a statechart diagram tracks system states rather than tracking the order of activities in a workflow. The arrows in a statechart describe the transition.
Statecharts can be useful if the system being described has a limited number of states, and the transitions between those states are known.
Figure 13-2 shows a very basic statechart diagram. The door is either opened or closed, and the transitions are opening and closing the door. There is also a constraint listed, which is that the door can only be opened if it is unlocked.
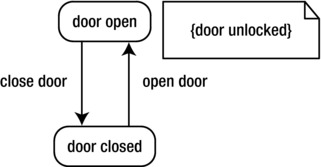
Figure 13-2. UML statechart diagram—door
The statechart diagram in Figure 13-3 shows a more interesting situation. Here the state boxes represent a customer account. The customer submits payment information, and the state of his account reflects that the payment is pending. If the payment is denied, the pending flag is removed. If the payment is accepted, the account is credited.
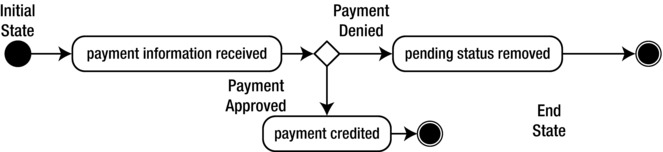
Figure 13-3. UML statechart diagram—payment
Any nontrivial system features interactions between multiple parts. Usually, these interactions need to take place in a set order. Sequence diagrams display information about the order for different object interactions, as well as descriptions of the actions performed between objects.
Each object is represented by a vertical dashed line. The object is designated as “active” when there is a rectangle over the line. Arrows between the objects designate interactions, and the order of those interactions is read from top to bottom.
In Figure 13-4, an end-user calls the help desk, which queries the knowledge base. The help desk then passes the response back to the end-user.
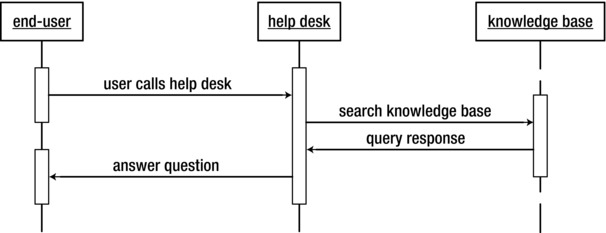
Figure 13-4. Sequence diagram
Note that the “end-user” has a discontinuous active area. This might represent a case in which the user hangs up and the help desk calls back with an answer.
A key aspect of any system is how data moves from one component to another. Modeling this data flow is part of communicating how the system works.
Data flow diagrams demonstrate how data flows within a system. Rectangles are actors, circles are data processes, and parallel lines are data sources.
The arrows represent the direction of flow of data within the overall system.
In this case represented in Figure 13-5, the customer requests information from the web/app server by supplying credentials, which are supplied to the data store. Data is returned to the web/app server and then to the customer.
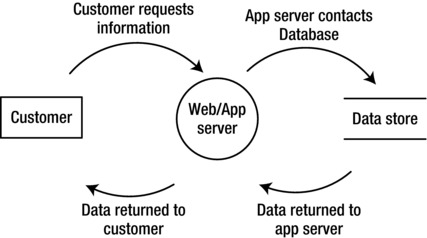
Figure 13-5. Data flow diagram
Entity relationship diagrams (ERDs) are data modeling diagrams. They show the relationship between the data objects in the system.
One of the more common (and useful) ways of portraying ERDs is a format known as a Crow’s Foot diagram, after the shape of the relationship connector.
Near the end of the connector next to each entity, there is a “0” or “1” on the line. This means “at least 0” or “at least 1.” Then each connector is either a straight line or a crow’s foot shape, meaning either “one” or “many,” respectively.
Figure 13-6 shows examples of several different types of connectors. In this somewhat artificial example, each professor teaches exactly one section of a class. The section is assigned to a room, which may host several sections over the course of the day. Each section contains one or more students, and each student takes one or more class sections.
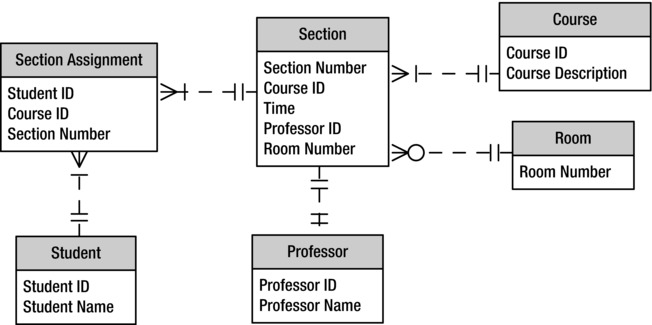
Figure 13-6. Entity relationship diagram
The relationship connector between the table of professors and the table of sections shows a unique one-to-one connection. The one-to-one connection is defined by the “Professor ID” field in the Professor and Section tables.
Similarly, look at the relationship between the Room table and the Section table. The room may be empty, which is why there is a “0” on the Section table end of the connector. Or there may be multiple sections assigned to the room over the course of the day, which is why there is a crow’s foot at that end of the connector. The relationship is defined by the “Room Number” field in both tables.
Each class has at least one section, which is why each end of that connector has a “1” next to it. Since a class (say, “History 101”) may have more than one section, the section end of the relationship connector shows a crow’s foot.
The most interesting relationship is between the Student table and the Section table. That is a many-to-many relationship, since each section may have many students, and each student may take many classes. This is represented by having a “Section Assignment” table representing the section assignments. Each section assignment consists of a course ID, a section number, and a student ID.
(Note that in this model, the student might enroll in more than one section of History 101. Maybe that is okay, maybe it is not. That is exactly the sort of discussion around requirements that needs to be had before the database is created.)
Summary
It is hard enough to communicate and discuss requirements with raw text. Fortunately, there are a number of graphical tools available for portraying requirements.
Discussions of requirements will not get very far if everyone in the meeting has fallen asleep while verbal descriptions scroll across the presentation screen. Pictures can be easier to follow and easier to discuss. Understanding and using standard diagram formats is a powerful tool for any manager to have.
Discussion Questions
- Think of a simple process in your daily life. Draw a sequence and state diagram to portray that process.
- Adjust the ERD in Figure 13-6 to allow professors to teach multiple sections.
Further Reading
Braude, Eric J. Software Engineering: An Object-Oriented Perspective. Danvers, MA: Wiley, 2001.
Stellman, Andrew, and Jennifer Greene. Applied Software Project Management. Sebastopol, CA: O’Reilly, 2006.
Whitten, Jeffrey L., and Lonnie D. Bentley. Systems Analysis & Design Methods. New York, NY: McGraw-Hill, 2007.