
Chapter 10. Getting Your Setup Just Right

By now, you’ve spent significant time designing your network and implementing that design in your PF configuration. Getting your setup just right—that is, removing any remaining setup bugs and inefficiencies—can be quite challenging at times.
This chapter describes options and methods that will help you get the setup you need. First, we’ll take a look at global options and settings that can have a profound influence on how your configuration behaves.
Things You Can Tweak and What You Probably Should Leave Alone
Network configurations are inherently very tweakable. While browsing the pf.conf man page or other reference documentation, it’s easy to be overwhelmed by the number of options and settings that you could conceivably adjust in order to get that perfectly optimized setup.
Keep in mind that for PF in general, the defaults are sane for most setups. Some settings and variables lend themselves to tuning; others should come with a big warning that they should be adjusted only in highly unusual circumstances, if at all.
Here, we’ll look at some of the global settings that you should know about, although you won’t need to change them in most circumstances.
These options are written as set option setting and go after any macro definitions in your pf.conf file but before translation or filtering rules.
Note
If you read the pf.conf man page, you’ll discover that a few other options are available. However, most of those aren’t relevant in a network-testing and performance-tuning context.
Block Policy
The block-policy option determines which feedback, if any, PF will give to hosts that try to create connections that are subsequently blocked. The option has two possible values:
dropdrops blocked packets with no feedback.returnreturns with status codes, such asConnection refusedor similar.
The correct strategy for block policies has been the subject of considerable discussion over the years. The default setting for block-policy is drop, which means that the packet is silently dropped without any feedback. Silently dropping packets, however, makes it likely that the sender will resend the unacknowledged packets rather than drop the connection. Thus, the sender may keep up the effort until the relevant timeout counter expires. If you don’t want this behavior to be the default in your setup, set the block policy to return:
set block-policy return
This setting means that the sender’s networking stack will receive an unambiguous signal indicating that the connection was refused.
Whichever block-policy option you use will specify the global default for your block policy. If necessary, however, you can still vary the blocking type for specific rules. For example, you could change the brute-force protection rule set from Chapter 6 to set block-policy to return but also use block drop quick from <bruteforce> to make the brute forcers waste time if they stick around once they’ve been added to the <bruteforce> table. You could also specify drop for traffic from nonroutable addresses coming in on your Internet-facing interface or other clearly nondesirable traffic, such as attempts to enlist your gear in amplifying a distributed denial-of-service (DDoS) attack.[49]
Skip Interfaces
The skip option lets you exclude specific interfaces from all PF processing. The net effect is like a pass-all rule for the interface, but it actually disables all PF processing on the interface. For example, you can use this option to disable filtering on the loopback interface group, where filtering in most configurations adds little in terms of security or convenience:
set skip on lo
In fact, filtering on the loopback interface is almost never useful, and it can lead to odd results with a number of common programs and services. The default is that skip is unset, which means that all configured interfaces can take part in PF processing. In addition to making your rule set slightly simpler, setting skip on interfaces where you don’t want to perform filtering results in a slight performance gain.
State Policy
The state-policy option specifies how PF matches packets to the state table. It has two possible values:
With the default
floatingstate policy, traffic can match state on all interfaces, not just the one where the state was created.With an
if-boundpolicy, traffic will match only on the interface where the state is created; traffic on other interfaces will not match the existing state.
Like the block-policy option, this option specifies the global state-matching policy, but you can override the state-matching policy on a per-rule basis if needed. For example, in a rule set with the default floating policy, you could have a rule like this:
pass out on egress inet proto tcp to any port $allowed modulate state (if-bound)
With this rule, any return traffic trying to pass back in would need to pass on the same interface where the state was created in order to match the state-table entry.
The situations in which an if-bound policy is useful are rare enough that you should leave this setting at the default.
State Defaults
Introduced in OpenBSD 4.5, the state-defaults option enables you to set specific state options as the default options for all rules in the rule set—unless those state options are specifically overridden by other options in individual rules.
Here’s a common example:
set state-defaults pflow
This option sets up all pass rules in the configuration to generate NetFlow data to be exported via a pflow device.
In some contexts, it makes sense to apply state-tracking options, such as connection limits, as a global state default for the entire rule set. Here’s an example:
set state-defaults max 1500, max-src-conn 100, source-track rule
This option sets the default maximum number of state entries per rule to 1,500, with a maximum of 100 simultaneous connections from any one host and with separate limits for each rule in the loaded rule set.
Any option that’s valid inside parentheses for keep state in an individual rule can also be included in a set state-defaults statement. Setting state defaults in this way is useful if there are state options that aren’t already system defaults that you want to apply to all rules in your configuration.
Timeouts
The timeout option sets the timeouts and related options for various interactions with the state-table entries. The majority of the available parameters are protocol-specific values stored in seconds and prefixed tcp., udp., icmp., and other.. However, adaptive.start and adaptive.end denote the number of state-table entries.
The following timeout options affect state-table memory use and, to some extent, lookup speed:
The
adaptive.startandadaptive.endvalues set the limits for scaling down timeout values once the number of state entries reaches theadaptive.startvalue. When the number of states reachesadaptive.end, all timeouts are set to 0, essentially expiring all states immediately. The defaults are 6,000 and 12,000 (calculated as 60 percent and 120 percent of the state limit, respectively). These settings are intimately related to the memory-pool limit parameters you set via thelimitoption.The
intervalvalue denotes the number of seconds between purges of expired states and fragments. The default is 10 seconds.The
fragvalue denotes the number of seconds a fragment will be kept in an unassembled state before it’s discarded. The default is 30 seconds.When set,
src.trackdenotes the number of seconds source-tracking data will be kept after the last state has expired. The default is 0 seconds.
You can inspect the current settings for all timeout parameters with pfctl -s timeouts. For example, the following display shows a system running with default values:
$ sudo pfctl -s timeouts
tcp.first                  120s
tcp.opening                 30s
tcp.established          86400s
tcp.closing                900s
tcp.finwait                 45s
tcp.closed                  90s
tcp.tsdiff                  30s
udp.first                   60s
udp.single                  30s
udp.multiple                60s
icmp.first                  20s
icmp.error                  10s
other.first                 60s
other.single                30s
other.multiple              60s
frag                        30s
interval                    10s
adaptive.start            6000 states
adaptive.end             12000 states
src.track                    0s
These options can be used to tweak your setup for performance. However, changing the protocol-specific settings from the default values creates a significant risk that valid but idle connections might be dropped prematurely or blocked outright.
Limits
The limit option sets the size of the memory pools PF uses for state tables and address tables. These are hard limits, so you may need to increase or tune the values for various reasons. If your network is a busy one with larger numbers than the default values allow for, or if your setup requires large address tables or a large number of tables, then this section will be very relevant to you.
Keep in mind that the total amount of memory available through memory pools is taken from the kernel memory space, and the total available is a function of total available kernel memory. Kernel memory is to some extent dynamic, but the amount of memory allocated to the kernel can never equal or exceed all physical memory in the system. (If that happened, there would be no space for user-mode programs to run.)
The amount of available pool memory depends on which hardware platform you use as well as on a number of hard-to-predict variables specific to the local system. On the i386 architecture, the maximum kernel memory is in the 768MB to 1GB range, depending on a number of factors, including the number and kind of hardware devices in the system. The amount actually available for allocation to memory pools comes out of this total, again depending on a number of system-specific variables.
To inspect the current limit settings, use pfctl -sm. Typical output looks like this:
$ sudo pfctl -sm
states        hard limit   10000
src-nodes     hard limit   10000
frags         hard limit    5000
tables        hard limit    1000
table-entries hard limit   200000
To change these values, edit pf.conf to include one or more lines with new limit values. For example, you could use the following lines to raise the hard limit for the number of states to 25,000 and for the number of table entries to 300,000:
set limit states 25000
set limit table-entries 300000
You can also set several limit parameters at the same time in a single line by enclosing them in brackets:
set limit { states 25000, src-nodes 25000, table-entries 300000 }In the end, other than possibly increasing these three parameters for larger installations, you almost certainly shouldn’t change the limits at all. If you do, however, it’s important to watch your system logs for any indication that your changed limits have undesirable side effects or don’t fit in available memory. Setting the debug level to a higher value is potentially quite useful for watching the effects of tuning limit parameters.
Debug
The debug option determines what, if any, error information PF will generate at the kern.debug log level. The default value is err, which means that only serious errors will be logged. Since OpenBSD 4.7, the log levels here correspond to the ordinary syslog levels, which range from emerg (panics are logged), alert (correctable but very serious errors are logged), crit (critical conditions are logged), and err (errors are logged) to warning (warnings are logged), notice (unusual conditions are logged), info (informational messages are logged), and debug (full debugging information, likely only useful to developers, is logged).
Note
In pre–OpenBSD 4.7 versions, PF used its own log-level system, with a default of urgent (equivalent to err in the new system). The other possible settings were none (no messages), misc (reporting slightly more than urgent), and loud (producing status messages for most operations). The pfctl parser still accepts the older-style debug levels for compatibility.
After one of my gateways ran at the debug level for a while, this is what a typical chunk of the /var/log/messages file looked like:
$ tail -f /var/log/messages
Oct 4 11:41:11 skapet /bsd: pf_map_addr: selected address 194.54.107.19
Oct 4 11:41:15 skapet /bsd: pf: loose state match: TCP 194.54.107.19:25
194.54.107.19:25 158.36.191.135:62458 [lo=3178647045 high=3178664421 win=33304
modulator=0 wscale=1] [lo=3111401744 high=3111468309 win=17376 modulator=0
wscale=0] 9:9 R seq=3178647045 (3178647044) ack=3111401744 len=0 ackskew=0
pkts=9:12
Oct 4 11:41:15 skapet /bsd: pf: loose state match: TCP 194.54.107.19:25
194.54.107.19:25 158.36.191.135:62458 [lo=3178647045 high=3178664421 win=33304
modulator=0 wscale=1] [lo=3111401744 high=3111468309 win=17376 modulator=0
wscale=0] 10:10 R seq=3178647045 (3178647044) ack=3111401744 len=0 ackskew=0
pkts=10:12
Oct 4 11:42:24 skapet /bsd: pf_map_addr: selected address 194.54.107.19
At the debug level, PF repeatedly reports the IP address for the interface it’s currently handling. In between the selected address messages, PF warns twice for the same packet that the sequence number is at the very edge of the expected range. This level of detail seems a bit overwhelming at first glance, but in some circumstances, studying this kind of output is the best way to diagnose a problem and later to check to see whether your solution helped.
Note
This option can be set from the command line with pfctl -x, followed by the debug level you want. The command pfctl -x debug gives you maximum debugging information; pfctl -x none turns off debug messages entirely.
Keep in mind that some debug settings can produce large amounts of log data and, in extreme cases, could impact performance all the way to self-denial-of-service level.
Rule Set Optimization
The ruleset-optimization option enables or sets the mode for the rule set optimizer. The default setting for ruleset-optimization in OpenBSD 4.1 and equivalents is none, which means that no rule set optimization is performed at load time. From OpenBSD 4.2 onward, the default is basic, which means that when the rule set loads, the optimizer performs the following actions:
Removes duplicate rules
Removes rules that are subsets of other rules
Merges rules into tables if appropriate (typical rule-to-table optimizations are rules that pass, redirect, or block based on identical criteria, except source and/or target addresses)
Changes the order of rules to improve performance
For example, say you have the macro tcp_services = { ssh, www, https } combined with the rule pass proto tcp from any to self port $tcp_services. Elsewhere in your rule set, you have a different rule that says pass proto tcp from any to self port ssh. The second rule is clearly a subset of the first, and they can be merged into one. Another common combination is having a pass rule like pass proto tcp from any to int_if:network port $tcp_services with otherwise identical pass rules, where the target addresses are all in the int_if:network range.
With ruleset-optimization set to profile, the optimizer analyzes the loaded rule set relative to network traffic in order to determine the optimal order of quick rules.
You can also set the value of the optimization option from the command line with pfctl:
$ sudo pfctl -o basicThis example enables the rule set optimization in basic mode.
Because the optimization may remove or reorder rules, the meaning of some statistics—mainly the number of evaluations per rule—may change in ways that are hard to predict. In most cases, however, the effect is negligible.
Optimization
The optimization option specifies profiles for state-timeout handling. The possible values are normal, high-latency, satellite, aggressive, and conservative. The recommendation is to keep the default normal setting unless you have very specific needs.
The values high-latency and satellite are synonyms; with these values, states expire more slowly in order to compensate for potential high latency.
The aggressive setting expires states early in order to save memory. This could, in principle, increase the risk of dropping idle-but-valid connections if your system is already close to its load and traffic limits, but anecdotal evidence indicates that the aggressive optimization setting rarely, if ever, interferes with valid traffic.
The conservative setting goes to great lengths to preserve states and idle connections, at the cost of some additional memory use.
Fragment Reassembly
The fragment reassembly options tied to scrub were significantly reworked in OpenBSD 4.6, which introduced the new set reassemble option to turn reassembly of fragmented packets on or off. If reassemble is set to off, fragmented packets are simply dropped unless they match a rule with the fragment option. The default is set reassemble on, which means that fragments are reassembled and that reassembled packets in which the do-not-fragment bit was set on individual fragments will have the bit cleared.
Cleaning Up Your Traffic
The next two features we’ll discuss, scrub and antispoof, share a common theme: They provide automated protection against potentially dangerous clutter in your network traffic. Together, they’re commonly referred to as tools for “network hygiene” because they sanitize your networking considerably.
Packet Normalization with scrub: OpenBSD 4.5 and Earlier
In PF versions up to and including OpenBSD 4.5, the scrub keyword enables network traffic normalization. With scrub, fragmented packets are reassembled, and invalid fragments—such as overlapping fragments—are discarded, so the resulting packet is complete and unambiguous.
Enabling scrub provides a measure of protection against certain kinds of attacks based on incorrect handling of packet fragments.[50] A number of supplementing options are available, but the simplest form is suitable for most configurations:
scrub in
In order for certain services to work with scrub, specific options must be set. For example, some NFS implementations won’t work with scrub at all unless you use the no-df parameter to clear the do-not-fragment bit on any packets that have the bit set. Certain combinations of services, operating systems, and network configurations may require some of the more exotic scrub options.
Packet Normalization with scrub: OpenBSD 4.6 Onward
In OpenBSD 4.6, scrub was demoted from stand-alone rule material to become an action you could attach to pass or match rules (the introduction of match rules being one of the main new PF features in OpenBSD 4.6). One other important development in the same rewrite of the scrub code was that the numerous packet-reassembly options were eliminated in favor of the new reassemble option, which simply turns reassembly on or off.
With the new scrub syntax, you need to supply at least one option in parentheses. The following works quite well for several networks in my care:
match in all scrub (no-df max-mss 1440)
This option clears the do-not-fragment bit and sets the maximum segment size to 1,440 bytes.
Other variations are possible, and even though the list of scrub options shrank somewhat for the OpenBSD 4.6 version, you should be able to cater to specific needs by consulting the man pages and doing some experimentation. For most setups, a global match rule like the one quoted earlier is appropriate, but keep in mind that you can vary scrub options on a per-rule basis if needed.
If you find yourself needing to debug a scrub-related problem, study the pf.conf man page and consult the gurus on the relevant mailing lists.
Protecting Against Spoofing with antispoof
Some very useful and common packet-handling actions could be written as PF rules, but not without becoming long, complicated, and error-prone rule set boilerplate. Thus, antispoof was implemented for a common special case of filtering and blocking. This mechanism protects against activity from spoofed or forged IP addresses, mainly by blocking packets that appear on interfaces traveling in directions that aren’t logically possible.
With antispoof, you can specify that you want to weed out spoofed traffic coming in from the rest of the world as well as any spoofed packets that might originate in your own network. Figure 10-1 illustrates the concept.
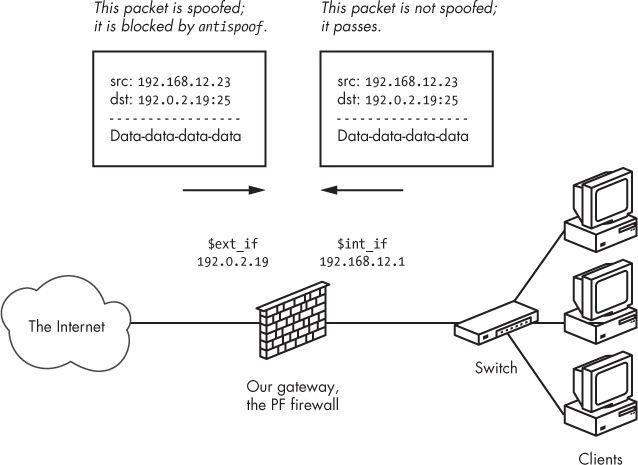
To establish the kind of protection depicted in the diagram, specify antispoof for both interfaces in the illustrated network with these two lines:
antispoof for $ext_if
antispoof for $int_if
These lines expand to complex rules. The first one blocks incoming traffic when the source address appears to be part of the network directly connected to the antispoofed interface but arrives on a different interface. The second rule performs the same functions for the internal interface, blocking any traffic with apparently local network addresses that arrive on interfaces other than $int_if. Keep in mind, however, that antispoof isn’t designed to detect address spoofing for remote networks that aren’t directly connected to the machine running PF.
Testing Your Setup
Now it’s time to dust off the precise specification that describes how your setup should work.
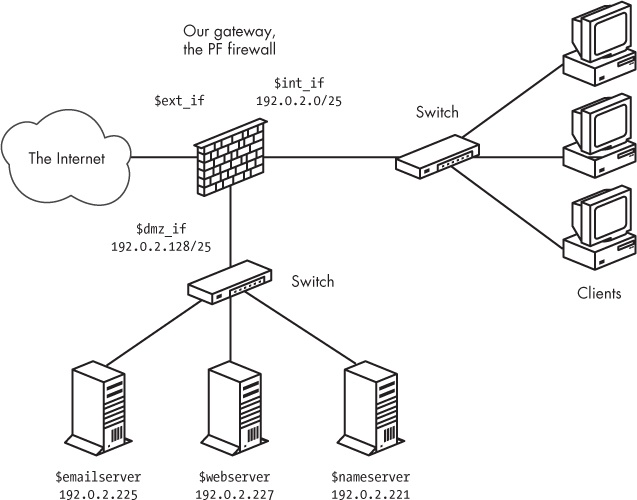
The physical layout of our sample network is centered on a gateway connected to the Internet via $ext_if. Attached to the gateway via $int_if is a local network with workstations and possibly one or more servers for local use. Finally, we have a DMZ connected to $dmz_if, populated with servers offering services to the local network and the Internet. Figure 10-2 shows the logical layout of the network.
The corresponding rule set specification looks something like this:
Machines outside our network should have access to the services offered by our servers in the DMZ and should not have access to the local network.
The machines in our local network, attached to
$int_if, should have access to the services offered by the servers in the DMZ and access to a defined list of services outside our network.The machines in the DMZ should have access to some network services in the outside world.
The task at hand is to make sure the rule set we have in place actually implements the specification. We need to test the setup. A useful test would be to try the sequence in Table 10-1.
Your configuration may call for other tests or could differ in some particulars, but your real-life test scenario should specify how packets and connections should be logged. The main point is that you should decide what the expected and desired result for each of your test cases should be before you start testing.
In general, you should test using the applications you expect the typical user to have, such as Web browsers or mail clients on various operating systems. The connections should simply succeed or fail, according to specifications. If one or more of your basic tests gives an unexpected result, move on to debugging your rule set.
Test Action | Expected Result |
Try a connection from the local network to each allowed port on the servers in the DMZ. | The connection should pass. |
Try a connection from the local network to each allowed port on servers outside your network. | The connection should pass. |
Try a connection on any port from the DMZ to the local network. | The connection should be blocked. |
Try a connection from the DMZ to each allowed port on servers outside your network. | The connection should pass. |
Try a connection from outside your network to | The connection should pass. |
The connection should pass.Try a connection from outside your network to | The connection should be blocked. |
Try a connection from outside your network to | The connection should be blocked. |
Try a connection from outside your network to | The connection should pass. |
Try a connection from outside your network to one or more machines in the local network. | The connection should be blocked. |
Debugging Your Rule Set
When your configuration doesn’t behave as expected, there may be an error in the rule set logic, so you need to find the error and correct it. Tracking down logic errors in your rule set can be time-consuming and could involve manually evaluating your rule set—both as it’s stored in the pf.conf file and as the loaded version after macro expansions and any optimizations.
Users often initially blame PF for issues that turn out to be basic network problems. Network interfaces set to wrong duplex settings, bad netmasks, and faulty network hardware are common culprits.
Before diving into the rule set itself, you can easily determine whether the PF configuration is causing the problem. To do so, disable PF with pfctl -d to see whether the problem disappears. If the problem persists when PF is disabled, you should turn to debugging other parts of your network configuration instead. If the problem disappears upon disabling PF and you’re about to start adjusting your PF configuration, make sure that PF is enabled and that your rule set is loaded with this command:
$ sudo pfctl -si | grep Status
Status: Enabled for 20 days 06:28:24          Debug: err
Status: Enabled tells us that PF is enabled, so we try viewing the loaded rules with a different pfctl command:
$ sudo pfctl -sr
match in all scrub (no-df max-mss 1440)
block return log all
block return log quick from <bruteforce> to any
anchor "ftp-proxy/*" all
Here, pfctl -sr is equivalent to pfctl -s rules. The output is likely to be a bit longer than that shown here, but this is a good example of what you should expect to see when a rule set is loaded.
For debugging purposes, consider adding the -vv flag to the pfctl command line to see rule numbers and some additional debug information, like this:
$ sudo pfctl -vvsr
@0 match in all scrub (no-df max-mss 1440)
  [ Evaluations: 341770    Packets: 3417668   Bytes: 2112276585  States: 125  ]
  [ Inserted: uid 0 pid 14717 State Creations: 92254 ]
@1 match out on nfe0 inet from 10.0.0.0/8 to any queue(q_def, q_pri) nat-to
(nfe0:1) round-robin static-port
  [ Evaluations: 341770    Packets: 0         Bytes: 0           States: 0    ]
  [ Inserted: uid 0 pid 14717 State Creations: 0 ]
@2 match out on nfe0 inet from 192.168.103.0/24 to any queue(q_def, q_pri)
nat-to (nfe0:1) round-robin static-port
  [ Evaluations: 68623     Packets: 2138128   Bytes: 1431276138  States: 103  ]
  [ Inserted: uid 0 pid 14717 State Creations: 39109 ]
@3 block return log all
  [ Evaluations: 341770    Packets: 114929    Bytes: 62705138    States: 0    ]
  [ Inserted: uid 0 pid 14717 State Creations: 0 ]
@4 block return log (all) quick from <bruteforce:0> to any
  [ Evaluations: 341770    Packets: 2         Bytes: 104         States: 0    ]
  [ Inserted: uid 0 pid 14717 State Creations: 0 ]
@5 anchor "ftp-proxy/*" all
  [ Evaluations: 341768    Packets: 319954    Bytes: 263432399   States: 0    ]
  [ Inserted: uid 0 pid 14717 State Creations: 70 ]
Now you should perform a structured walk-through of the loaded rule set. Find the rules that match the packets you’re investigating. What’s the last matching rule? If more than one rule matches, is one of the matching rules a quick rule? (As you probably recall from earlier chapters, when a packet matches a quick rule, evaluation stops, and whatever the quick rule specifies is what happens to the packet.) If so, you’ll need to trace the evaluation until you hit the end of the rule set or the packet matches a quick rule, which then ends the process. If your rule set walk-through ends somewhere other than the rule you were expecting to match your packet, you’ve found your logic error. Be sure to watch out for match rules. If you can’t determine why a specific packet matched a particular block or pass rule, the reason could be that a match rule applied an action that made the packet or connection match filtering criteria other than the expected ones.
Rule set logic errors tend to fall into three types:
Your rule doesn’t match because it’s never evaluated. A
quickrule earlier in the rule set matched, and the evaluation stopped.Your rule is evaluated but doesn’t match the packet after all, due to the rule’s criteria.
Your rule is evaluated and the rule matches, but the packet also matches another rule later in the rule set. The last matching rule is the one that determines what happens to your connection.
Chapter 9 introduced tcpdump as a valuable tool for reading and interpreting PF logs. The program is also very well suited for viewing the traffic that passes on a specific interface. What you learned about PF’s logs and how to use tcpdump’s filtering features will come in handy when you want to track down exactly which packets reach which interface.
Here’s an example of using tcpdump to watch for TCP traffic (but not SSH or SMTP traffic) on the xl0 interface and to print the result in very verbose mode (vvv):
$ sudo tcpdump -nvvvpi xl0 tcp and not port ssh and not port smtp
tcpdump: listening on xl0, link-type EN10MB
21:41:42.395178 194.54.107.19.22418 > 137.217.190.41.80: S [tcp sum ok]
3304153886:3304153886(0) win 16384 <mss 1460,nop,nop,sackOK,nop,wscale
0,nop,nop,timestamp 1308370594 0> (DF) (ttl 63, id 30934, len 64)
21:41:42.424368 137.217.190.41.80 > 194.54.107.19.22418: S [tcp sum ok]
1753576798:1753576798(0) ack 3304153887 win 5792 <mss 1460,sackOK,timestamp
168899231 1308370594,nop,wscale 9> (DF) (ttl 53, id 0, len 60)
The connection shown here is a successful connection to a website.
There are more interesting things to look for, though, such as connections that fail when they shouldn’t according to your specifications or connections that succeed when your specification says they clearly shouldn’t.
The test in these cases involves tracking the packets’ path through your configuration. Once more, it’s useful to check whether PF is enabled or whether disabling PF makes a difference. Building on the result from that initial test, you then perform the same kind of analysis of the rule set as described previously:
Once you have a reasonable theory of how the packets should traverse your rule set and your network interfaces, use
tcpdumpto see the traffic on each of the interfaces in turn.Use
tcpdump’s filtering features to extract only the information you need—that is, to see only the packets that should match your specific case, such asport smtp and dst 192.0.2.19.Find the place where your assumptions no longer match the reality of your network traffic.
Turn on logging for the rules that may be involved and turn
tcpdumploose on the relevantpfloginterface to see which rule the packets actually match.
The main outline for the test procedure is fairly fixed. If you’ve narrowed down the cause to your PF configuration, again, it’s a case of finding out which rules match and which rule ends up determining whether the packet passes or is blocked.
Know Your Network and Stay in Control
The recurring theme in this book has been how PF and related tools make it relatively easy for you, as the network administrator, to take control of your network and to make it behave the way you want it to behave—in other words, how PF allows you to build the network you need.
Running a network can be fun, and I hope you’ve enjoyed this tour of what I consider to be the best tool available for network security. In presenting PF, I made a conscious decision early on to introduce you to the methods and ways of thinking via interesting and useful configurations, rather than offering a full catalog of available features or, for that matter, making this book the complete reference. The complete PF reference already exists in the man pages, which are updated every six months with the new OpenBSD releases. You can also find further information in the resources I’ve listed in Appendix A.
Now that you have a broad, basic knowledge of what PF can do, you can start building the network according to your own ideas of what you need. You’ve reached the point where you can find your way around the man pages and locate the exact information you need. This is when the fun part starts!
[49] If you’ve yet to be hit by this particular kind of nastiness, you will be. Here’s a writeup about a DDOS situation where the hamfistedness was about equally distributed between both sides—the attacker and the attacked: http://bsdly.blogspot.com/2012/12/ddos-bots-are-people-or-manned-by-some.html. Your attackers will likely be smarter and better equipped than these.
[50] Some notable attack techniques, including several historical denial-of-service setups, have exploited bugs in fragment handling that could lead to out-of-memory conditions or other resource exhaustion. One such exploit, which was aimed at Cisco’s PIX firewall series, is described in the advisory at http://www.cisco.com/en/US/products/products_security_advisory09186a008011e78d.shtml.