
![]()
How to Create a Business Case for Web Application Security
The security of web applications, particularly those that are transaction platforms and those in a constant state of change, is costly to achieve and to maintain. Now, pile on privacy and regulatory-compliance testing and remediating, and the related costs become frustrating to senior managers who see no tangible or visible improvement to the web applications. These expenses must be cost justified in terms of risk and return on investment.
The key to getting the IT security governance committee to fund the appropriate compliance budget is to speak its language. In order to do that, risks need to be expressed in terms of the costs for executives. Specifically, expenses need to be identified as: potential cost of losses, mitigation costs, the total costs (potential cost of losses plus mitigation costs), and residual costs.
In order to be clear and meaningful for the intended audience, the material should be presented graphically, with changes depicted in both cost and risk over time. This trending analysis will be the most useful in supporting the IT security governance committee’s ability to make well-informed decisions about how to most effectively invest in security and thereby derive optimal payback for stakeholders.
The steps to performing this analysis are:
- Assess the risk.
- Calculate the annual loss expectancy.
- Calculate the cost of prevention and remediation.
- Calculate the return on security investment (ROSI).
- Create a business case.
- Measure and cost justify residual risk.
- Determine whether ROSI objectives are met.
Assessing the Risk
The first step in this process is to identify risk from a business perspective and then quantify the cost impact that would take place if the risk becomes a reality. For instance, you might identify the damage to the brand that would result from a Trojan attack causing the theft of clients’ credit card information. The risk is assessed as the potential money lost as a result of a single incidence of the event, which might be $10 million. The annual loss expectancy is calculated by multiplying the estimated number of occurrences of this particular event; in this case, each at a cost of $10 million.
Identifying Risk and Its Business Impact
The costs of IT security risk associated with web applications for breaches and noncompliance of regulatory/standards and the resulting negative impact on business can be broadly identified as follows:
- loss of revenue or production due to unavailability of production resource
- time and effort needed to recover from a security-related loss of production
- legal ramifications and expenses
- damage to brand
- regulatory compliance violations
- privacy compliance violations
- damage to client and vendor relationships
- loss of intellectual, competitive, or proprietary information
- unrealized profits resulting from the inability to demonstrate to clients/vendors/partners a strong security process
The cost of risk is the resulting impact on business that may be incurred should a risk become a reality. Determining the cost of a potential event is difficult at best. However, it can be accomplished by employing one or more quantitative and qualitative methods, and should be undertaken by those most qualified to do so. Qualified assessors include unit profit and loss managers, stakeholders, and executives with insight into how an event would quantitatively affect their work domain.
The cost of various types of events can be viewed in terms of being low, medium, or high. This qualitative analysis is not useful in itself but may assist management in determining how to prioritize the order in which it will perform a more in-depth risk analysis.
Estimating the Chance of Occurrence of Each Event
Creating a case to present to senior management about web application security involves calculating the estimated cost of risk versus the cost of preventing or remediating its causes. In order to calculate the cost of risk, it is first necessary to estimate the chance of each security event occurring over the course of a budget year. To do this, you would first identify the types of threats, then use either qualitative or quantitative risk analysis, and finally calculate annual loss expectancy by associating a cost with each security event.
Once you determine the likelihood of an event occurring over the course of a budget year, the most useful way of expressing that likelihood is as a percentage representing the possibility of the event or total number of events occurring in any one year.
However, any likelihood estimate should be adjusted to account for changes in the security environment. There are typically evolving waves of new threats that may affect the likelihood of occurrence, such as:
- new Internet-based security attacks
- new viruses
- malware of all sorts
- distributed denial of service attacks (DDOS)
- identity theft
- risk created internally within the host organization of a web application, simply through the process of change and maintenance of the application and its environment
Qualitative and Quantitative Risk Analysis
As part of risk analysis, one needs to determine the chance of an event occurring. There are two basic approaches to determining the probability of an event occurring. They are: qualitative, which is more subjective and based upon commonsense and current knowledge about security issues, and quantitative, which relies upon published statistical information about chances of occurrences and mathematical calculations.
The qualitative method is the one most often used, as it is intuitively understood and most quick to estimate. It is done by first considering various events in terms of their risk and the relative cost of loss per occurrence. Then, you plot out where each vulnerability would fall in terms of threat and vulnerability levels using a graph like the one in Figure 8-1.
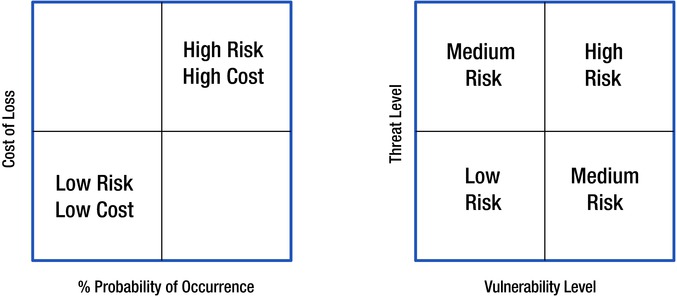
Figure 8-1. Potential cost versus probability of occurrence
In Figure 8-1, the cost of loss is plotted along the vertical axis and the percentage of the probability of occurrence is plotted along the horizontal axis. For any vulnerability, the higher the chance of occurrence and the higher the cost, the higher its risk. The highest risks reside in the upper-right-hand quadrant and the lowest risks, in the lower-left-hand quadrant.
Quantitative analysis is more theoretical and based upon the statistical probability of any type of event occurring in an environment. The probability is derived from the historical trends for that particular industry and geography, and should include other relevant statistical factors. I mention it here only for completeness, but it is not very practical.
Calculating Annual Loss Expectancy
The annual loss expectancy (ALE) is the estimated annualized cost for the occurrence of any type of event. This number is useful for comparison with the annual cost of mitigation. The ALE for an event is calculated by multiplying the estimated cost of a single event by the number of times it is expected to occur. The calculation is done as follows:
![]()
For example, if the estimated cost per a particular event is $100,000, and the estimated number of occurrences per year is 2, then:
![]()
and the annual loss expectancy is $200,000.
The annual loss expectancy combined with the qualitative risk level provides decision criteria for prioritizing the order in which risks are dealt with. You can feed all this information directly into the business case covered later in this chapter in the section “Creating the Business Case for Executives.” The cost of required mitigation or remediation is considered when prioritizing a risk management plan and is discussed in the next section, “Calculating the Cost of Prevention and Remediation.”
Various methods can be used either separately or together with the implementation of an averaging metric to estimate the cost per occurrence of an event. These methods may include:
- soliciting expert advice from financial management, lawyers, and risk management consultants
- conducting a straw poll of stakeholders, each estimating the downside cost of an event
- participating in a fact-gathering survey of similar businesses, each of which provides factual and straw poll estimates of the cost of an event
- purchasing statistical information from industry experts regarding the cost of an event
- obtaining statistical information from industry associations about the cost of an event experienced by their membership
Calculating the Cost of Prevention and Remediation
The security team needs to identify all preventative countermeasures and remediation steps that will be taken, at least as a first-pass estimate, in order to include these items in the cost-justification business case that will be made to executives.
These steps should include hiring personnel to assist in creating policy and in executing it via implementing procedures and processes. They must also include creating control points and recommending technology and security services. The technology may be purchased, leased, or outsourced. The services similarly may be built in house, such as in-house web application auditing, or a less biased way is to outsource that service.
Once all the costs are known or estimated, they can be combined with the estimated cost of risk to come up with return-on-security investment calculations, as shown in the next section.
Calculating the Return on Security Investment
Once the total cost of security mitigation is determined, factoring in any costs for managing residual risk, calculating the ROSI, becomes straightforward. It is done as follows:
![]()
For example, if the estimated cost of mitigation is $20,000, and the estimated cost of risk is $200,000:
![]()
and ROSI is 10%.
When calculating ROSI, it is important to allocate mitigation costs on a prorated basis across all risks to which they apply. This allows profit-and-loss managers and associated stakeholders to most accurately calculate and evaluate ROSI.
Executives comprehend the value of web application security with more clarity when the variables are expressed in terms of dollars and relative risk. It is more likely an executive committee will respond to a security budget if they can understand:
- the potential cost of losses associated with a security breach
- the relative risk of a breach(es) occurring within a specific period of time, such as within the next budget year
- the cost of reducing the relative risk
- the amount by which the relative risk is reduced based on the investment-in-security expenditures
A powerful method of estimating the damage of a web-application-security breach is to list the most likely outcomes of a breach and ask the members of the executive committee to ballpark the resulting costs in an executive straw poll. For instance, the outcomes may be:
- loss of production for one day
- loss of production for one week
- loss of electronic communications with clients for two days
- incorrect information collected and presented on the client support web site
The estimated annualized cost due to security breaches needs to incorporate several factors:
- the estimated cost of each breach
- the potential number of breaches during a one-year period
- the risk of a breach or breaches actually occurring
- the tolerance of the governance committee to sustaining such a breach. This is an emotional factor, which, in the author’s experience, simply cannot be ignored.
The ability to estimate the potential number of breaches in a year is very difficult to estimate since it is based on many complex, difficult-to-research factors, including:
- statistical estimated similar breaches for similar industries
- estimates of new Internet threats
For expediency, it is useful to combine the estimated cost of each breach and the guesstimated number of breaches into a single number at the time of completing the straw poll. So, we may include as breaches a virus infection and a web site compromise that lead to theft of client financial information.
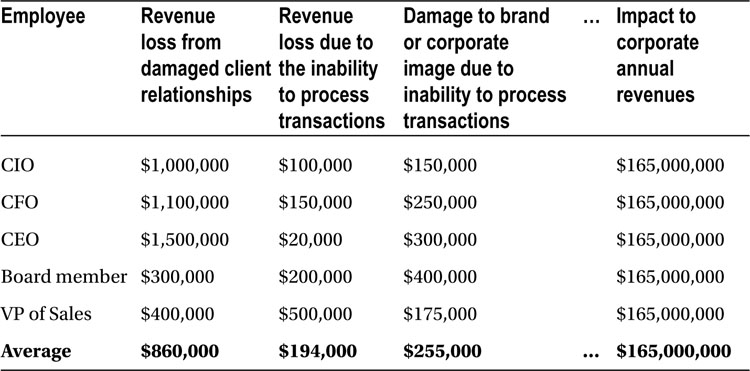
Three spreadsheets compiled based on a straw poll are shown in Tables 8-1 through 8-3. For clarity, separate tables are devoted to cost, risk, and tolerance. The tables illustrate three of the seven event descriptions from the section “Identifying Risk and Its Business Impact.” The additional spreadsheets are included with the downloads for this book.
Table 8-1. Cost Estimates for Various Web Application Security Events Based on Straw Poll
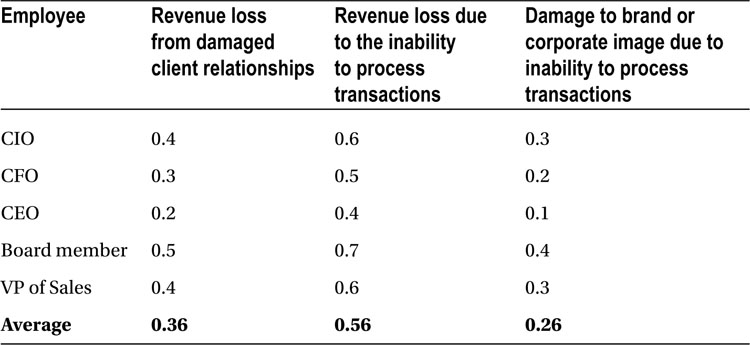
In Table 8-2, the assessment of risk varies from .0 to 1, where 0 represents zero risk and 1 represents maximum risk. The numbers represented as fractions between 0 and 1 in the table indicate each manager’s assessment of risk for each event.
Table 8-2. Adjustment for Risk for Various Web Application Security Events Based on Straw Poll
In Table 8-3, the tolerance for risk varies from .0 to 1, where 0 represents maximum tolerance to risk and 1 represents minimum tolerance to risk. The numbers represented as fractions between 0 and 1 in the chart indicate each manager’s tolerance for risk for each event. It should be noted that indicating a zero essentially means the manager will accept the risk, no matter the potential financial cost of a resulting security breach.
Table 8-3. Adjustment for Tolerance for Various Web Application Security Events Based on Straw Poll
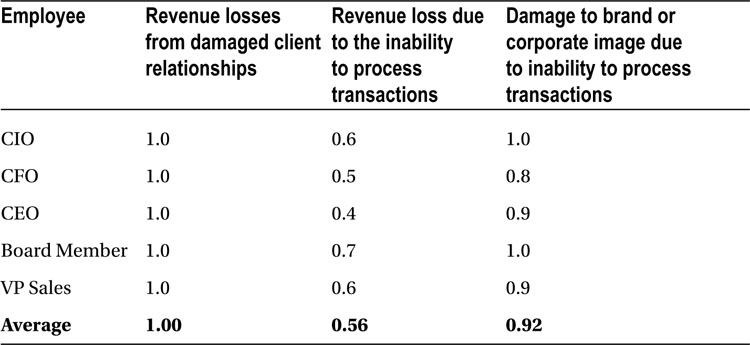
For example, from Table 8-1, the revenue loss from damaged client relationships is averaged at $860,000. From Table 8-2, the associated average risk is 0.36. Similarly, from Table 8-3, the associated tolerance for risk is 1.0. We can now represent the executives’ opinion of the associated financial value of the risk along with their perceptions that the risk will actually come to fruition, along with their tolerance for the risk coming to fruition, by multiplying the three values together.
In this example, the adjusted revenue loss is expressed as
![]()
or,
![]()
Creating the Business Case for Executives
You can create a business case that justifies expenditures for web application security fairly easily created by correlating three factors:
- the cost of risk, taking into account relative risk and tolerance for risk
- the cost for preventative and remedial measures
- a variety of return-on-investment calculations
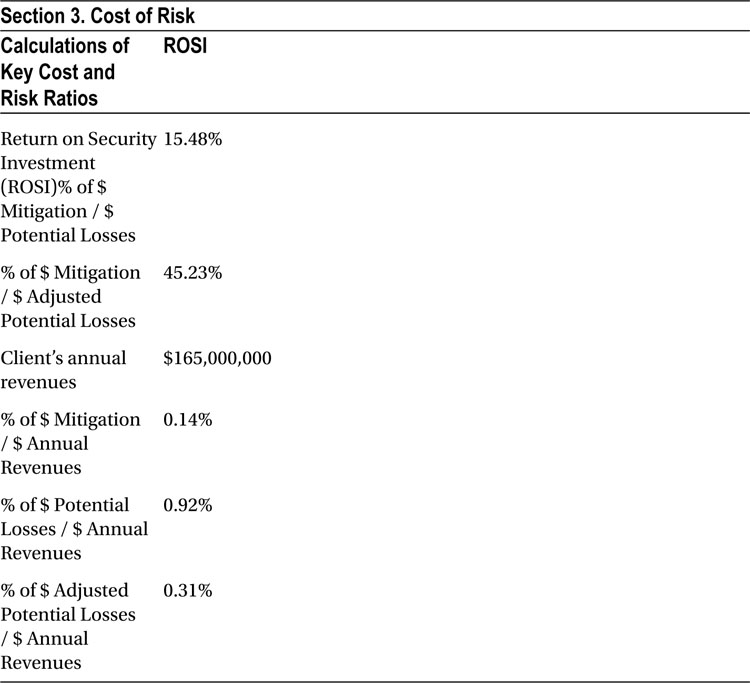
The results of the straw poll are used to create an example business case, as shown in Table 8-4. The cost of risk is detailed in Section 1, “Cost of Risk,” where the cost is linked directly to the results of the straw polls and a high, medium, or low risk is assigned for each factor. For simplicity and clarity the estimates of risk and tolerance for risk are shown both as quantitative and as qualitative values in Table 8-4, which is the sample business case.
Table 8-4. Sample Business Case for Calculating Annualized Return on Web Application Security Investment
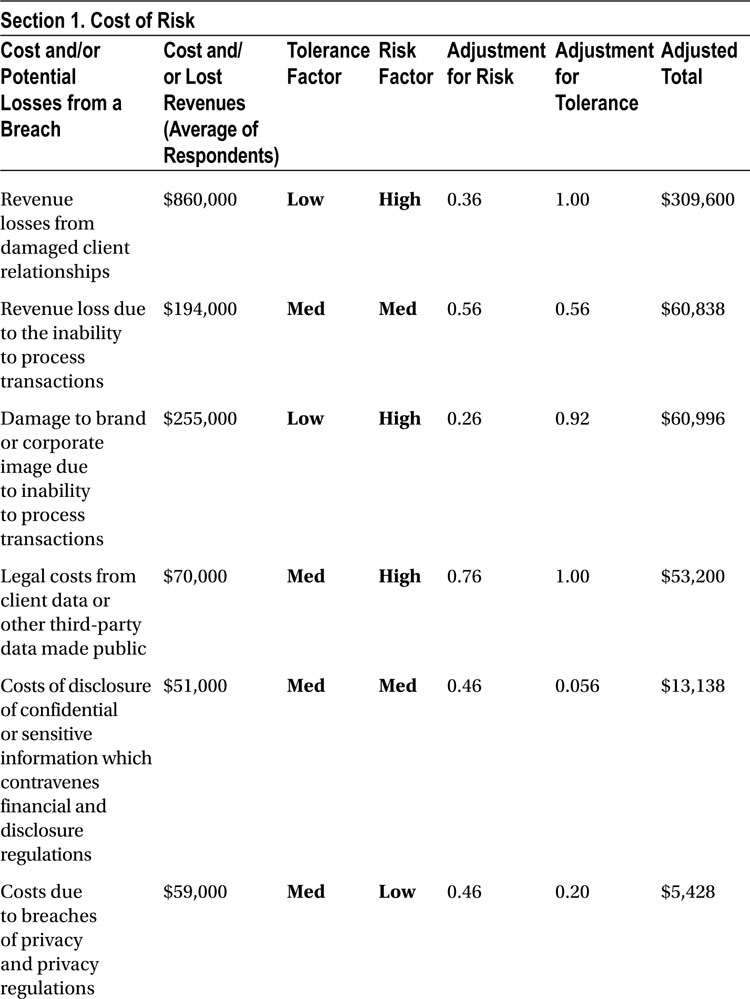
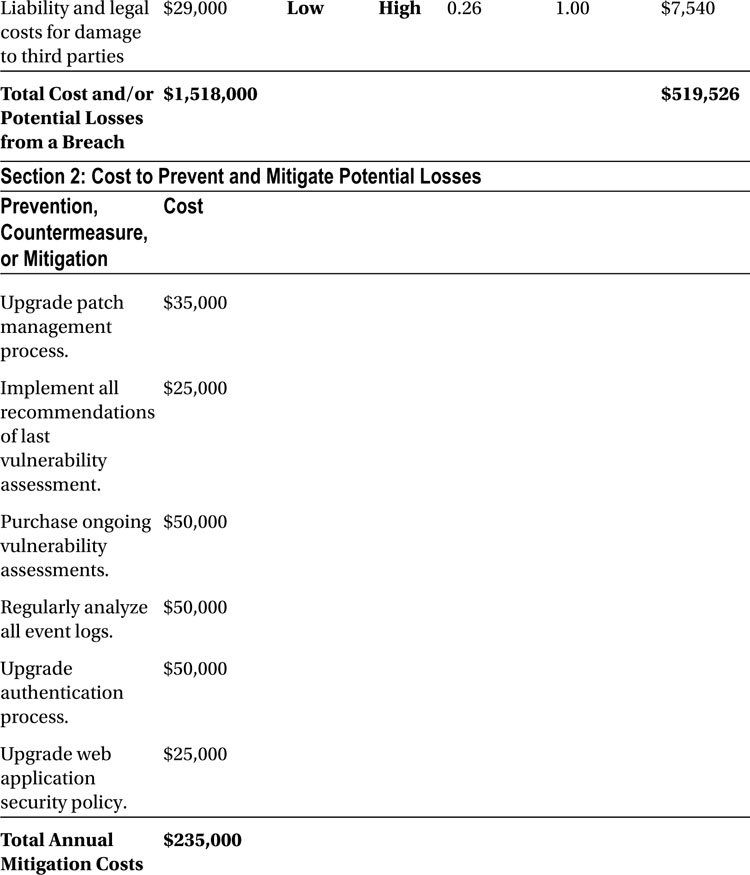
Section 2, “Cost to Prevent and Mitigate Potential Losses,” shows a budget for preventative and mitigation factors related to security, as can be composed by your web application security team.
The bottom-line ratios of return on investment, risk relative to gross income, and prevention/mitigation costs relative to gross income are shown in Section 3, “Return on Investment.”
Measuring and Cost-Justifying Residual Risk
Measuring residual risk is an ongoing responsibility and it is often thankless since nobody wants to hear that risk still exists after spending considerable funds on eliminating it. One of the easiest ways of identifying residual risk is to create or purchase a monthly security health score, which should include a delta report of how your security health is changing month to month. Calculating the risk associated with residual vulnerabilities is similar to the process already described in this chapter. It is always important to understand the difference between when a vulnerability is merely dealt with and when it is effectively fixed. When cost-justifying a security budget and subsequently cost-justifying it for remedial risk, everything comes down to calculating if the ROSI is satisfactory.
Calculating Security Status and Residual Risk with a Monthly Security Health Score
A simple-to-create and simple-to-convey method of estimating residual risk involves using a monthly web-application-security health report. The report is based upon statistical results of what actually occurred in the application security environment under scrutiny.
You should get a proposal of the list of factors to be considered from your security team and have it approved by the security governance committee so that the results are meaningful to all concerned. The factors will probably change over time in accordance with changes in the business environment. Examples of factors are:
- the number of high-risk vulnerabilities found during the previous month’s web application vulnerability scans
- the number of high risks remediated in one day, week, month, or more than one month
- the number of servers that don’t have the latest recommended security patches applied
- the number of workstations that don’t have the latest recommended security patches applied
The factors, criteria of how to calculate scores for each factor, and weighting of each factor can then be tabulated in a spreadsheet, with a perfect score being 100%. The numeric score and the details of its calculation are valuable planning information, and the security governance team will be able to easily absorb a single percent or alphabetic score.
The results can be reported numerically, such as with a percentage, and alphabetically, as A, B, C, or D. It is most useful to also record scores over time in order to see a pattern of performance.
Figure 8-2 shows an example scorecard. The score is calculated by using control points to create scoring criteria. In this example, the four major scoring criteria are: server patch management, account administration, virus/spam problems, and undiagnosed security events. A score for a particular month is allocated for each criterion and a percentage-based score out of a total perfect score is calculated. The score is multiplied by applying a weighting factor for each criteria—in this case 25% weighting for each criteria—in order to come up with a total weighted score of 81%, which in turn is assigned an alphabetical value of A-.
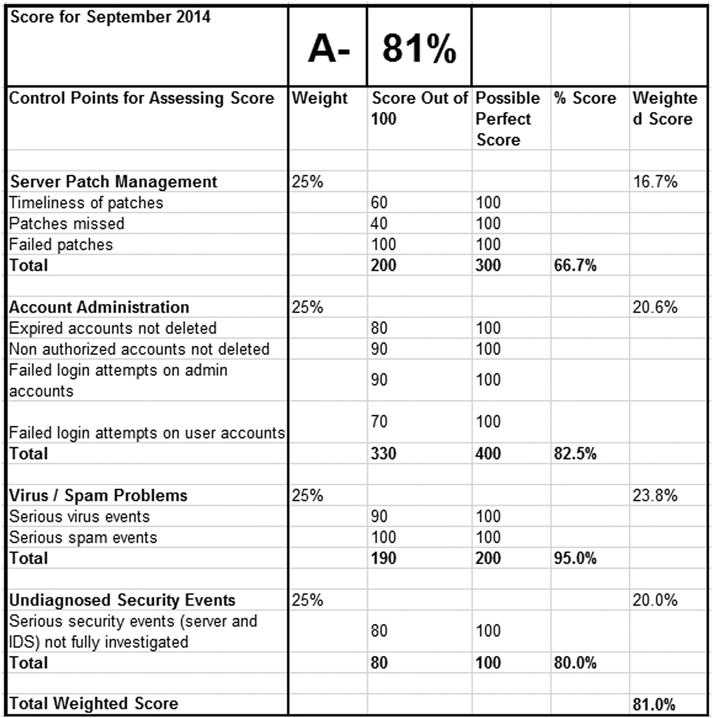
Figure 8-2. A monthly security health scorecard
How to Cost-Justify and Triage Vulnerabilities for Remediation
We have already looked at cost-justifying remediation and calculating residual risk. However, the calculations do not take into consideration the timing or order of remediation. Deciding on the order of remediation directly impacts risk at any point in time plus the timing of expenditures necessary to remediate.
Since information security is fundamentally concerned with both risk management and optimizing the return on investment of key assets, it makes sense to triage the vulnerabilities for remediation based upon the same principles.
If your corporate security policy sets out criteria for evaluating remediation, then it is relatively simple to create a remediation plan.
The data for creating a remediation plan type starts with identifying the residual vulnerabilities, their associated risk, the number of occurrences of each vulnerability, and the estimated time to remediate each type of vulnerability, along with the associated costs of risk. The technical vulnerability information can be obtained from a web-application-security audit.
The key asset values should be documented as part of the creation of an overall IT security policy and should be regularly reviewed thereafter, particularly in organizations involved with:
- mergers and acquisitions
- sharing of data with partnering organizations
- sharing of data with customers and vendors
- creating and updating web-enabled applications
- change in general
The remediation plan can therefore be optimized according to several parameters, such as minimizing impact, remediating the most number of vulnerabilities in a given amount of time, or mitigating the highest risk vulnerabilities.
It is good security practice for the person creating the mitigation plan to share the plan in written form with management for their buy-in.
As an ongoing practice, it is useful if possible to track vulnerabilities by type, frequency of occurrence, the time lapse between discovering a vulnerability and actually beginning remediation, and time to remediate. This information is useful in identifying the root cause of problems and for getting financial justification for more IT security resources.
Noting the Difference Between Remediating and Fixing
Remediation is often confused with getting the problem fixed. Too often, remediation is not successful in resolving the initial vulnerability. This is particularly true when it takes place over a period of a few days or weeks after the discovery of a vulnerability, especially in dynamic environments. This is also true when remediation steps are not documented and relayed to all sources of potential change associated with the change management process.
Remediation can be undone or compromised by operational processes and can be introduced by various parties, including consultants and subcontractors as well as in-house code writers and IT/security operations staff.
It is suggested that when remediation is not successful, one should document:
- which vulnerabilities have been affected and, more important, which key assets are at risk
- why the remediation was unsuccessful or how the remediation was reversed
- recommended next steps to either reimplement the original remediation recommendation or alternative suggestions to resolve the vulnerability
It is both important and useful to keep a log of why remediation was not successful in order to identify the root causes of problems, and subsequently modifying policies and processes helps improve the change management process. This information should then be fed into the IT-security budgeting process.
Calculating the Cost of Mitigation
Security professionals are well acquainted with determining the costs of mitigation. Senior executives sometimes think they too are familiar with these costs based on ads they have read about antivirus and firewall technology.
The danger here is that it is all too easy for those concerned to focus on technology as the primary mitigation for security and compliance.
It is well advised to address the following areas of mitigation:
- reengineering processes, both technological and human-oriented
- security technology
- physical security
- training and awareness
- third-party auditing to verify the effectiveness of all of the above
From an IT security governance perspective, the optimal cost point for mitigation is where the total costs of risk and mitigation are lowest. This point can be graphically determined, as done in Figure 8-3.
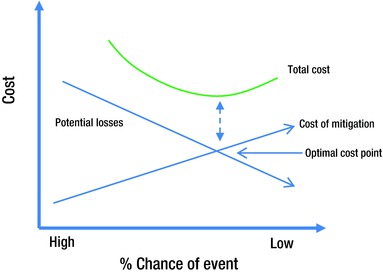
Figure 8-3. Optimal cost point for mitigation
Once mitigation costs are determined, it is important to express to the IT security governance committee that mitigation only goes so far and that some residual risk remains even after spending on mitigation takes place. The residual risk can be expressed as the cost of risk that remains after mitigation is implemented. As shown in Figure 8-4, expenditures on mitigation reduce the cost of exposure to risk.
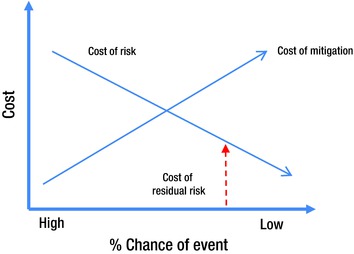
Figure 8-4. Mitigation cost vs. % chance of event occurring
Your IT security governance committee may decide to deal with residual risk by:
- accepting the risk
- passing on the risk (by purchasing insurance)
- further mitigation
Measuring the Effectiveness of Mitigation
It is paramount to close the risk management loop by comparing the planned and actual results of mitigation. The goal is to identify clearly whether the risk level has changed and what consistent metrics will be used to base a conclusion on. Once again, this may be difficult to accomplish directly, but there are common metrics for measuring and comparing the results of implementing mitigation. The metrics should always:
- produce repeatable, consistent results
- be understandable
- be reasonably simple to use over time
The following list of resources and frameworks provide a good initial guide to metrics that can be used for consistently measuring and reporting on risk:
- “Incorporating Security into the Enterprise Architecture Process”: (www.gartner.com/doc/488575/incorporating-security-enterprise-architecture-process) This white paper, offered by Gartner and produced by Enterprise Information Security Architecture (EISA), can be used as an architecture for measuring risk.
- Architecture Framework Forum: (www.architectureframework.com/dodaf/) This web site is devoted to enterprise architecture frameworks and technologies.
- Institute for Enterprise Architecture Developments: (www.enterprise-architecture.info/) The institute’s web site offers the extended enterprise architecture framework (E2AF) and an information exchange area.
- “Federal Enterprise Architecture” (FEA): (www.whitehouse.gov/omb/e-gov/fea/) The US Government’s Office of Management and Budget offers various papers related to FEA guidance, reference models, and management tools.
- Capgemini’s integrated architecture framework: (http://www.ca.capgemini.com/resources/the-integrated-architecture-framework-explained)
- “NIH Enterprise Architecture Framework”: (https://enterprisearchitecture.nih.gov/Pages/Framework.aspx) The US Government’s National Institutes of Health Enterprise Architecture offers this framework outlining the enterprise information technology environment at NIH.
- Open Security Architecture: (www.opensecurityarchitecture.org/cms/index.php ) The OSA’s web site offers various information on open security architecture.
- Open Group architecture framework: (http://pubs.opengroup.org/architecture/togaf8-doc/arch/)
- Zachman Framework: (www.zachman.com/about-the-zachman-framework)
- Control points from the COBIT framework: (www.isaca.org/Template.cfm?Section=COBIT6&Template=/TaggedPage/TaggedPageDisplay.cfm&TPLID=55&ContentID=7981)
The following tests and trends already occurring within your company can be used to measure and report on risk:
- vulnerability assessments
- penetration tests
- time trends in frequency of occurrence and the real costs of security events, privacy violations, and policy-compliance violations
- time trends in cost to recover from events
- time trends in frequency of policy-compliance violations that do not necessarily cause any financial losses, including Trojans, viruses, root kits, unauthorized logins, attempted port scans, frequency of dropped packets, frequency of password life cycle, breaches, and frequency of rescheduled/cancelled IT security governance meetings with business managers.
Determining Whether Return on Security Investment Objectives Are Met
Tires meet the road when it is time to determine whether or not ROSI objectives for security/policy/compliance have been met. Conveying this determination is essential to building (or destroying) the credibility of the group that made the mitigation recommendations in the first place.
Determining ROSI is quite simple, as discussed previously in the “Calculating the Return on Security Investment” section. The actual costs resulting from events are compared with the projected costs after mitigation. If the mitigation was successful, then the actual costs should be near or below the projected costs. This information can be presented as shown in Figure 8-5 (an updated version of Figure 8-3). For purposes of accuracy, new trends that developed in the security environment over the period of study should be considered. If the new trends increased the cost of losses, and the effects can be quantified, then the results should be reported accordingly.
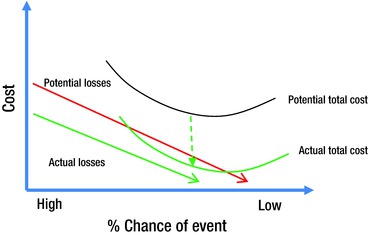
Figure 8-5. Projected vs. actual cost of losses
Summary
The task of getting approval for a sufficient budget for web application security, including privacy-regulatory compliance, is simplified when financial executives are presented with sufficiently clear data to build a cost-justifying business case.
The IT security governance body should request that graphic presentations of data be provided to them by the security team. The graphs should depict the relationship between the cost of risk and the cost of mitigation. The presentation process should occur both at the time of the budget request, in order to show the intended plan, and after the budget cycle, to show the actual results.
Financial managers and stakeholders should participate in a straw poll to estimate business costs resulting from potential security breaches. This is an easy way to engage them in the security process, and it will make the cost justification business case more meaningful to them. A monthly web application health scorecard is a useful tool for measuring and communicating ongoing security health and security posture for all concerned.
Residual risks and their mitigation will be ongoing and therefore will need to be included in ongoing cases made to executives for cost-justifying web application security.