
![]()
In-Memory OLTP Migration Tools
This appendix discusses several SQL Server 2014 tools that help with In-Memory OLTP migration.
Management Data Warehouse Enhancements
One of the challenges during In-Memory OLTP migration is determining the list of objects that will benefit the most from it. The Pareto principle can be easily applied here:if migration targets are identified correctly, you can achieve 80 percent of possible gains by spending 20 percent of your time.
Management Data Warehouse in SQL Server 2014 has several enhancements that can help you to identify migration targets in the system. It detects the tables that suffer from lock and latch contention along with frequently executed stored procedures that consume the most CPU resources on the server. Management Data Warehouse provides a set of reports that allows you to estimate the amount of migration work and performance gain you will achieve after it is done.
Let’s go through the process and configure Management Data Warehouse in the system. You can collect metrics from SQL Server 2008 and 2012 instances as long as you are using Management Data Warehouse from SQL Server 2014.
![]() Note In this appendix, I am using the demo application and WebRequests*_Disk tables from Chapter 2 of this book. I also added several LOB columns and trigger to the tables to illustrate how tools provide information about constructs that are not supported in In-Memory OLTP.
Note In this appendix, I am using the demo application and WebRequests*_Disk tables from Chapter 2 of this book. I also added several LOB columns and trigger to the tables to illustrate how tools provide information about constructs that are not supported in In-Memory OLTP.
You can configure Management Data Warehouse in the Management ![]() Data Collection section of SQL Server Management Studio, as shown in Figure D-1.
Data Collection section of SQL Server Management Studio, as shown in Figure D-1.

Figure D-1. The Configure Management Data Warehouse menu
In the first step in the process you need to choose the server and database where you will store the collected data. You can choose an existing database or create a new one, as shown in Figure D-2.

Figure D-2. Selecting the server and database for Management Data Warehouse
After the server and the database are selected, you can setup Management Data Warehouse security by assigning logins to the database roles, as shown in Figure D-3.

Figure D-3. Configuring Management Data Warehouse security
This is the final configuration step of the wizard, and clicking the Next button will bring you to the confirmation page. Click the Finish button; successful execution will bring the Success page shown in Figure D-4.
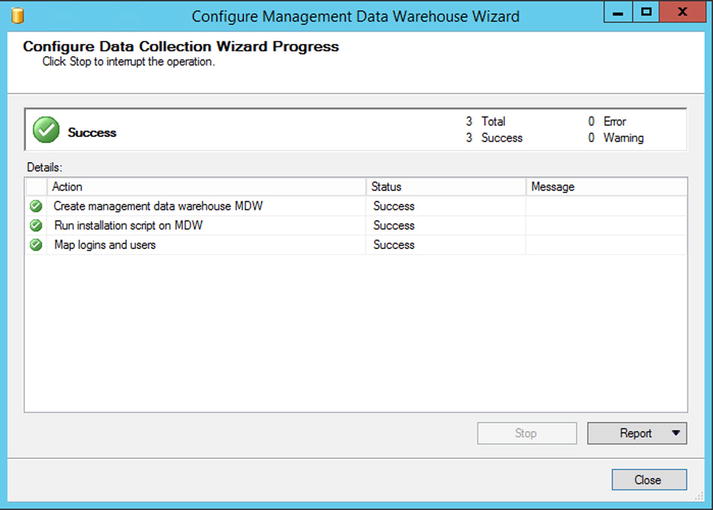
Figure D-4. Configuring Management Data Warehouse - Success confirmation
After Management Data Warehouse is created, you should configure and start the Data Collectors by completing another wizard from the Management ![]() Data Collection menu. Figure D-5 illustrates its location.
Data Collection menu. Figure D-5 illustrates its location.

Figure D-5. The Configure Data Collection menu
In this wizard, you should provide connection information to Management Data Warehouse and choose Transaction Performance Data Collection Sets in the list of the data collectors, as shown in Figure D-6.

Figure D-6. The Configure Data Collection Wizard
After the wizard is completed, you will see two Data Collection Sets, as shown in Figure D-7. Make sure that both of them are started and collecting the information.

Figure D-7. Data Collection Sets
You can analyze collected data by using the Transaction Performance Analysis Overview report, which is available in the Management Data Warehouse database, as shown in Figure D-8.
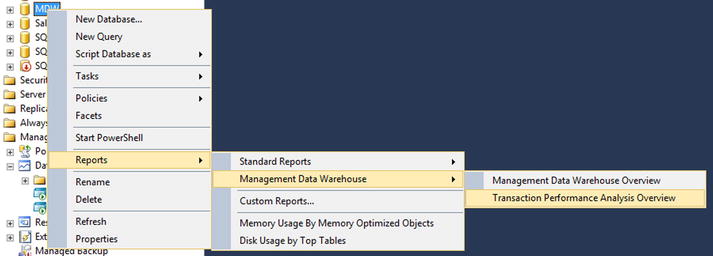
Figure D-8. Management Data Warehouse reports
The Transaction Performance Analysis Overview report is shown in Figure D-9.

Figure D-9. The Transaction Performance Analysis Overview report
From this page, you have access to three drill-down reports. Tables Usage Analysis and Table Contention Analysis provide table-related statistics based on how often tables are accessed and how much they suffer from lock and latch contention.
Figure D-10 illustrates the output of the Table Contention Analysis report. As you can see, it displays the output in four quadrants based on the amount of work required for the migration and the estimated performance gain it will provide. Migration of the objects from the upper right quadrant will provide the most performance gain with the lowest amount of work involved.

Figure D-10. The Table Contention Analysis report
You can see the statistics on the table level by clicking the object in the report. Figure D-11 shows the details for the WebRequestHeaders_Disk table in the system. The first output illustrates access method-related statistics. The demo application does not read the data from the table, which affects the numbers you see in the Figure.

Figure D-11. Table-Level Statistics
The second output shows lock- and latch-related statistics for the table. The table suffers from a large amount of page latches, as you saw in Chapter 2.
Finally, the third output illustrates the number of migration blockers and issues that need to be addressed before migration.
Similarly, the Procedure Usage Analysis report shows stored procedure usage based on CPU time consumed. Figure D-12 illustrates the output of the report. The demo application called just the single procedure, which is displayed here.

Figure D-12. The Procedure Usage Analysis Report
You can drill down to the procedure-level statistics, which displays the execution count, execution time metrics, and tables that are referenced by the stored procedure. Figure D-13 illustrates this page.

Figure D-13. Procedure-Level Statistics
Management Data Warehouse is a great tool that can help you identify objects that will benefit from migration. However, you should not rely solely on its results. Look and analyze the entire system before making any decisions.
Finally, it is worth mentioning that, as with any tool, the quality of output greatly depends on the quality of input. You need to collect a representative workload from a production server to get accurate results.
Memory Optimization and Native Compilation Advisors
In addition to Management Data Warehouse, SQL Server 2014 includes two other tools that can help with In-Memory OLTP migration. The Memory Optimization and Native Compilation Advisors analyze database tables and stored procedures to identify unsupported constructs. Moreover, the Memory Optimization Advisor can perform the actual migration, creating an In-Memory OLTP filegroup and memory-optimized table, and move data from the on-disk table there.
You can access both advisors from the object context menu in SSMS. Figure D-14 shows table context menu with the Memory Optimization Advisor menu item highlighted.

Figure D-14. The Memory Optimization Advisor menu
As the first step, the wizard analyzes the table and displays constructs that are unsupported by In-Memory OLTP. Figure D-15 shows the output of the validation on the WebRequestHeaders_Disk table. As mentioned, I added several LOB columns and a trigger to the table, which were reported by the advisor.

Figure D-15. The Memory Optimization Advisor validation results
If the table does not use any unsupported constructs, the advisor proceeds with the option of creating an In-Memory OLTP filegroup and performing actual table migration.
The simplicity of the wizard, however, is a two-edged sword. It can simplify the migration process and, in some cases, allow the enabling of In-Memory OLTP and moving data into memory with a few mouse clicks. However, as you already know, In-Memory OLTP deployments require careful hardware and infrastructure planning, redesigning of indexing strategies, changes in database maintenance and monitoring, and quite a few other steps to be successful. Improperly done migration can lead to suboptimal results, and the simplicity of the advisor increases that chance.
The advisor is a very useful tool for identifying migration roadblocks. You should be very careful, however, to rely on it performing the actual migration process.
As the opposite of the Memory Optimization Advisor, the Native Compilation Advisor does not create a natively compiled version of the stored procedures. It just analyzes whether stored procedures have unsupported constructs that prevent native compilation.
Figure D-16 illustrates the output of the Native Compilation Advisor for the InsertRequestInfo_Disk stored procedure defined in Chapter 2.

Figure D-16. Native Compilation Advisor output
In-Memory OLTP migration tools can help you identify targets for migration and help during the process. However, it is best to take their advice with a grain of salt and not explicitly rely on their output. After all, you know your system better than any automatic tool does.
Summary
SQL Server 2014 provides several tools that can help with In-Memory OLTP migration. Management Data Warehouse allows you to collect transaction performance metrics and identify the possible targets for migration. The Memory Optimization and Native Compilation Advisors analyze tables and stored procedures to identify the constructs unsupported by In-Memory OLTP.
Those tools are beneficial and can save you a good amount of time during the migration process. However, you should not rely strictly on their output when you perform the analysis. You need to analyze the entire system, including infrastructure and hardware, indexing strategies, database maintenance routines, and other factors to achieve the best results with In-Memory OLTP.