
You are now approaching the end of your journey into the world of self-service business intelligence with Power BI. Up until now in this book, you have seen how to use Power BI Desktop to prepare and visualize your data. Now, all that remains is to learn how to share your insights with your colleagues. This is where PowerBI.com comes into the frame.
PowerBI.com is a cloud-based online service from Microsoft that lets you…
- Share your Power BI Desktop BI files in the cloud. This will allow your co-workers to view and interact in real time with Power BI Desktop reports in a browser window.
- Create new reports in the cloud using the data from Power BI Desktop files that you have already loaded into PowerBI.com.
- Configure any Power BI Desktop files that you have loaded into PowerBI.com so that they connect to on-premises data and so they refresh the data that they contain from onsite data sources at regular intervals. This way you can be sure that your colleagues are always using the most recent available data.
- Use the new Power BI app for mobile devices to view and interact with Power BI Desktop reports on tablets and mobile phones.
However, the truly amazing thing about PowerBI.com is that it is absolutely free (for up to 1GB of data). If this threshold is too low (and to access many other possibilities, especially where group collaboration are concerned) you can upgrade to the PowerBI.com Enterprise service and raise the limit to 10GB of data (as well as obtaining other advantages) for '9.99 per month. At least these were the prices when this book went to press.
I have to add that PowerBI.com is a vast product in its own right, and worthy of a book in itself. So I have to warn you that in this chapter, you are only taking a quick look at some of its features; you will not examine everything that this service can do in detail.
Publishing Reports to PowerBI.com
The best way to appreciate PowerBI.com is to see it in action. The following sections explain how to create a PowerBI.com account and upload a report created with Power BI Desktop.
Creating a Power BI Account
Before you can use PowerBI.com, you need to create a Power BI account, as follows:
- 1.In your browser, navigate to https://powerbi.microsoft.com . You should see a web page like the one shown in Figure 23-1.
 Figure 23-1.The PowerBI.com connection page
 - 2.Click Start Free. You will see the How to Get Started page, as shown in Figure 23-2.
 Figure 23-2.The How to Get Started page
 - 3.Click Try Free. You will see the Sign Up page.
- 4.Enter your work e-mail address. The page will look like the one displayed in Figure 23-3.
 Figure 23-3.The PowerBI.com Get Started dialog
 - 5.Click the arrow. PowerBI.com will send you an e-mail confirming the creation of your account.
- 6.Go to your e-mail and open the mail from Power BI. Type or paste the verification code into the Create Your Account dialog, which should look like what’s shown in Figure 23-4.
 Figure 23-4.Entering the e-mail verification code from PowerBI.com
 - 7.Click Start. You will be connected to the PowerBI.com service and see a web page like the one in Figure 23-5.
 Figure 23-5.The PowerBI.com web page
That is all that you have to do. You now have a PowerBI.com account and can start sharing your insights with colleagues and friends.
Using Power BI Desktop Files in PowerBI.com
It is all very well and good if you actually have a PowerBI.com account, but what is it and what can you use it for? PowerBI.com is essentially a collaboration environment optimized for self-service business intelligence. Given the whole self-service ethos that underlies Power BI, the easiest way to understand self-service BI is to see the steps in the life cycle of a Power BI Desktop file. This will show the process, from initial load, through sharing and interaction, to deletion. Hopefully, this will give you an idea of why Power BI is so different, so visual, and so tremendously useful in practice.
Logging On to PowerBI.com
- 1.Enter the PowerBI.com URL in your browser to connect to the PowerBI.com start page that you saw in Figure 23-1.
- 2.Click Sign In. The Microsoft sign-in page will appear, as shown in Figure 23-6.
 Figure 23-6.The Microsoft sign-in page
 - 3.Click the account that you created previously. You see the PowerBI.com welcome page, as shown in Figure 23-7.
 Figure 23-7.The PowerBI.com My Workspace page
You are now logged into PowerBI.com and ready to upload files created with Power BI Desktop.
Adding a Power BI Desktop File
As an (admittedly very simple) example, let’s add a sample Power BI Desktop file directly to PowerBI.com:
- 1.In the Files section, click Get. You will switch to the Import or Connect to Data page that you can see in Figure 23-8.
 Figure 23-8.The Power BI Import or Connect to Data page
 - 2.Click Local File. The Open dialog will be displayed.
- 3.Navigate to the Power BI Desktop file that you want to add to PowerBI.com. I used the C:PowerBiDesktopSamplesCH23FirstDashboard.pbix file from the sample data files that are available for download in this example.
- 4.Click OK. The file is added to PowerBI.com and appears in the Reports, and Datasets sections of the My Workspace section.
- 5.Expand the My Workspace section.
- 6.In the Reports section, click the FirstDashboard report. You will see the report contents exactly as they were created in Power BI Desktop. You can see this in Figure 23-9.
 Figure 23-9.PowerBI.com with a Power BI Desktop file added
Publishing a Power BI Desktop File
Another way to add a Power BI Desktop file to PowerBI.com is from inside Power BI Desktop itself. This is unbelievably simple:
- 1.Open the Power BI Desktop file that you want to upload. I suggest using the sample file C:PowerBiDesktopSamplesCH23DatabaseCarSales.pbix.
- 2.In the Home ribbon, click the Publish button. Power BI Desktop will display a dialog while the file is uploaded (and ask for confirmation if this file is replacing an existing version). You can see this in Figure 23-10. Once published, the success dialog will be displayed, as shown in Figure 23-11.
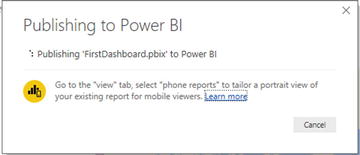 Figure 23-10.The Publishing to Power BI dialog
 Figure 23-11.The report successfully published dialog
 - 3.Click Got It.
You can now connect to your PowerBI.com account and see the report and dataset that you just loaded.
Dashboards, Reports, and Datasets
Adding a Power BI Desktop file to PowerBI.com has, in fact, added three separate elements:
- The report itself, which you can see in Figure 24-9.
- An element added to a new dashboard (you will learn more about this in a few pages’ time).
- The dataset that drives the report.
All three elements are visible in the My Workspace section on the left of the PowerBI.com page.
Interacting with a Report on PowerBI.com
Now that you have uploaded a report to PowerBI.com, it is worth asking what you can do with reports now that you are no longer in Power BI Desktop. The answer is quite simple: you can do nearly everything that you can do in Power BI Desktop. Specifically, you can do the following:
- Filter data in the filter pane on the right of the PowerBI.com report, just as you would if using Power BI Desktop. Note that you cannot add further filters, but that any existing report, page, or visualization filters are accessible, and you can switch between basic filtering and advanced filtering just as you can in Power BI Desktop.
- Highlight data by clicking chart elements, for instance (again, just as you can in Power BI Desktop).
- Switch between pages using the tabs at the bottom of the report.
- Zoom in to a specific visual by clicking the Focus icon in the top-right corner of a visual (yes, once again, just as you can in Power BI Desktop).
- Sort data in a visual in the same way that you can in Power BI Desktop.
- Pan and zoom in map visuals.
- Use any custom visuals that you have downloaded from the PowerBI.com site.
I imagine that by now you understand that the reports that you have loaded from Power BI Desktop are virtually identical to the originals. The only major difference is that you cannot extend an existing report by adding new data or visuals. Indeed, if you have read the chapters explaining how to filter, sort, and highlight data, then you will find that PowerBI.com uses almost exactly the same techniques as Power BI Desktop, so you do not need any further explanation to help you on your way to interacting with your Power BI reports in the cloud.
Printing PowerBI.com Reports
Although PowerBI.com is built for sharing information interactively using the Web, it will let you print reports directly from a PowerBI.com site. To print a report, you simply do the following:
- 1.In the Report menu, click File. The File menu will appear.
- 2.Select Print. The Print Options dialog of your PC or tablet will appear, enabling you to select a printer and print the report.
Working with PowerBI.com Reports
PowerBI.com is not designed to be a replacement for Power BI Desktop. The capabilities that it offers as far as report modification are concerned are considerably more limited than those of the tool that you have learned to use in this book. Nonetheless, PowerBI.com does let you tweak existing reports to a certain extent. As most—if not all—of the report editing functions that are available also exist in the desktop version, I will only provide a cursory overview in this section.
The PowerBI.com Report Menu
The first thing that you need to know is that report modification is not carried out using ribbons, as is the case with Power BI Desktop. To make changes, you need to use the report menu, which is found above the report. You can see this in Figure 23-12.
Figure 23-12.
The PowerBI.com report menu
Report Editing
To modify a report (other than filtering the report or interacting with the visuals), you need to switch to Edit mode. To do this simply click the Edit Report menu button. A set of secondary menu items will appear. You can see these in Figure 23-13. These elements are explained in Table 23-1.
Figure 23-13.
Edit Report menu items
Table 23-1.
Edit Report Menu Options
Option | Description |
|---|---|
Explore | Lets you drill up, down, and through the data in visuals. You can also see the data behind a visual. |
Text Box | Adds a text box that you can then format exactly as described in the previous chapter. |
Shapes | Adds shape objects to the report. |
Visual Interactions | Allows you to specify how visuals interact when elements are selected. |
Refresh | Refreshes the visuals from the source data. |
Duplicate This Page | Creates a copy of the current page in the report. |
Save | Saves your modifications to the cloud-based report. |
In Edit mode you can add new visuals exactly as you can in Power BI Desktop. However, you are limited to using the data that is already in the report.
Another, final couple of options
that you might find useful are in the File menu:
- Save the report as a Power BI Desktop file.
- Export the report as a PowerPoint file.
Exiting Edit Mode
Once you have finished your additions and modifications for a report, simply click the Reading view menu item. This will return the report to interactive mode.
Adding Datasets to PowerBI.com
Nearly this entire book has been devoted to explaining how you can create powerful, interactive, analytical reports using Power BI Desktop. Moreover, as I mentioned at the start of this chapter, PowerBI.com then comes into the frame to let you share your reports. However, a large part of the knowledge that you have acquired so far in this book can also be used directly in PowerBI.com to create reports directly in the cloud.
Reports that you create in PowerBI.com need data, so the first thing that you must do, before starting to create a report, is to obtain some data upon which you can base the report. Currently only two data sources (apart from Power BI Desktop files) can be used:
- Excel files (.xlsx and .xlsm)
- Text (.CSV) files
A couple of comments are necessary here:
- Any Excel file that you load must contain named tables, or the Excel file will not load. Remember that creating a table from a set of rows and column is as easy as clicking Insert ➤ Table in Excel and then, eventually, renaming the table.
- Any CSV file must be a correctly structured comma-separated file, as described in Chapter 2.
To see this in action:
- 1.Click Get Data at the bottom left of the PowerBI.com page.
- 2.Click Get ➤ Local File and select the file C:PowerBiDesktopSamplesCH23CarSales.xlsx. You will see the page shown in Figure 23-14.
 Figure 23-14.Loading data into PowerBI.com
 - 3.Click Import. After a few seconds the data will be loaded and you will see the page shown in Figure 23-15.
 Figure 23-15.
 - 4.Click View Dataset. PowerBI.com will display a blank report based on this dataset .
You can now build a PowerBI.com report using this data.
Note
Clearly, you are extremely limited as to the data sources that you can use when creating reports from scratch in PowerBI.com. This leads inescapably to the conclusion that it is really Power BI Desktop that you should be using to create reports. Not only is the user experience immensely more gratifying, but the range of available data sources is vast.
Creating New Reports in PowerBI.com
Clearly, Power BI Desktop is the preferred solution when it comes to creating Power BI reports. Should you need to, however, you can also use existing cloud-based data or Excel, Power BI Desktop, or CSV files as data sources to create new reports. As a simple example, the following explains how to use the data in the Power BI Desktop file that you loaded earlier in this chapter to create a new report:
- 1.In the My Workspace tab, click the create report icon. A new, blank report canvas very similar to those that you have been using in Power BI Desktop will be displayed. You can see this in Figure 23-16.
 Figure 23-16.The new report canvas
 - 2.Build your report just as you would in Power BI Desktop! This includes creating any of the visualizations that you explored in earlier chapters. You can format the visuals just as you would in Power BI Desktop, as well as add filters and shapes and define visual interactions much as you saw previously in this book.
Well, I did warn you that it was almost identical to what you have learned so far. However, it is probably worth outlining the essential differences between creating reports directly in PowerBI.com and developing reports in Power BI Desktop:
- Data: This is currently limited to Excel, Power BI Desktop, or CSV files, or data that is accessible from a cloud-based source such as
- Azure SQL database
- Azure SQL Data Warehouse
- SQL Server Analysis Services
- Calculated columns and measures: It is not currently possible to extend the dataset with calculated columns and measures. So you will have to ensure that all the metrics that you need are in the source data.
- Custom visuals: You can import any of the custom visuals that are available on the Power BI site, just as you can when using Power BI Desktop.
There are a few other minor differences, but the preceding are the key points that you need to remember if you are tempted to create reports in PowerBI.com.
One final thing that you need to know is how to save the report that you have made. In reality, you create a new report by saving the canvas in the dataset:
- 1.At the top right of the Datasets page, click Save.
- 2.Enter a name for the report. I chose PowerBIReport for this example. The save dialog will look like the one in Figure 23-17.
 Figure 23-17.The Save Your Report dialog
 - 3.Click Save. The report will be displayed in the Workspace pane in the Reports tab.
PowerBI.com Dashboards
In PowerBI.com, the term dashboard has a slightly different meaning from the one that we have been using so far in this book. In PowerBI.com, a dashboard is a central point of focus where you can do this:
- Add visuals from any report that you have loaded into PowerBI.com. These visuals are called tiles.
- Jump straight from a dashboard to the report hosting a visual in a dashboard.
- Enhance dashboards with specific annotations.
Let’s look at how this works by taking the dashboard that was created when you loaded the FirstDashboard report and adding a visual to it from this same report.
Adding Tiles to PowerBI.com Dashboards
Now that you have a dashboard ready and waiting, the following explains how to add some content from an existing report:
- 1.In the Navigation pane, click the report that you have already loaded. This will be FirstDashboard, assuming that you followed the earlier example. The report will appear, as shown in Figure 23-9.
- 2.Hover the mouse pointer over the chart (with the title DeliveryCharge by Model) on the top left of the report. Three small icons will appear at the top right of the chart.
- 3.Click the Pin icon. This will display the Pin to Dashboard dialog that you can see in Figure 23-18.
 Figure 23-18.The Pin to Dashboard dialog
 - 4.Ensure that the Existing Dashboard radio button is selected and that the Car Sales dashboard is selected in the popup list of available dashboards.
- 5.Click Pin.
The chart is added to the Car Sales dashboard. If you click the name of this dashboard in the Navigation pane, you will see that the dashboard looks like Figure 23-19.
Figure 23-19.
A dashboard with a visual added
If you click the chart in the dashboard, you immediately jump to the source report and page for this visual.
Note
You can also create a new dashboard when you pin a visual by selecting New Dashboard as the destination in the Pin to Dashboard dialog.
Pinning Entire Reports
If you need a dashboard tile that is, in reality, an entire report, then you can choose to pin an entire report:
- 1.Expand My Workspace, expand the Reports section, and click the report that you wish to pin to a dashboard.
- 2.Click Pin Live Page on the Report menu. The Pin to Dashboard dialog will appear, as shown in Figure 23-20.
 Figure 23-20.The Pin to Dashboard dialog
 - 3.Click Pin Live. The Pinned to Dashboard alert appears at the top right to inform you that the report has been pinned. You can see this in Figure 23-21.
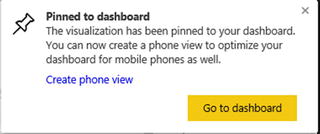 Figure 23-21.The Pinned to Dashboard alert
 - 4.Click Go to Dashboard to view the dashboard with the report. You can see the result of this approach in Figure 23-22.
 Figure 23-22.A dashboard with a report pinned to it
Note
Pinning an entire report means that any changes made to the report will update the dashboard in real time.
Editing Dashboard Tiles
There are a few interesting things that you can do to tiles once you have added them to dashboards. The available options include
- Deleting tiles
- Modifying tile details
- Exporting the data behind the tile
- Pinning the tile to another dashboard
Let’s look at each of these in turn.
Deleting Tiles
The following explains how to delete a tile from a dashboard (while leaving the source visual intact on the original report):
- 1.Click the tile menu icon (the ellipses at the top right of the tile). The tile options will appear, overlaying the tile data, as you can see in Figure 23-23.
 Figure 23-23.The tile menu
 - 2.Click the waste bin icon on the right. The tile will be removed from the dashboard.
Note
If you delete a tile by mistake, you cannot undo the action. However, since the original visual is still in the source report, you can add it back easily enough.
Modifying Tile Details
There are a few details that you can modify when adding tiles to dashboards:
- 1.Click the tile menu icon (the ellipses at the top right) to display the tile menu options.
- 2.Click the pencil icon. The Tile Details pane will appear on the right of the screen, looking rather like the one in Figure 23-24.
 Figure 23-24.The Tile Details pane
The available options are largely self-explanatory, so I will not take you through all the possibilities, but simply explain what can be done to tweak a tile in a dashboard.
- Title and Subtitle: If you edit the elements in these fields, you can change the title and subtitle that were inherited from the source visualization.
- Display last refresh time: Checking this option adds the latest refresh date and time to the tile title.
- Set custom link: Adding an URL to this field defines a hyperlink to a completely different web page (rather than the original report containing the source visual) when you click the tile in PowerBI.com.
Exporting the Data Behind the Tile
You can export the data that a visual is based on at any time. It is exported as a CSV file to your Downloads folder. To do this, you need to do the following:
- 1.Click the tile menu icon to display the tile menu options.
- 2.Click the page icon. The data export toolbar will appear at the bottom of the web page. You can see this in Figure 23-25.
 Figure 23-25.The data export toolbar
 - 3.Export the data as you would when downloading data from just about any web page.
Note
PowerBI.com does not export the entire dataset that a report is based on. It only exports the subset of data that is used in a visualization.
Pinning the Tile to Another Dashboard
Just as you pinned a visual to a dashboard, you can extend the process by pinning a tile to another dashboard.
- 1.Click the tile menu icon to display the tile menu options.
- 2.Click the Pin icon. This will display the Pin to Dashboard dialog that you saw previously in Figure 23-18.
- 3.Select a new or existing dashboard and click Pin. The tile will be added to the selected dashboard.
Modifying Dashboards
Apart from adding tiles, there other things that you can do with dashboards:
- Resize tiles
- Add other tiles (which can be images, text boxes, or other web content)
- Display dashboards in full screen mode
- Print dashboards
Let’s take a quick look at each of these in turn.
Resizing Tiles
As you might expect, tiles can be resized (and moved) on dashboards. All you have to do to move a tile is to click inside the tile and drag it elsewhere on the dashboard pane. To resize a tile, you click the bottom-right corner of the tile and drag the mouse up and left (to shrink the tile) or down and right (to enlarge a tile).
Adding Other Tiles (Images, Text Boxes, Video, or Other Web Content)
Dashboards are not limited to displaying only visuals from existing reports. To enhance your message, you can add other web content or existing images. You can even add text boxes to make a specific point. Adding tiles is this simple:
- 1.At the top right of the PowerBI.com screen, click Add Tile. The Add Tile dialog will appear, as you can see in Figure 23-26.
 Figure 23-26.Dashboard tiles
 - 2.Select one of the available tile options. The appropriate Tile Details pane will appear at the right of the web page, where you can enter any necessary information.
The currently available options for tiles are outlined in Table 23-2.
Table 23-2.
PowerBI.com Tile Types
Tile Type | Description |
|---|---|
Image | Allows you to set a URL for the image that you want to display. You cannot add images from a local disk. |
Video | Allows you to set a URL for the YouTube video that you want to display. Only YouTube videos can be added to PowerBI.com dashboards as of the time of writing. |
Web Content | Displays the Tile Details pane, where you can add any code that you want to embed in the dashboard page. |
Text Box | Displays the Text Box pane, where you can enter and format the text that you want to display in a dashboard. |
Real-Time Data | Lets you add streaming datasets to your PowerBI.com dashboard. |
Note
If you have begun to add a tile and want to abandon it before you have finished, then simply click the close icon at the top right of the Tile Details pane.
Displaying Dashboards in Full Screen Mode
If you are using PowerBI.com as a presentation tool, or if you simply want to see the contents of a dashboard without any of the other panes or menus, you can always display the dashboard in full screen mode. It’s a single step:
- Click the Enter Full Screen Mode icon (the diagonal two-headed arrow) in the PowerBI.com title bar. The dashboard will appear in full screen mode, as shown in Figure 23-27.
 Figure 23-27.Displaying a dashboard in full screen mode
To exit full screen mode, simply press Escape or click the Exit Now button in the toolbar at the bottom of the web page.
Printing Dashboards
Although PowerBI.com is built for sharing and interactivity on the Web, it also lets you make paper copies of your dashboards. The following explains how to print a dashboard:
- 1.Click the More Options button (the ellipses at the top right of the web page). The options menu will appear as shown in Figure 23-28.
 Figure 23-28.The More Options menu
 - 2.Click Print Dashboard. The Print Options dialog of your PC or tablet will appear, from where you can select a printer and print the dashboard.
PowerBI Pro
Power BI Pro
is the Enterprise version of the free PowerBI.com offering. It has a cost (currently '9.99 per user per month) and has considerably greater capacities when it comes to sharing content and integrating with Power BI Premium—Microsoft’s Enterprise BI offering.
As the commercial landscape for Power BI is subject to frequent change, I suggest that you look at the Microsoft web site for the latest details.
Sharing Dashboards
Creating insightful dashboards may be fun, but it is a truly meaningful activity only if the information can be shared with colleagues. Perhaps inevitably, PowerBI.com not only allows your co-workers to share your insights, but also actively helps you to disseminate the information. Here’s an example:
- 1.Click the Share icon at the top right of the dashboard. The Share Dashboard page will be displayed.
- 2.Enter in the upper field the e-mail addresses of the people who you want to share your dashboard with.
- 3.Add a message for the recipients in the lower field. The web page will look something like Figure 23-29.
 Figure 23-29.Sharing dashboards
 - 4.Click Share.
Your colleagues will receive an e-mail containing the link to the dashboard that you have shared. Clicking this link will display the dashboard.
If you do not want to send an e-mail with a link, you can click the Shared With tab in the Share Dashboard page, and simply copy and paste the link into a file or a Microsoft Lync message (for instance) and enable your co-workers to access your dashboard in this way.
In any case, the recipient with whom you are sharing the dashboard needs a PowerBI.com account.
PowerBI.com Gateways
The ability to share your analyses on a platform as powerful as PowerBI.com needs only one more thing to make it an essential business tool. All that is missing is the ability to ensure that the data that you are sharing is up to date. Fortunately, the Power BI team has thought of this, too. Their solution is to let you create gateways from your on-premises data to the PowerBI.com site. These gateways allow you to refresh the data in your Power BI Desktop files from the data sources on which they are built. Not only that, but you can refresh the data manually or automatically on a schedule that you define.
Currently, there are two kinds of Power BI gateways:
- Personal
- Enterprise
The essential differences are that the Enterprise gateway is designed for multiple users, and consequently has fine-grained access control, monitoring, and auditing. As an added bonus, it allows for DirectQuery connections (which you saw in Chapter 2) to SQL Server.
PowerBI.com gateways are a large subject. Consequently, I will only give a brief introduction to the personal gateway here. However, once you understand how PowerBI.com gateways work, you should have no difficulties in extending their use to suit your specific requirements.
Downloading a Gateway
A PowerBI.com gateway has to be installed on a local computer first. This is as easy as downloading the gateway application and then carrying out basic configuration:
- 1.In PowerBI.com, click the downloads icon at the top right of the page, as seen in Figure 23-30.
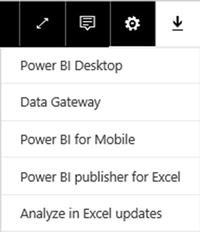 Figure 23-30.The downloads icon and menu
 - 2.Click Data Gateway. A new browser tab will open, displaying the Power BI Gateway splash screen. This is shown in Figure 23-31.
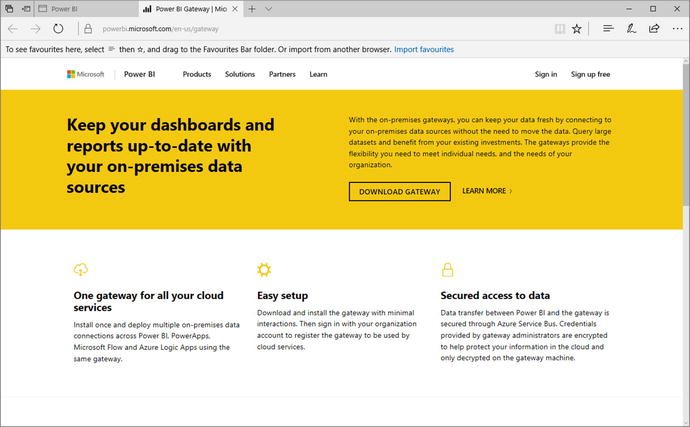 Figure 23-31.
 - 3.Click Download Gateway. After a short time the web browser will display the PowerBIGatewayInstaller.exe button at the bottom of the screen.
- 4.Click the PowerBIGatewayInstaller.exe button. The On-premises Data Gateway Installer dialog will appear. You can see this in Figure 23-32.
 Figure 23-32.The On-premises Data Gateway Installer dialog
 - 5.Click Next, then choose the gateway that you wish to install (the recommended on-premises data gateway in this example). The dialog will look like the one shown in Figure 23-33.
 Figure 23-33.The On-Premises Gateway installer dialog
 - 6.Click Next. The gateway installation will start, and the gateway installer will display the installation progress, as you can see in Figure 23-34.
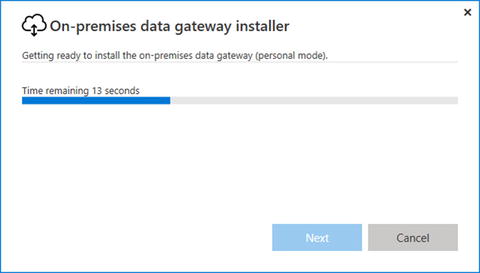 Figure 23-34.Installation progress of the gateway
 - 7.Accept the terms of use and click Install, and choose the installation folder (or accept the default). You can see this in Figure 23-35.
 Figure 23-35.Gateway location
 - 8.Click Install. Once the installation process has finished, you will see the gateway installation sign-in dialog, like the one in Figure 23-36. Enter the e-mail address of the account that you will be using.
 Figure 23-36.Gateway successfully installed dialog
 - 9.Click the Sign In button.
- 10.Enter your password and confirm. You will see the dialog for entering the gateway name and recovery key.
- 11.Enter a gateway name and a recovery key, as shown in Figure 23-37.
 Figure 23-37.The gateway name and recovery key dialog
 - 12.Click Configure. Once you are connected to your PowerBI.com account, you will see a dialog confirming a successful connection. You can see this in Figure 23-38.
 Figure 23-38.Gateway online dialog
 - 13.Click Close.
Note
PowerBI.com Gateway is an app on your PC. So you can always find it (depending on your version of Windows) among the installed applications on your computer.
Configuring Data Sources
Once a gateway is installed, you will need to configure it to access on-premises data sources.
You can see this in Figure 23-39.
Figure 23-39.
Configuring a data source
Once you have configured the data source, you must add users, as you can see in Figure 23-40.
Figure 23-40.
Adding users for a data source
Applying Dataset Settings
Finally, you need to apply dataset settings for individual datasets:
- 1.On the left of the PowerBI.com web page, expand My Workspace, and then expand the Datasets section.
- 2.Click the menu (the ellipses) for an existing dataset.
- 3.Select Dataset Settings from the popup menu.
- 4.Select the dataset that you loaded earlier (FirstDashboard).
- 5.Expand Data Source Credentials on the main page, and click Edit Credentials. The Configure dialog for this dataset will appear, as shown in Figure 23-41.
 Figure 23-41.The Configure dialog for a dataset
 - 6.Click the Sign In button. An alert will confirm that the data source connection has been updated.
You can now refresh the data in PowerBI.com from the source data.
Manual Data Refresh
As an example of how to use a gateway that you have installed on your PC, let’s apply a manual refresh to the file that you loaded at the start of this chapter:
- 1.In PowerBI.com, click the options menu (the ellipses) for the dataset that you want to refresh (FirstDashboard in this example). The options menu will be displayed, as shown in Figure 23-42.
 Figure 23-42.The dataset options menu
 - 2.Click Refresh Now.
The dataset will be refreshed with the latest data from the source. This may take a minute or two. Of course, all your visuals will be updated to reflect any changes in the source data.
Note
Alternatively, you can carry out ad hoc data refresh by clicking the Refresh button in the menu that appears above each report that you select in PowerBI.com.
Scheduled Data Refresh
Once a gateway is correctly installed and configured, you can specify which data source(s) you want to refresh according to a schedule, as follows. This enables you to ensure that your data is always up to date.
- 1.In PowerBI.com, click the options menu (the ellipses) for the dataset that you want to refresh (FirstDashboard in this example). The options menu will be displayed.
- 2.Select Schedule Refresh. The Datasets Settings page will be displayed.
- 3.Expand Schedule Refresh.
- 4.Set the “Keep your data up to date” switch to Yes.
- 5.Choose a refresh frequency (daily or weekly).
- 6.Click Apply .
The selected dataset will now be refreshed according to the schedule that you have chosen. If you have downloaded and installed the Enterprise gateway, then you can refresh your data hourly instead of daily.
You can also refresh larger amounts of data.
PowerBI.com on Tablets and Smartphones
Power BI is also available as apps for the following devices:
- IOS tablets and smartphones
- Android tablets and smartphones
- Windows tablets and smartphones
The first step, inevitably, is to load the app on your device. The easiest way is to go to the Apple App store if you have an iPhone or iPad, or Google Play if you are using an Android device. If you have a Windows tablet, you can use the URL:
https://www.microsoft.com/en-gb/store/p/microsoft-power-bi/9nblgggzlxn1?rtc=1
.
Once the app is installed, all you have to do is log in and you can access any Power BI reports, data, and dashboards that you have loaded from Power BI Desktop.
Figure 23-43 shows you the dashboard that you loaded earlier displayed on an iPhone.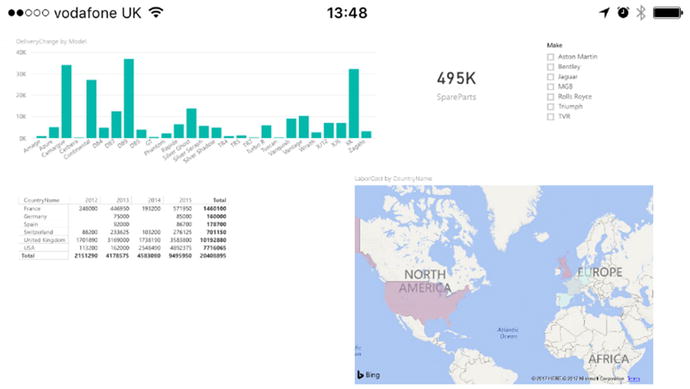
Figure 23-43.
A dashboard on an iPhone
Figure 23-44 shows you the same dashboard on a Windows tablet in the Power BI App.
Figure 23-44.
A dashboard on a Windows tablet
Conclusion
Over the course of this book, you have seen how to develop the data discovery, modeling, and visualization capabilities of Power BI Desktop. As the culmination of your journey into self-service BI, this chapter has shown you the new ways you can share discoveries and collaborate from anywhere using PowerBI.com. This has included adding files to a PowerBI.com, managing the connection to on-premises source data, configuring automated data updates, and allowing controlled access to corporate data if you are using the Enterprise gateway.
Once you master and implement these techniques and technologies, PowerBI.com could really become a dynamic online hub for insight and collaboration, data reuse, and interaction among your colleagues. I sincerely hope that you will have fun using Power BI and develop some awesome uses for this amazing technology.