In Chapter 2, you looked at the /sys filesystem in Linux and wrote a simple app to extract information from it. In this chapter, you are going to take a look at another system directory called /proc. The /procdirectory is also known as procfs, and it contains useful information about processes that are currently running. The kernel uses it as an information center for all related processes.
In this chapter, you will learn how to do the following:
Look at the different information available inside procfs
Write an application to read procfs
Use an open source library to interface with procfs
In this section, you will look at procfs and see what it contains. Use the following command in your terminal to view what is available inside the /proc directory:
The output contains a lot of numerical directories. These directories correspond to the process id of applications running in the system, and inside these directories is more detailed information about the corresponding process, such as the command used to run the process, memory maps to executables and library files, and more.
Let’s take a look at one of the processes that is running on my system. I picked the process id that is allocated for the Goland IDE. In this case, the process id is 4280. Table 3-1 shows the information from inside /proc/4280.
As you can see from the table, there is much information that can be extracted that is relevant to the process id 4280. This information gives us better visibility about the application, resources the application uses, user and group information, and more.
Reading Memory Information
In the previous section, you learned what procfs is all about and looked at some of the process information that can be viewed. You looked at extracting the information by going into the /proc directory and using standard tools like ls and cat to view file and directory content.
In this section, you are going to write a simple application to read system memory information from procfs. The sample code can be found inside the chapter3/readingmemory directory. Run the application using the following command:
The application continuously prints memory information (total memory, free memory, and used memory) in kilobytes of the local device. Let’s look at the code to understand how it works.
On startup, the code initializes the Samplerstruct and goes into a loop waiting on the data to be made available from SampleSetChan. Once the data arrives, it prints out the memory information into the console.
The data sampling code that collects the data and sends it to the channel is seen below. The StartSamplingfunction spins off a Go routine that calls GetMemSample to extract the memory information and sleep after sending the data to the SampleSetChan channel.
func (s *sampler) start() *sampler {
...
go func() {
for {
var ss sample
ss.memorySample = getMemorySample()
s.sample <- ss
time.Sleep(s.rate)
}
}()
...
}
The crux of reading the memory information can be seen in the following GetMemSamplefunction:
The memory information is collected from the /proc/meminfo directory. The collected data is parsed and only values that it is interested in are stored, namely total memory, free memory, and calculated value of memory used.
This is how the raw data looks like when reading the /proc/meminfo directory:
MemTotal: 32320240 kB
MemFree: 927132 kB
MemAvailable: 5961720 kB
...
HugePages_Total: 0
HugePages_Free: 0
HugePages_Rsvd: 0
HugePages_Surp: 0
Hugepagesize: 2048 kB
Hugetlb: 0 kB
...
Peeking Network Information
In this section, you will now look at network information that can be extracted out from procfs. There is a directory named /proc/net/sockstat that looks like the following in raw format:
sockets: used 3229
TCP: inuse 49 orphan 0 tw 82 alloc 64 mem 90
UDP: inuse 28 mem 139
UDPLITE: inuse 0
RAW: inuse 0
FRAG: inuse 0 memory 0
Table 3-2 explains the meaning of the different fields shown in the raw information above
Table 3-2.
/proc/net data breakdown
Sockets
Used
Total number of all protocol sockets used
TCP
inuse
Total number of TCP sockets listening
orphan
Total number of TCP sockets that do not belong to any process (a.k.a. orphans)
tw
Total number of TCP sockets that are time waiting or waiting to be closed
alloc
Total number of TCP sockets that have been allocated
mem
Total number of pages allocated to TCP
UDP
inuse
The number of UDP sockets in use
mem
Total number of pages allocated to UDP
UDPLITE
inuse
Total number of Lightweight UDP in use
RAW
inuse
Total number of raw protocols in use
FRAG
inuse
Number of IP segments used
memory
Total amount of memory in KB allocated for fragmentation reassembly
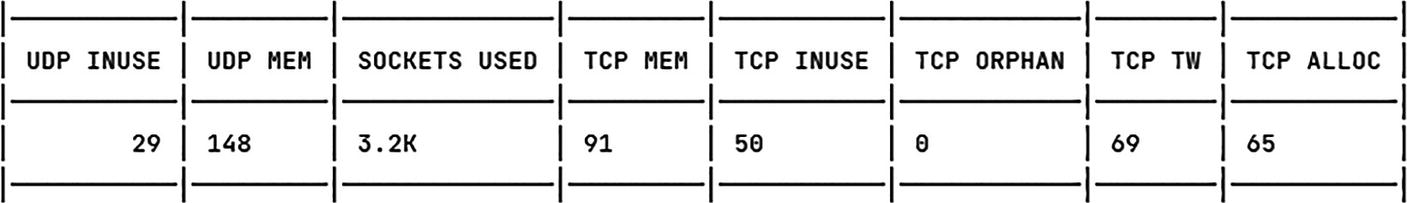
Now that you have a good idea of what the different values mean, let’s take a look at how to extract this information using Go. The sample code is inside the chapter3/sockstat directory. Open terminal and run the code using the following command:
A table explains the output in columns named U D P in use, U D P Nem, sockets, used, Top in use, T C P orphan, T C P T W, and T C P A L L O C.
Figure 3-1
sockstat sample output
Let’s explore the code to understand what it is doing. When the app starts up, it opens the /proc/net/sockstat directory. On success, the code reads and parses it to the format suitable for displaying to the console.
const (
...
netstat = "/proc/net/sockstat"
)
...
func main() {
fs, err := os.Open(netstat)
...
m := make(map[string]int64)
for {
line, err := readLine(reader)
if bytes.HasPrefix(line, []byte(sockets)) ||
bytes.HasPrefix(line, []byte(tcp)) ||
bytes.HasPrefix(line, []byte((udp))) {
idx := bytes.Index(line, []byte((colon)))
...
}
...
}
...
}
As you can see, it is straightforward to write an application to read system-level information from procfs. To write an application to read procfs, the following is the information you will need to know beforehand:
In what directory is the required information located?
Do you need root access to access the information?
How will you parse the raw data properly and handle data parsing issues?
Using the procfs Library
You now understood what kind of information available inside the /proc directory and you’ve also seen how to write code and parse the information. In this section, you are going to take a look at an open source library that provides access to different information available in the /proc directory. The project can be found at https://github.com/jandre/procfs.
Code Sample
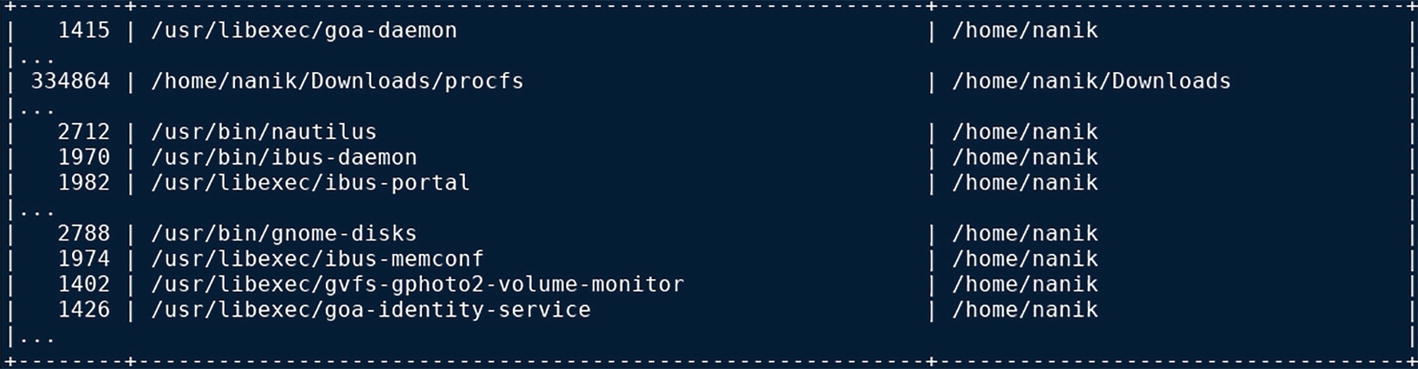
Open your terminal and change to the chapter3/jandreprocfs directory and run the code using the following command:
The sample code is simpler than the previous code that you looked at in the previous sections. It uses the procfs.Processes(..) function call to obtain all the current processes.
Inside the procfs Library
Let’s take a look a bit deeper into the library to investigate what exactly it is doing. You are going to dive into the following procfs.Processes(..)function call. The Processesfunction call inside the library looks like the following:
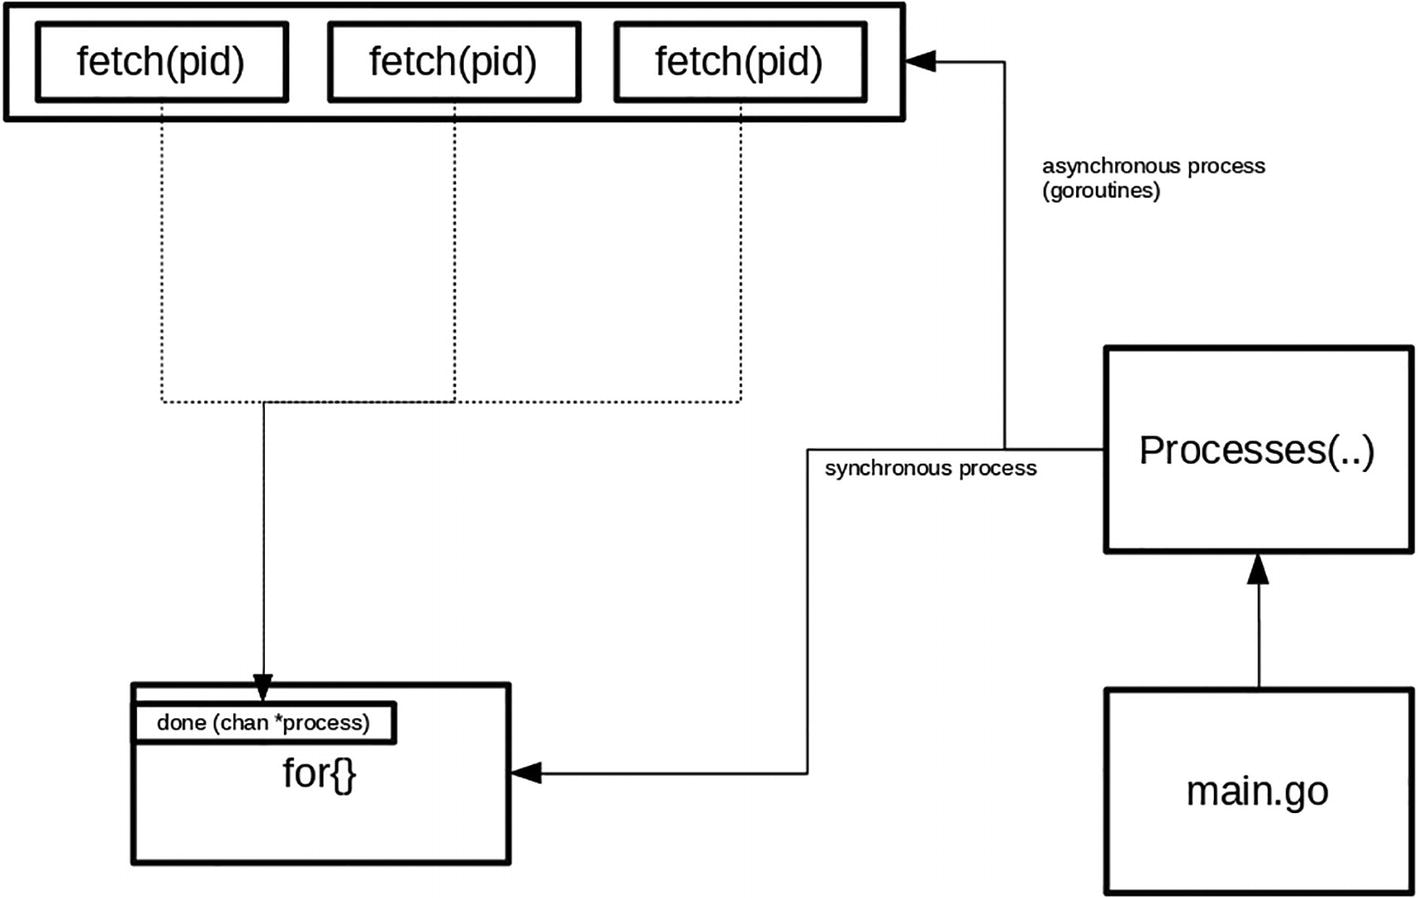
At a high level, Figure 3-3 shows what the function is actually doing.
A flow diagram of the main dot go passes processes function is divided into 3 functions named fetch P I D and connected with the help of synchronous and asynchronous parallel to done processes.
Figure 3-3
Processes(..) function flow
The function reads processes information from the /proc directory, and it traverses through it by reading each process information in a separate Go routine that calls the fetch(pid)function. The function extracts and parses information of the process id that it is assigned. Once collected, it passes into the channel that the Processes(..)function is waiting on; in this case, it is called the done channel.
All the heavy lifting of opening and traversing through the /proc directory including parsing the results is taken care of by the library. The application can just focus on the output that it receives.
Summary
In this chapter, you looked at the /proc file system and learned about the system information that applications have access to. You looked at sample code to read information from inside the /proc directory that is related to the network and memory on the device. You also learned that the bulk of the code that needs to be written when extracting system information is in terms of reading and parsing the information. You also looked at an open source library that can provide functionality in reading the /proc directory that performs all the heavy lifting, leaving you to focus on writing simpler code to read all the system information that you need.