
Before we discuss memory leaks, let’s analyze a simple case study. It will help you understand how memory leaks can hamper the smooth execution of an application over the long run. Suppose you have an online application where users need to fill in some data and then click the submit button. We can assume that during this process, you need to use some resources that consume some blocks of computer memory. Obviously, once the process is completed, developers release the allocated blocks of memory. Now assume that unfortunately the developers of the application mistakenly forgot to deallocate some blocks during the process of execution. Because of this misjudgment, let’s say that the application leaks 512 bytes per click. You probably won’t notice any performance degradation from some initial clicks. But what happens if thousands of online users use the application simultaneously? If 1,000,000 users click the submit button, the application will eventually cause 488 MB of memory loss. You cannot allow this for a long time, because if it goes like this, the application becomes slower and slower, and in the worst case, the application can crash. These are common symptoms caused by memory leaks.
A machine becomes slow over time.
A specific operation in an application takes longer to execute.
The worst case is that an application/system can crash.
In short, even if a program leaks a small amount of data for a common operation, it is quite obvious that you will see some kind of malfunction over time; for example, your device may crash with a System.OutOfMemoryException, or operations in the device may become so slow that you need to restart the application often. It is apparent that “how fast it comes to your attention” depends on the leaking rate of the application.
Managed vs. Unmanaged Memory Leaks
I hope that you read Chapter 12 carefully. There you learned that if you work with C++, you are responsible for the memory deallocations. But in the case of C#, the CLR plays a big role, and most of the time it helps you not to worry about the deallocations.
Still, there are situations when you need to take the responsibility for deallocations. For example, in the case of handling events, you need to be careful: if you register an event, you need to unregister it. This book is about C#, so we’ll discuss managed memory leaks, and to illustrate this, I’ll use events.
I assume that you know how to use events in an application. A detailed discussion of events and delegates is beyond the scope of this book. However, I have added some supportive comments in the code to help you understand it a little better. I acknowledge that it may be easy for you to find the problem in this program. But my core intention is to show you how to analyze the event leaks using the diagnostic tools in Visual Studio. The Diagnostic Tools window can help analyze CPU and memory usage. Here you can view events that show performance-related information.
I discuss delegates, events, and other topics in detail in my other books, Interactive C# and Getting Started with Advanced C#, also published by Apress. The first book shows the usage of the diagnostic tools as well as Microsoft’s CLR Profiler to analyze memory leaks. The second one discusses delegates and events in depth. Also, my recent book Test Your Skills in C# Programming covers these topics. So, if you are interested, you can take a look at those books.
So, since I could not rely on the true parameter, I made it false in that program.
Memory Leak Analysis
Now the question is, how can you detect leaks? Let me tell you that finding a memory leak in an application is a challenging task! There are many tools for this purpose. For example, windbg.exe is a common tool to find memory leaks in a large application. In addition, you can use other graphical tools, such as Microsoft’s CLR Profiler, SciTech’s Memory Profiler, Red Gate’s ANTS Memory Profiler, and so forth to find the leaks in your system. Many organizations have their company-specific memory leak tools to detect and analyze leaks. In my previous organization, our experts developed such a tool. It is a wonderful tool. I was fortunate because I used it for several years and learned many interesting things about catching memory leaks.
Visual Studio users can use a variety of profiling tools for diagnosing different kinds of app performance issues depending on the app type. In the latest editions of Visual Studio, you can see a Diagnostic Tools window. It shows you the profiling tools that are available during a debugging session. You can use it to detect and analyze memory leaks. It is very user-friendly and easy to use. Using this tool, you can take various memory snapshots. Markers in the tool indicate garbage collector activities. These are very useful and effective: you can analyze the data in real time while the debugging session is active. The spikes in the graph can draw your attention immediately. The following program shows you a sample demonstration.
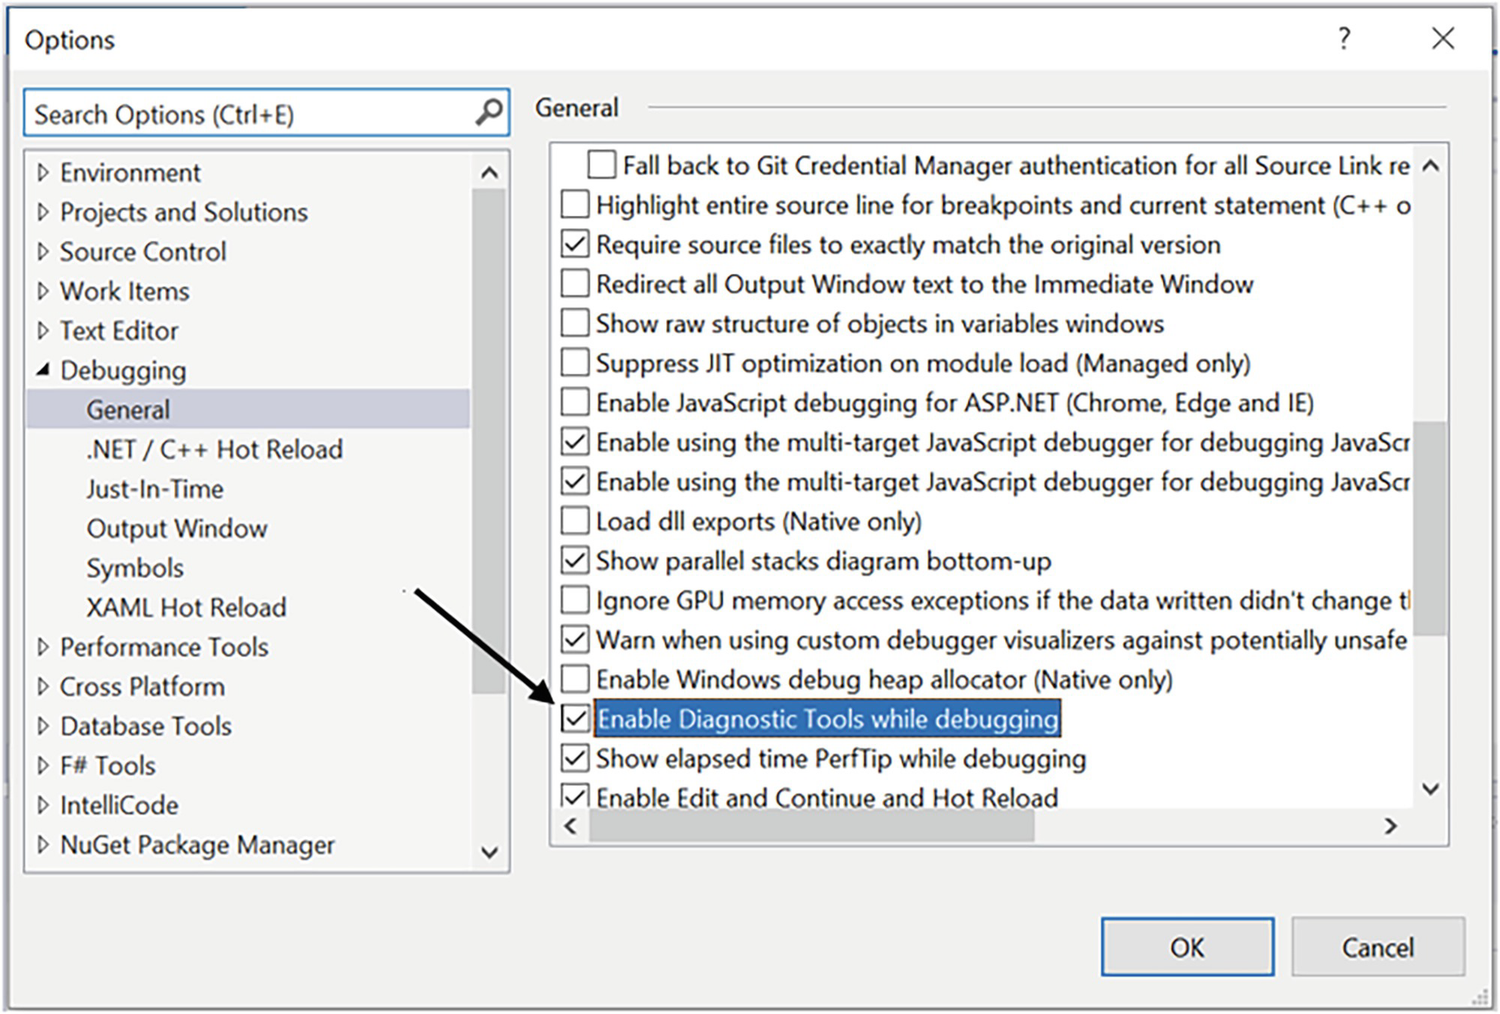
Enabling the “Diagnostic Tools while debugging” option in Visual Studio Community 2022

Checking whether .NET profiling tools are installed in the machine
Demonstration
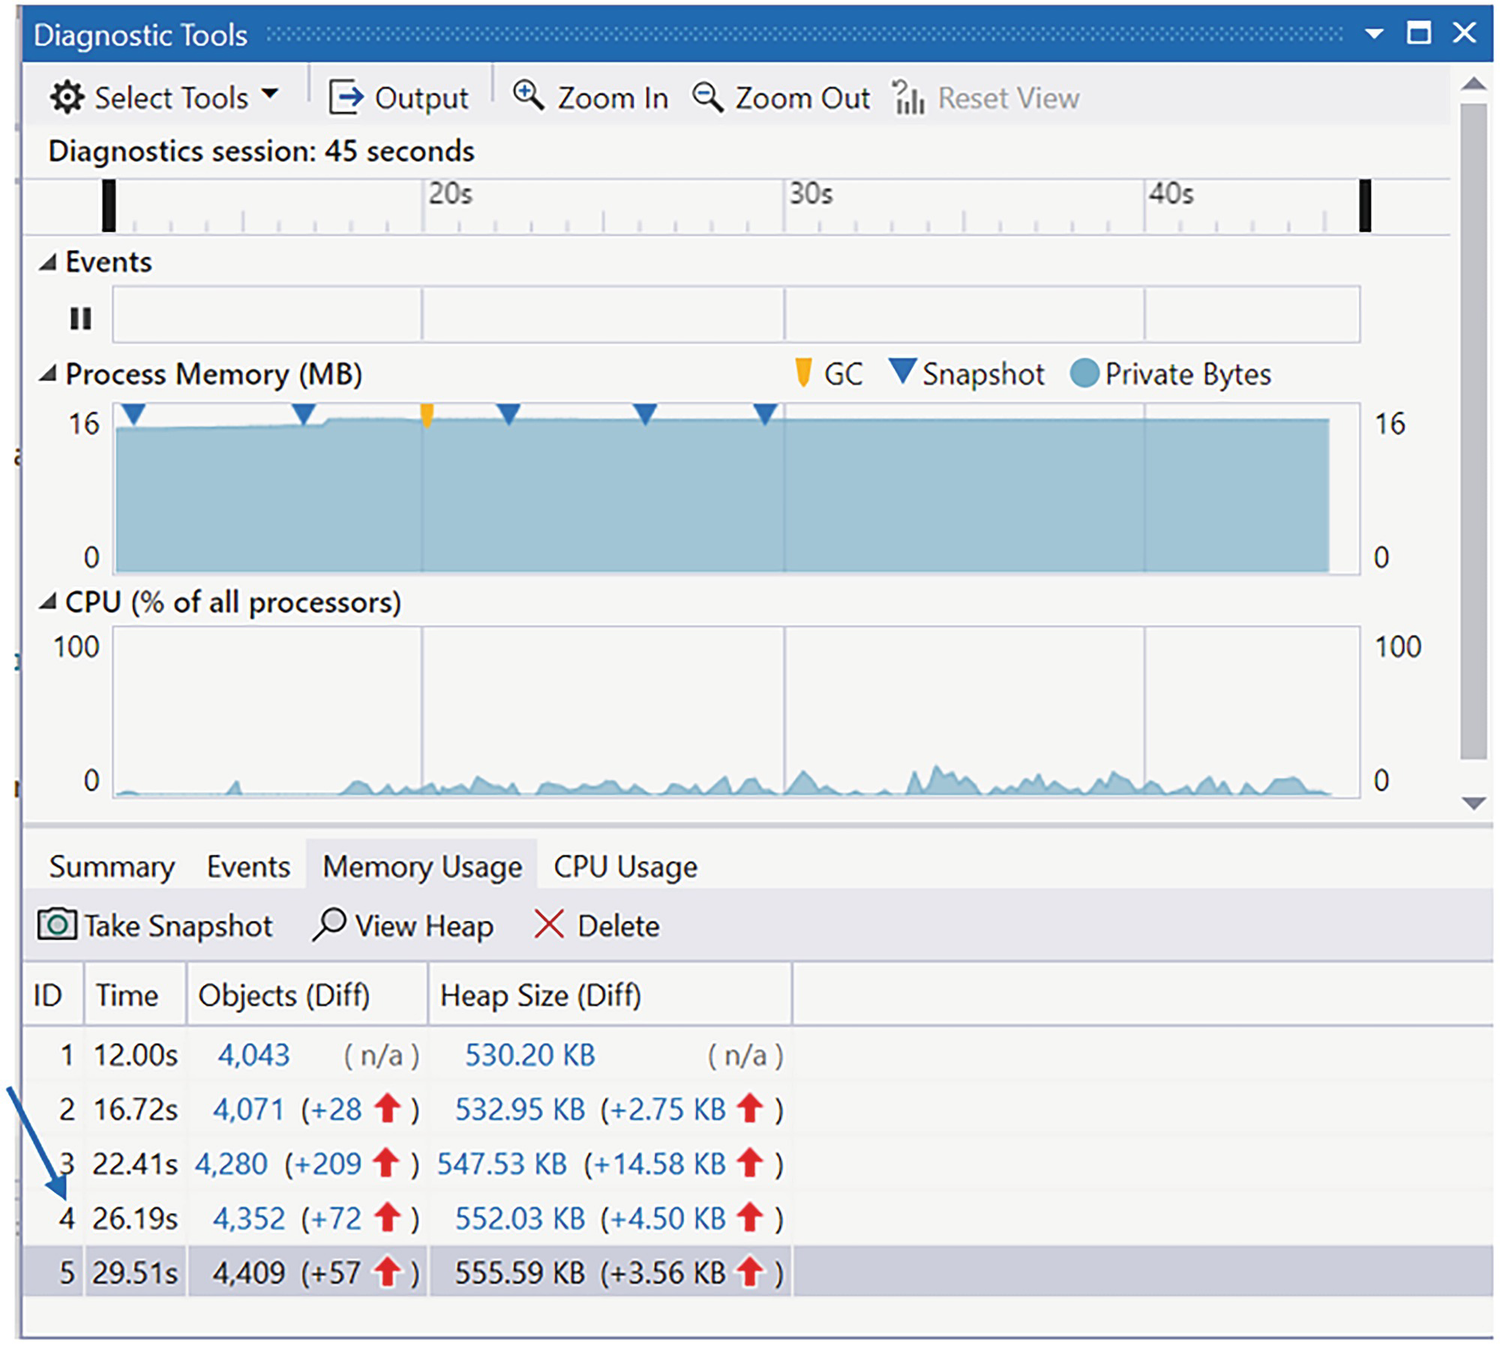
Different snapshots are taken using the Diagnostic Tools in Visual Studio
Snapshots from Diagnostic Tools

The object count difference in a particular snapshot
Similarly, I could show you the leak using Microsoft’s CLR profiler. But showing the usage of different tools is not the aim of the chapter. Instead, you want to prevent memory leaks using any tool you like. Since the diagnostic tool is already available in the latest editions of Visual Studio, I do not want to miss the opportunity to show its usage.
You use third-party code that has a leak. However, you cannot immediately find it, because you do not have access to the code.
Let’s assume that the leak can be revealed when some specific code path is followed. If the test team misses that path, it’ll be hard to find the leak.
A dedicated memory leak suite maintenance may need a separate test team. Also, you cannot include all the regression tests in the memory leak suite. It is simply because running a test multiple times and gathering those counters are both time-consuming and resource-consuming activities. So, it is recommended that you shuffle the test cases often and run your memory leak test suite.
When a new bug fix takes place, a test team verifies the fix using some test cases. Now you need to ask them whether those tests are already included in the memory leak test suite. If not, you need to include them. But if multiple fixes come in one day (say 10 or more), what to do? It may not be possible for you to include all the tests in your memory leak suite due to various reasons (for example, you may have resource constraints). Also, since a memory leak suite needs to run for hours, you get to see the result much later. So, in between, if new fixes enter into the main codebase, it is very hard to catch a leak that came earlier.
Summary
Preventing memory leaks in an application is a challenging task. It requires expertise and patience to find a leak in an application. In this chapter, I showed you the Diagnostic Tools window in Visual Studio and how to analyze a memory leak using events in C#.
What is a memory leak?
Why should you be careful about memory leaks?
What are the probable causes of memory leaks?
How can you perform a memory leak analysis with Visual Studio’s Diagnostic Tools window?