
Chapter 3. Process
“Plans are of little importance, but planning is essential.”
Winston S. Churchill
As one’s knowledge of the complexities and pitfalls around FEO grows, it is easy to begin to feel swamped by the various aspects of effective analysis. This is particularly the case if you have “failed to duck” and have been pitchforked into the responsibility for leading a performance optimization initiative, especially if (as is often the case) such a performance focus has been precipitated by some sort of public failure of the digital brand.
This chapter is an attempt to provide a standard structured approach as a starting point. It may not meet every situation or work for you exactly as presented, but it’s a start—and all I can say is that it works for me!
A Structured Process for Frontend Optimization
Having considered the types of tools available to support external monitoring, our FEO “toe dip” continues by outlining a structured process to support understanding and intervention in this important area.
At a high level, a logical FEO process seeks to move progressively from general to specific understanding. The following are the key stages:
Target definition and test specification.
External performance (response) and patterns.
Performance monetization goal: what is the optimal performance/investment that will just meet business goals (see Chapter 1)?
FEO effort required: response distribution between frontend, backend, and third-party components.
Granular investigation: detailed, component-level, client-side analysis.
Securing the gains, including ongoing monitoring and KPI definition (best case external plus end user).
This list is effectively technology-independent in that it could apply to anything being analyzed, although the tools used will differ between specific cases.
For completeness, I end this chapter (see “Emerging Developments”) with a brief consideration of several more recent developments in internet application delivery or those (such as bots) that affect performance while not being FEO-related, per se. IT is always evolving; the challenge to tool vendors and analysts alike is to evolve approaches to understanding and mitigating negative effects.
Defining Testing Targets
Before embarking on any actual analysis, it is worth pausing to define the targets for the testing. Such target definition is likely to collate information from multiple sources, including:
Knowledge of the key user touchpoints, such as landing pages, product category pages, shopping basket, etc. In thinking about this, a useful guide is to follow the money; in other words, track key revenue generating paths/activities.
Information derived from web analytics. This useful source will identify key transaction flows (any unusual patterns from theoretical expectations may reflect design or performance issues). Areas of the site associated with unexplained negative behaviors should be included. Examples include transaction steps associated with high abandonment, high discrepancies between destination page traffic (e.g., search-engine-derived), and high bounce rate.
If available, user click-pattern heat maps can also be a useful supplement (see Figure 3-1).

Figure 3-1. Visitor interaction click-pattern heat map (Crazyegg.com)
Hearsay knowledge: subjective input from multiple sources, such as internal users, friends and family, customer services, CEO’s golfing partners, etc.
Other visitor-based analysis (e.g., Real User Monitoring); in particular, key markets, devices, operating systems, screen resolutions, and connectivity distributions. The latter is particularly useful if supported by your APM tool.
Marketing/line-of-business input: who are the key competitors (by market), and can we learn anything from digital revenue data?
This will lead to a definition of the test parameters. The more core and edge-case conditions tested, the better the overall understanding, but as with everything, these will be limited in practice by time and money.
Warning
Raw visitor-derived data (i.e., from the field, not a usability lab) is (obviously) the outcome of actual experience rather than objective, controlled test conditions. For example, a low proportion of low-specification mobile devices may just be a reflection of user demographics or they may reflect user satisfaction issues. This is where validation of RUM inferences using synthetic testing in controlled conditions is particularly useful.
Reference List of Test Parameters
Having considered input from the various sources listed (and potentially others, like direction given to users of closed systems such as business partner ordering applications—e.g., “This application has been designed to function best using x browser, y operating system, z device”, etc.), a test matrix should be constructed. Table 3-1 is a typical example that lists the parameters for testing.
| Parameter | Value |
|---|---|
| PC Browser(s), versions | Edge, Chrome 48, IE 10,11 FF 34, 44 |
| Screen resolution(s) | 1366x768 |
| Mobile device (web) | Samsung Galaxy 5 and 6, IPhone 6, etc. |
| Mobile device, O/S (Mobile Apps) | Samsung Galaxy 6 Android |
| Mobile App details, source | Xyz.apk, Google Play |
| Connection bandwidth range (hardwired and wireless) | 0.25–2.0 Mbps |
| Target ISPs and wireless carriers (by market) | [UK, hardwired] BT, Telstra; [UK wireless] EE, Vodafone |
| Key geography(ies) | UK; S Spain (Malaga), Hong Kong |
| Competitor sites (target details), by market | |
| Other factors (e.g., user details associated with complaints) |
Evidence from Monitoring
Armed with the target specifications for testing, it is useful to begin by monitoring the outturn performance of the site/application. Such monitoring should represent a broad range of user conditions and identify patterns of response behavior across a relatively extended period of use (perhaps two weeks for “business as usual” data, together with peak load periods as a comparison).
High-level patterns
Applications do not exhibit a “straight line” response. Typically, performance (as measured from optimal—not end user—locations) will show a more or less regular sine wave of average response time, reflecting regular variation in traffic across a daily or weekly business cycle. That is OK, but it needs to be borne in mind that the actual situation is far more complex, given the diversity of user conditions in terms of, for example, geography, ISP, network connectivity (WiFi, public carrier, hardwired), mobile device, browser, and more. Other high-level patterns are possible (for example, the progressive reduction in performance followed by sudden reversion to normality, as seen in memory-leak situations), but if the data is tightly controlled, it is fairly rare to find random variation in performance. It can happen, though, and when it does, it tends to consume much time in isolation and resolution.
For these reasons, it is essential to consider three key aspects when seeking to understand performance for FEO (as opposed to business-as-usual production monitoring purposes). These are:
To understand and maintain absolute control of test conditions (for active testing) or the nature of the user(s) (for passive or RUM testing).
To avoid data aggregation—sampling is of little use, and averages are useless. Examine scattergrams of raw data wherever possible.
Use selective filtering for comparison—for example, by comparing response according to mobile connection bandwidth, or between high and low traffic periods.
These approaches should enable the analyst to determine the distribution of response behavior, examine the relationship between core response and outliers, and drill down to understand the broad causation of low performance behavior. Such insights form the foundation of subsequent systematic FEO analysis. Without them, it is difficult to understand the business impact of any issue, and to direct effort accordingly.
The special case of applications based in shared data centers should be mentioned. In situations where multiple (often templated) sites share some aspects of a common infrastructure, it is possible for high traffic to a few sites to cause depletion of delivery resources to others. An example of this situation during Black Friday peak trading is shown later in Figure 3-6.
FEO effort required
As poor performance can be the result of many primary causes (and, indeed, the interaction between more than one), it is important to determine the extent to which client-side issues are involved before committing resolution effort that may be best spent elsewhere. This can be determined by examining the overall time distribution involved in application performance, split across three high-level areas: delivery infrastructure, network, and client.
A number of tools will assist here. From a Freemium perspective, the old dynaTrace AJAX edition utility was particularly effective but, sadly, is now discontinued (and it was also only a PC browser tool). Many of the modern APM tools will fill the void, albeit with differing levels of granularity and elegance.
Such preliminary monitoring enables us to understand what we are up against from a frontend optimization perspective, and ultimately whether we are looking at fine-tuning or wholesale interventions. Use of APM tooling can be particularly useful at this initial stage, both in understanding the relative proportion of delivery time associated with client-side versus backend processing (see Figure 3-2), and in isolating and excluding any issues associated with delivery infrastructure or third-party web-services calls. However, as the external monitoring extensions to APM tools are still evolving in functionality (particularly in relation to synthetic testing), additional tools will probably be preferred for more detailed FEO investigation, due to the better control of test conditions and/or granular analysis offered by more mature and differently positioned products.
In capturing this baseline data, it is important to compare both consistent and end user conditions. Ideally, both visitor-based (RUM) and synthetic-based data should be used. This will give useful information regarding the performance of all components in all traffic conditions.
If at all possible, and as mentioned above (see “What Are You Measuring? Defining Page-Load End Points”), common above-the-fold (perceived render time) endpoints should be introduced as custom markers. This will greatly assist in reading across between the test types. Such modifications provide a more realistic understanding of actual end user response, although they would be somewhat cumbersome to implement across a wide range of screen resolutions. As noted earlier, some modern APM tools will automatically inject such flags.
![Client-side versus server-side processing time (dynaTrace [AJAX Edition])](http://images-20200215.ebookreading.net/6/2/2/9781491985038/9781491985038__frontend-optimization-handbook__9781491985038__assets__feoh_0302.png)
Figure 3-2. Client-side versus server-side processing time (dynaTrace [AJAX Edition])
Subpage-Level Performance
Depending on the detailed characteristics of the target sites, it is often useful to run several comparative monitor tests. Some specific cases (such as Single Page Applications and server push content) are covered in “Emerging Developments”.
It is often useful to understand the impact of particular—for example, third-party affiliate—components on overall response. This can be achieved in a number of ways. Two of the most straightforward are to test for a SPOF (Single Point of Failure)—i.e., the effect of failure of particular (often third-party) site content—or to remove content altogether. Techniques for achieving this will depend on the tool being used. See Rick Viscomi et al’s Using WebPageTest (O’Reilly) for details in relation to that tool. The same intervention can be made in most synthetic tools (with more or less elegance) using the relevant scripting language/utility.
Selective filtering of content can also be used to examine the effect of particular calls on aggregate delivery metrics such as DNS resolution or content delivery times.
This screening provides background intelligence prior to beginning detailed analysis of frontend components. Before covering these, now is probably a good time to introduce a standard monitoring matrix that I typically use to provide a structured approach to preliminary screening of external performance. The results are used to inform and direct detailed granular analysis, an overview of which is covered on subsequent pages.
Model Checklist for FEO Preliminary Screening
This 13-point checklist provides a picture of the revenue-relevant behavior of the site/application. This is not exhaustive—it should be led by the findings from case to case—but it supports targeting for the more granular, static component-level analysis that provides the root cause and business-justification basis for specific remediation interventions (see “Granular Analysis”).
Dynamic performance: page onload and perceived render (above the fold)
24x7 availability and response patterns: synthetic ISP (by market)
24x7 availability and response patterns: end user by market (synthetic and RUM)
Target browser/screen resolution and device
Any cross browser/device discrepancies?
Defined connectivity: hardwired and public wireless carrier
Page response distribution
Histogram of response ranges
Median response and distribution (median absolute deviation)
Weekly business hours
Day versus night (variation with traffic)
Cached versus uncached
By key market/user category
Performance monetization (tool-dependent, examples)
Page/transaction response versus shopping cart conversion
Page/transaction response versus abandonment
Page/transaction response versus mean basket size
Page/transaction response versus digital revenue (defined time period)
Page response versus bounce or exit rate
Competitive comparison: direct and mass market sites
Page and revenue bearing transaction (e.g., search and add-to-basket)
Limiting bandwidth tests
Response to progressively reducing connectivity conditions
WiFi and public carrier
Transaction step comparison
Where are the slowest steps (and why—e.g., database lookup)
Payload analysis
Page download size patterns
Affiliate load: third-party effects
Filter and SPOF testing
Real-device mobile testing
Component splits/patterns
DNS/SSL resolution
Connectivity
First-byte time delivery (infrastructure latency)
Content delivery
CDN performance assurance
Origin versus local cache comparison
Detailed static component analysis
![Examples of summary outputs from screening [L-R]: Response to limiting connectivity bandwidth (Mobile carriers); Third-party associated cross-browser response variation (component level); RAG based findings summary](http://images-20200215.ebookreading.net/6/2/2/9781491985038/9781491985038__frontend-optimization-handbook__9781491985038__assets__feoh_0303.png)
Figure 3-3. Examples of summary outputs from screening [L-R]: Response to limiting connectivity bandwidth (Mobile carriers); Third-party associated cross-browser response variation (component level); RAG based findings summary
Granular Analysis
So where have we got to? Those who have read all the content to this point will have:
An understanding of the potential benefits of frontend optimization
An appreciation of the various types of tooling available
A suggested how-to process for effective results in this area
Having understood the external performance characteristics of the application, in both “clean room” and, more particularly, in a variety of end-user monitoring conditions, we now approach the core of frontend optimization. Monitoring will give a variety of whats, but only detailed granular analysis will provide the whys necessary for effective intervention.
The initial monitoring activity should have provided a good understanding of how your site/application performs across a range of demand conditions. In addition, regardless of the absolute speed of response, comparison with the performance of competitor and other sites should indicate how visitor expectations are being met, and the initial goals for improvement.
Know Your Constraints
Before engaging in hand-to-hand combat with the various client-side components of your site, it is worth taking time to ensure that whoever is charged with the analysis knows the site in detail. How is it put together? What are the key constraints—business model, regulation, third-party inclusions, legacy components—it’s a long list. While being prepared to challenge assumptions, it is good to know what the givens are and what is amenable to modification. This provides a good basis for detailed analysis. The team at Intechnica (where I worked for several years) typically adopt a structured approach, as outlined in the next sidebar, bearing in mind that the focus of investigation will differ depending on what is found during the early stages.
As this material is aimed at the “intelligent but uninformed” rather than leading-edge experts, it is also worth ensuring that you are aware of the core principles. These are well covered in many published texts, although things move quickly, so the older the book, the more caution is required. A short suggested reading list is provided in Appendix B.
In summary, a logical standard flow could look rather like this sidebar.
This applies to all investigations, although tooling will differ depending on the nature of the target application. I take a similar approach to all PC-based applications. Analysis of delivery to mobile devices—whether web, webapp, or native mobile applications—benefit from some additional approaches, and these are also summarized in “Monitoring Mobile Devices”.
Flow Process: Granular Analysis
We have now determined testing targets and understand at a high level the dynamic “outturn” performance of the application—both in terms of individual pages (if present) and specific functions, but also key business transactions. It is now necessary to move from the what to the why: the underlying causation of poor performance.
Clearly, root causes can lie at many doors—backend infrastructure, network performance, third-party interactions, and others—but this book concerns itself primarily with frontend (that is, user-device-based) issues. As such, the following is a suggested sequential process for rapid screening of FEO causation:
Preliminary rules-based screening
Anomaly detection/investigation
Network-level investigation
Component-level analysis
Client-side logic (JavaScript)
Images/multimedia content
Other aspects
Affiliates
(CDN)1
(Backend interactions)
It may well be that isolation of a specific issue involves crossing many of these categories, and a sound knowledge of the architecture of the application will always stand the FEO analyst in good stead.
Rules-based screening
Flippantly, traditional rules-based tools have the advantage of speed, and the disadvantage of everything else! Not quite true, of course, but it is necessary to interpret results with caution for a number of reasons, including:
Developments of technology and associated best practice (e.g., adoption of HTTP2 makes image spriting—formerly a standard recommendation—a potential antipattern)
Limitations of practical interpretation/priority (e.g., rules based on the percentage gains from compression can flag changes that are small in absolute terms)
Just plain wrong (e.g., rules that interpret CDN usage as “not using our CDN”)
Perhaps for a combination of these reasons, the number of free, rules-based screening tools is rapidly diminishing: YSlow and (the excellent) SmushIt image optimization and dynaTrace AJAX Edition tools have all been deprecated over the last year or two. Page Speed Insights from Google is a best-in-class survivor. This is incorporated within several other tools. It provides speed and usability recommendations for both mobile and PC.
So the message is that rules-based screening is a good method for rapidly getting an overall picture of areas for site optimization, but a) use recent tools and b) interpret judiciously. Figure 3-4 illustrates a Chrome-based example.

Figure 3-4. Browser-based developer tool
Rules-based screening should provide an insight into the key areas for attention. This is particularly valuable in time-intensive screening of multiple components (e.g., cache settings). Figure 3-5 provides an example of a comprehensive, clear, RAG “traffic light” output. Note the score disparity between Server (A, left) and frontend components (F, right).

Figure 3-5. Rules-based tool (dynaTrace AJAX Edition)
Monitoring anomaly investigation: slow versus fast versus median
A logical next step is to investigate the underlying root cause of anomalies highlighted in the preliminary monitoring phase. Average traces are useless (for all except possibly long-term trend identification), so it is necessary to identify outliers and other anomalies based on scattergrams of raw data. Seek to associate underlying causes. Prior to detailed drilldown, consider possible high-level effects.
Common among these are traffic (compare with data from RUM or web analytics), poor resilience to mobile bandwidth limitations, and delivery infrastructure resource impact from background batch jobs or crossover effects in multitenant providers (see Figure 3-6).

Figure 3-6. Multitenant platform effects: base HTML object response during Black Friday peak trade weekend 2015 (reference site in blue)
Figure 3-6 shows a scattergram of “base HTML object” response. This is a homepage-derived metric that excludes potential sources of comparative confusion between sites; it is the raw response of the site in question. The various sites supported by the platform are represented by different colored dots. As may be expected, the baseline response of the individual sites differs. Most of the time, the response of a given site falls into a more or less defined band of response. In the high-traffic period illustrated, sites will occasionally show a delayed response due to inability to cope with user volume at a point in time. The blue dots (representing a non-multitenant site) show good examples of this—the response is mostly good, but there are periods, such as the example in the middle of the chart, where this is not the case.
With the other sites (i.e., those on the shared hosting platform), the situation is more interesting. Again, baseline responses vary, but note the periods (highlighted in red) in which platform stress has led to multiple sites being affected. Typically, this is because some core shared-platform resource has become depleted due to the overall traffic volume. This causes slower responses to all sites on the platform, whether or not they are individually under stress.
The amount of detail available will obviously depend upon the tooling used for the initial monitoring, although recurrent effects, if identified, should enable focused repeat testing with other, more analytics-focused products such as WebPageTest.
A few notes may be helpful:
Statistical analysis of individual components is powerful. I suggest that you compare maximum, minimum, and dispersion of individual components (DNS time, connect time, etc.) from median and outlier responses. Progressively remove specific content (e.g., third-party tags) and compare the effect.
Some examples:
Understand intraday stress from traffic patterns on the site (typically using behavioral analytics tools or RUM; see Figure 3-7).

Figure 3-7. Daily traffic patterns to major UK eCommerce site (Google Analytics)
Use time-banding comparison to understand the “pinch points” associated with poor performance at component level (see Figure 3-8).

Figure 3-8. Intraday analysis: peak versus low traffic
Consider the effect of third-party affiliate content (see Figure 3-9).
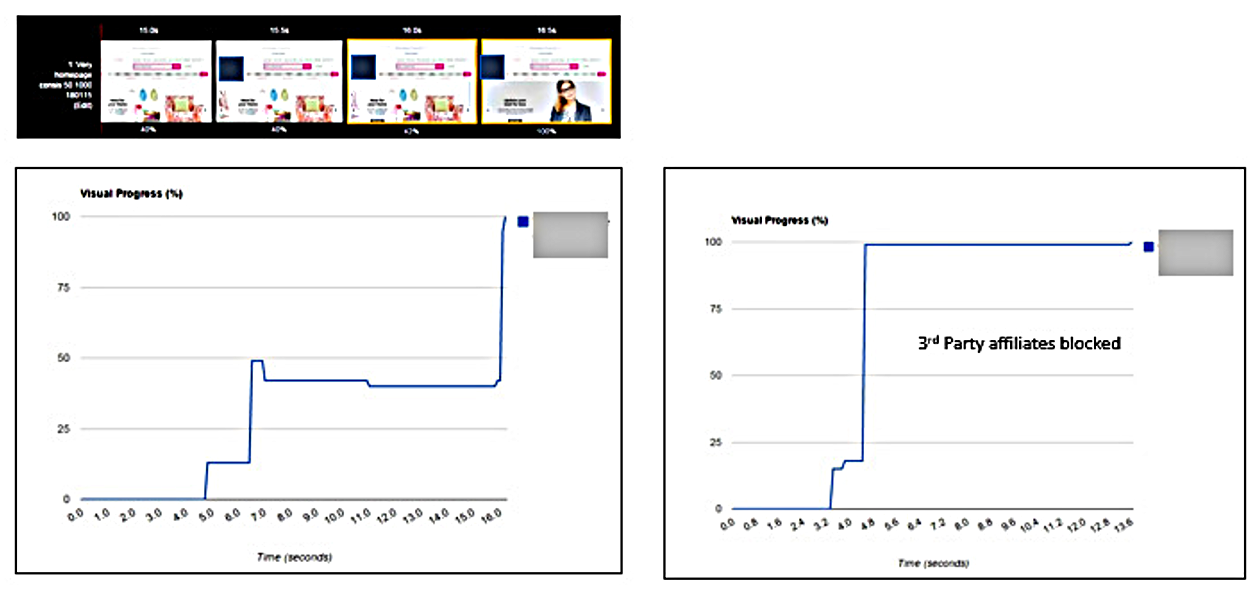
Figure 3-9. Visual progress charts with and without third-party affiliates (WebPageTest.org)
Warning
Beware distortion, particularly if page-load end points have been insufficiently well defined (as previously discussed). Waterfall charts should always be inspected to detect gotchas such as below-the-fold asynchronous content or server push connections. Caution needs to be exercised in interpretation of short responses as well as long. Compare payloads; these are often impacted by variable implementation of server-side compression, or content failure.
APM Baseline data may be useful here—although baseline management deserves a book to itself!
Network-Based Investigation
Synthetic test tooling essentially operates by analyzing network interactions between delivery infrastructure and user client (with varying degrees of sophistication). Much of this information is derived from network packet capture (PCAP) data. This is usually represented graphically using a so-called waterfall chart. A waterfall chart is simply a graphical representation of a sequential process. Individual line items (y axis) represent different components in the order called by the browser, and the x axis is the timeline. The duration of network interaction of a particular component is shown by a bar. Such bars are often color-coded to illustrate the type of component displayed (images, JavaScript, etc.) A waterfall chart is an extremely useful mechanism for rapid understanding of delivery constraints.
Earlier, Figure 2-14 showed a simple (APM-based) example. Interpretation of waterfall charts (as used within the WebPageTest tool) is well covered in Rick Viscomi et al’s Using WebPageTest (see Appendix B). Such charts can provide much useful information in addition to the parsing of individual object delivery (i.e., partitioning between DNS lookup, connection, first byte, and content delivery times).
Such aspects as blocking behavior, asynchronous/synchronous delivery, and the absence of persistent connections are clearly shown. Side-by-side comparison of waterfalls with different page response time outcomes is a useful technique supported by some tooling. Figure 3-10 shows an example of (third-party) JavaScript blocking activity (arrowed), in this case due to script interaction with 3,000+ DOM nodes.

Figure 3-10. Component waterfall chart showing JavaScript blocking (Chrome Developer Tools)
In certain cases, it might be useful to examine traces from “full-fat” network tracing tools (such as Gomez Transaction Trace Analyzer or WireShark). Figure 3-11 illustrates the use of Cloudshark to investigate/confirm server response latency by identifying any delay between network SYNchronise and ACKnowledge responses.

Figure 3-11. Network traffic analysis: pinpointing server latency using Cloudshark
Component-Level Analysis
Following the investigation of response anomalies, it is useful to undertake some detailed analysis of the client-side components of the target page(s); for example. each individual page in a key revenue-bearing transaction. This is sometimes termed static (as opposed to dynamic) analysis.
Raw data from representative individual tests (in controlled conditions) should be downloaded and examined. It can be particularly useful to compare with a similar high-performance reference site (possibly a competitor). Such analysis should include consideration of both individual components and network PCAP traces.

Figure 3-12. Individual component/competitor comparison; high variation highlighted
Client-side logic (JavaScript)
In-browser logic is typically introduced using JavaScript, a lightweight programming language developed for this purpose. To be most effective, screening and optimization of JavaScript components ideally should be undertaken by the developers who originated the code—or, at least, with a strong familiarity with such programming and the application itself. In some cases, such as the incorporation of third-party content into the site (e.g., the use of gambling games within betting and gaming sites), direct intervention is not possible. In any event, the following should be considered. It may be helpful to use the parameters below as a checklist when reviewing the functional capabilities of screening tools.
- Absolute number of scripts and their blocking behavior (if any)
Interacting with multiple scripts introduces a network and back end infrastructure overhead. It is often useful to seek to concatenate scripts where possible.
- Download source, number of domains
Minimizing the absolute number of domains and third-party origin—particularly if very distant—likewise reduces traffic overhead.
- Code size
Compression, minification. Network bandwidth overhead reduction.
- Code coverage.
Are the same calls being made by multiple scripts? Ideally, any query or manipulation should be undertaken once and reused.
- .js total duration versus execution time
Long-duration scripts should be examined to understand which calls consume the most time overall and why—for example, interrogation of every Domain Object Model (DOM) element on a site is very time- and resource-consuming, especially in sites with large numbers of such elements (see Figure 3-13).
- CPU overhead
This is particularly important if delivered to limited capacity mobile devices. A combination of poor characteristics such as those above can result in severe impact on users with entry-level devices. It is worth noting the perhaps obvious point that some markets, particularly those in emerging economies, have a far higher penetration of such devices than advanced markets (see Figure 3-14).
Where practical, it is often instructive to analyze and compare equivalent pages/functionality on competitor sites, particularly those with a superior response performance.

Figure 3-13. JavaScript comparison; note discrepancies between execution time/ total duration, CPU overhead, and size (dynaTrace AJAX Edition)

Figure 3-14. Mobile response; timeline report; note-intensive JavaScript processing (Chrome Developer Tools)
It is now useful to focus on individual “rogue” scripts. As always, drill down systematically from high level to the most granular supported by your chosen tooling (see Figure 3-15). Where is the time going?

Figure 3-15. Examination of individual JavaScripts
Images/Multimedia
Images and multimedia content often represent a huge proportion of the total payload of a page. This is a very fertile area for enhancement, and also for the application of effective governance of acceptable content specification. Such governance is achieved by explicit business controls and processes (e.g., maximum size, format specifications), “flight manuals,” and the like.
Within the application, it is important to avoid bad practices such as HTML-based scaling. Content format should be considered, both in terms of relevance to the image type—icon, animation, transparency, etc.—and the recipient user device. The former is covered well in the relevant chapter of Steve Souders’ Even Faster Web Sites (O’Reilly, 2009) though unfortunately, the SmushIt tool is no longer available. Some visibility of the effect of optimal compression (at least as far as .png images are concerned) can be gained from using other open source tools such as pngcrush or png gauntlet.
Efficient image handling by some devices is facilitated by using an appropriate format; for example, WebP images for Android mobile devices will save some 30% of total size compared to standard JPG codecs, with quoted delivery efficiency of around 10% at equivalent image quality. Compression is important, as is removal of superfluous (nonvisual) image data—such as the date—so-called “image metadata.” This is handled automatically by many image enhancement programs. As a general rule, some of the most dramatic savings are delivered by ensuring that quality is the minimum acceptable rather than best possible. This is a subjective decision, but well worth exploring, especially for small-format mobile devices.
Having determined and stored a set of ideal images, delivery can be managed automatically by reference to the visitor browser user string. These services are offered as options from established major content delivery vendors. A number of specialist companies also exist. The imgix site is worth exploring, if only to examine the effect on overall size of changing specific parameters within their (foc) sandbox. A Google search will reveal other (open source) tools. With regard to monitoring multimedia streams, it is worth mentioning that several major APM vendors are planning this capability as an extension to RUM functionality in their downstream roadmaps.2
Figure 3-16 from a Meet the Team page on a mobile site illustrates the dramatic reduction in size with little loss of clarity. Further reductions are certainly possible, but this illustrates the point.

Figure 3-16. Image optimization
Readers interested in the specifics of image optimization (which is a fairly large and detailed area) are referred to Ilya Grigorik’s excellent detailed treatment of the subject.
Additional Considerations
The previous examples highlight some of the most fertile areas for potential optimization. Many others exist, such as cache/compression handling, third-party content interactions (including daisy-chaining behavior by introduced affiliate tags—a potential security, as well as performance, issue).
Affiliate Content
Poor governance of “Performance by Design” practice include the presence of multiple/outdated versions of affiliate tags or jQuery libraries, and sites with excessive numbers of DOM nodes. Although a not infrequent cause of performance inefficiency, the latter is a good example of a finding that is not amenable to immediate change, as it requires a fundamental rebuild of the site.
The blocking behavior of stylesheets and fonts is worth considering. In the case of fonts, this is true particularly if your user base has a high proportion of Safari users due to this browser’s poor response to missing content; it will wait for an indeterminate period for missing fonts rather than rapidly switching to a default.

Figure 3-17. Affiliate content: two aspects of interaction (Left: Ghostery. Right: Requestmap by Simon Hearne of NCC Group)
Other third-party performance examples are shown in Figures 3-18 and 3-19.

Figure 3-18. Third-party affiliate tag content—DNS response (WebPageTest.org)
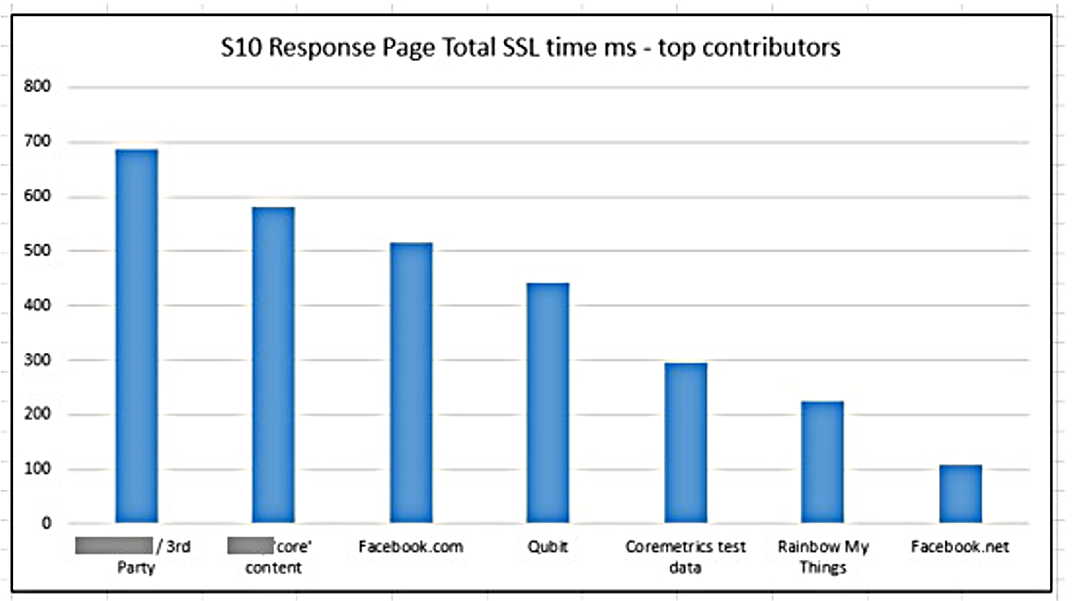
Figure 3-19. 24-hour mean SSL response by origin
An Optional Allied Activity: CDN Performance Assurance
Although not strictly within the remit of frontend optimization, Content Delivery Network (CDN) efficiency often has a major influence on performance, particularly for sites with a highly distributed global customer base and/or heavy content loads.
CDN usage is extremely pervasive, both for core content and by third parties. They can also represent a significant ongoing investment overhead. Should you wish to understand CDN performance, a useful first step is to screen your target site with a (free) tool such as CDN Planet’s CDN Finder.
This will, in most cases, display a list of CDNs detected by domain. CDN technology is very powerful, but needless to say, it does not have miraculous powers. Like any other tool, it relies on correct initial configuration of the CDN itself and the cache settings of the accelerated site. Individual CDNs do vary in efficiency, particularly between global regions. For all these reasons, it is worth undertaking a CDN performance assurance test, providing that you have suitable tools at your disposal. Today, this limits you to a couple of vendors, but the situation may evolve.
The functionality required is the ability to test from a distributed network of consumer devices. ISP-based testing is of limited use for this purpose (for reasons that I don’t have space to go into). Although in an ideal world ongoing assurance testing (linked to a Service Level Agreement) is beneficial, in practice a limited test of 24- or 48-hour duration will pick up any gross issues.
Two aspects are useful for FEO screening purposes (Figure 3-20 illustrates both):
If it is possible to set up testing directly against the origin content (bypassing the CDN)—this will depend on how the site is coded with regard to the CDN—set up parallel tests from end-user locations in relevant geographies: one test navigating to the origin servers, and the other to the local (CDN) cache. The discrepancy between the response values obtained is effectively what you are paying the CDN for. In Figure 3-20, an average acceleration of 77% was delivered during the test period. For ongoing tests (e.g., for operations dashboards, etc.), it is easier to visualize using average line traces rather than scattergrams.
Using reverse IP lookup, examine the origin location for the CDN content. Bear in mind that CDN delivery is dynamically optimized for performance, not origin location. However, such inspection can pull up examples of poor configuration where present. Figure 3-20 is normal, although the range of origin locations (delivering content to an exclusively UK user base) is interesting.

Figure 3-20. Aspects of CDN performance (Credit: Gomez)
Backend interactions
Although outside the scope of this book, it may be that performance “gating” factors are found associated with interactions with the core delivery infrastructure, like database lookups or other web services calls, for example. The more holistic aspects of Application Performance Management (APM) tooling can be of considerable value here in tying together backend issues with outturn performance.
Emerging Developments
This section provides input as to monitoring approaches and modifications suggested by various cases, driven by advances in technology increasingly adopted within target applications.
The following are briefly addressed in this section:
Single Page Applications
Applications incorporating server push and/or service worker
HTTP/2
Microservice-based applications
Bots
Single Page Applications
So-called Single Page Applications (SPA) are becoming increasingly common, either as a complete application (as the name suggests) or as an element of a larger “compound” application. SPAs are characterized by their use of client-side JavaScript frameworks (such as Angular or React). They permit dynamic extension of HTML and leverage the computing power of modern user devices.
The issue that SPAs present from a monitoring perspective is that they minimize the network interactions between user device and origin infrastructure. The historic page-based download paradigm (and dependency) doesn’t apply. This presents a problem for traditional synthetic monitoring, given that they are based on capturing and analyzing just that over-the-wire interaction.
User:site interactions (termed soft navigations) and data delivery are independent of the standard W3C navigation API flags (DOM Ready, onload, etc). Many interactions occur entirely within the client device.
Although some nuances can exist depending upon the detailed design of applications—unless a user interaction (e.g., button click) is reliably associated with a network request—the primary (but important) value of synthetic monitoring in this use case becomes the monitoring of availability. This key metric is unavailable to passive (site visitor) based tools, for obvious reasons.
Any interactions that are directly linked to a network call can (in most synthetic monitoring scripting utilities) be specifically “bracketed” and their response patterns examined. Otherwise, monitoring best practice requires the use of RUM instrumentation.
Unfortunately, not all RUM tools are created equal, so if it is likely that you will be squaring up to SPAs, it will be important to check (and validate) that your RUM tool (as an extension of your APM tooling or otherwise) offers the granularity of recording required. If not, an alternative (assuming the APM vendor cannot provide realistic comfort regarding their roadmap) may be to integrate a standalone RUM that can offer such functionality. At least one current product (at the time of writing) has been specifically modified to meet the SPA use case. However, this is an evolving situation of direct business relevance. Others will undoubtedly follow.
HTTP/2-Based Applications
The evolutionary specification of HTTP/2, a formalization of Google SPDY, has been available for some time. Adoption is now reported to be rapid, and this rate is expected to further increase with progressive server adoption.
HTTP/2 provides a number of transport efficiencies relative to HTTP/1.x. These include request multiplexing (i.e., effective handling of multiple requests over the same connection), compression of head components, and other design interventions to avoid multiple retransmission of head metadata.
These changes deliver considerable advantages, certainly theoretically, in sites with large numbers of element requests and those involving delivery to users in high-latency conditions, although the jury is still out to some extent. They also make it necessary to be aware of changes in interventions formerly regarded as best practice for optimized performance.
Domain sharding, which was formerly adopted to increase the effective number of parallel connections, becomes an antipattern. Domain sharding involves the risk of request failure and consequent retransmission, particularly in conditions of limited connectivity (mobile delivery in rural locations and countries with poor internet infrastructure). It impacts the inherent HTTP/2 efficiencies of header compression, transmission optimization, and resource prioritization possible over connection to a single domain. It does not present monitoring or analysis challenges per se, and can form part of optimization recommendations.
Content concatenation, the most prominent usage of which is in image spriting but which may also be applied to other content, aims to reduce the number of roundtrip requests. This has, however, the disadvantage of forcing refresh if any part of the grouped content changes. Revised best practice, driven by the transmission efficiencies inherent in HTTP/2, directs reduced individual object payloads and essentially a more granular management of content at individual element level. This, for example, supports more appropriate cache setting with regard to the specifics of particular objects.
Inlining, the incorporation of content (e.g., JavaScript) within highly prioritized download components (e.g., HTML), was formerly adopted to accelerate delivery of required content while minimizing the requirement for round-trip journeys and delays due to differential content-type download priorities by HTML. It had the disadvantage of preventing individual caching of the inlined content. The recommended best practice replaces inlining with server-push-based delivery, thus supporting both progressive content delivery and more granular cache management.
It should be noted that, apart from increased adoption of server-push interactions (see “Persistent Browser Interactions”), these changes involve modification of FEO interpretation and recommendation, rather than impacting monitoring practice.
Persistent Browser Interactions
This section draws together a number of developments that, if unmanaged, will introduce serious distortion into monitoring outputs using “traditional” tools. The Beacon API, a useful approach to gaining understanding in these situations, is highlighted.
Persistent duration server:client interactions are a core facet of modern applications. In certain cases, this is driven by the nature of the application itself (e.g., delivery of live-update betting odds). Other drivers are the leverage of HTTP/2 efficiencies (see “HTTP/2-Based Applications”) and the development of network-independent mobile WebApps (otherwise known as Progressive Web Applications [PWA]).
PWAs effectively coexist with native mobile applications. They incorporate local device caching, and store and forward capabilities that enable usage in unstable or off-network conditions. PWAs utilize service workers. These replace the limitations of former AppCache-based approaches. They are event-driven, and facilitate great flexibility in content delivery. Service-worker capability offers many attractive advantages in the creation of more business-centric mobile-device-based interactions.
The challenge to historic monitoring practice is that long duration connections (of whatever type) distort the recorded page-load end point in traditional synthetic monitoring tools. This must be identified and corrected for; otherwise, incorrect performance inferences may be drawn, particularly in terms of recorded response variation.
Fortunately, identification of server push or other long-duration interactions is usually obvious from inspection of standard waterfall charts. Correcting for it in an elegant manner is more difficult. If we ignore the (semi-proprietary) validation approaches incorporated within the scripting tools of certain synthetic monitoring providers—as they are not widely adopted—arguably the best approach to synthetic testing is simply to identify and then filter out the long-duration calls. Although somewhat of a blunt instrument, it does get around the problem.
A more elegant approach, based on RUM analysis, emerges with the availability of the new sendBeacon API, the syntax of which is:
Navigator.sendBeacon(url,data);
Use of this call enables granular instrumentation of application code to specifically record response to events. It should be noted that this is newly released (at the time of writing), so it is likely that reliable cross-browser support is unlikely to be complete. However, I understand that the leading-edge performance team at Financial Times in London reports effective use of this API in production conditions.3

Figure 3-21. Example instrumentation code using the sendBeacon API
Internet of Things
Sensor-based applications, collectively known as the Internet of Things (IoT), have been slowly evolving since Coca-Cola introduced the self-reordering dispensing machine more than 40 years ago. It is now in danger of becoming one of the most hyped areas of new technology. Certainly, actual companies are now trading (in the UK, Hive and Nest to name but two). Regardless of whether the app is controlling your heating thermostats, reordering the contents of your fridge, or (in the future) ordering up a driverless car for your commute to work, it is important to be able to understand and validate performance in objective terms. Figure 3-22 shows an example of a mobile device-based controller and associated API.
Unfortunately, IoT networks are fairly closed systems. As such, they are not accessible to scheduled synthetic external testing. However, at the end of the day, it’s only device monitoring, so a strong crossover with traditional end-user monitoring exists. Two approaches are possible:
Instrument the mobile application used to control the system
If available, monitor via the API or, if available (typically in APM tooling), a WebServices-based gateway to the application in question

Figure 3-22. IoT application control panel and (third-party) API code (HIVE Home)
Microservice-Based Applications
The primary development and/or extension of applications based on microservices—discrete functionality containerized elements—is becoming very popular. Arguably, this is being driven by the popularity and availability of open source platforms, particularly Docker, though alternatives exist.
The pros and cons of microservices adoption are outside my experience and the scope of this material. Suffice it to say that despite the ownership advantages of highly granular functional elements from an agile development perspective, microservices-based applications deliver an additional layer of integration and management complexity from an operations perspective. Performance understanding should be considered from both a backend and external approach.
From the point of view of the containers themselves, the major APM vendors are increasingly including specific support for these technologies. Currently, given the market dynamics, specific support starts with Docker, although other platforms will be explicitly supported moving forward. The extent of visibility offered by the various APM tools does vary, although it is likely that your choice will be made by other considerations (and therefore you will “get what you get” with respect to container performance visibility). Figure 3-23 shows an APM based example of visibility of microservices components (in this example, using Docker).

Figure 3-23. Microservices container monitoring (Example: Ruxit)
In terms of external monitoring practice, the core change is not the high-level approach/tooling mix, but rather the importance of ensuring that poor performance of core services and/or module interactions are targeted, such that interventions can be made rapidly. This is particularly apposite given that the nature of testing and preproduction environments is such that it is likely that issues will arise that only emerge post release-to-production when the application encounters real-world load and interaction complexity conditions.
The take-home message should therefore be to monitor with underlying services in mind. This implies a sub-page monitoring approach. Greater granularity of monitoring can be achieved, by, for example, (with synthetic tooling) scripting transactions to bracket key in-page interactions (reported as step timings), and (with RUM) using additional timing markers/beacons to achieve the same effect. Issues not specifically detected by these techniques should reveal themselves by changes to traffic flows and user behavior. These are best detected by cultivating an approach to web analytics reports that is both absolute and intuitive.
Bots
Although not strictly associated with FEO, a few words on bots are relevant to the consideration of third-party-related performance constraints. Bots (or web robots) are automated site interactions. Although the majority (ranging from search engines to synthetic testing and price aggregation) are not malicious in intent, they represent a huge proportion of total site traffic—over two-thirds for typical retail sites, for example.
Figure 3-24 below is a particularly clear illustration, derived from IP traffic analysis on a UK retail site, of the predominance of bot traffic (bottom histogram) versus customer traffic (center histogram).

Figure 3-24. Global car rental site; UK traffic by unique IP per hour; total versus customer traffic
This level of bot traffic represents a significant economic cost, both in maintaining otherwise unnecessary infrastructure and in reducing the effective capacity overhead of the site (and therefore its ability to benefit from peaks in real-customer traffic). These benefits can be extremely significant. One of the retail clients of Intechnica—the performance consultancy where I worked for several years—was able to reduce its IBM license requirement for WebSphere Commerce Suite from five to three cores. This resulted in a significant saving in annual license costs.
Unfortunately, bot effects are not simply confined to generating excess traffic. So-called “bad” bots have a range of negative effects, from inadvertent inefficiencies due to poorly written code, to spam, malicious hacks, and high-volume Denial of Service (DDoS) attacks. According to the Anti-Phishing Working Group (report, Q1-Q3 2015), over one-third of all computers worldwide are infected with malware.
Various approaches to mitigating bot-traffic effects are possible. These include:
IP blocking
CAPTCHA (largely regarded as compromised)
Multi-parameter traffic fingerprinting
Bot honeytraps
From the point of view of performance practice and FEO, bots are an indirect consideration but one that should be considered when making recommendations regarding overall performance enhancement. Seek to quantify the extent of the problem and identify potential interventions. These are likely to depend upon the economics of the threat and existing relationships. They can range from specialist target solutions, security extensions to firewalls, value-added options from CDN or other performance vendors, to focused integrated traffic-management solutions.
Securing Gains with Ongoing Monitoring and KPI Definition
Ongoing monitoring and key performance indicators (KPIs) are important facets of a complete end-to-end approach to quality assurance in this area. Although outside the scope of this book, interested readers are referred to my extended treatment in The Art of Application Performance Testing by I. Molyneaux (O’Reilly); Appendix B.