
Chapter 2. Introduction to Quarkus
Before continuing with understanding Reactive, let’s take a few moments to learn more about Quarkus! So what is Quarkus?
Quarkus is a Kubernetes-Native Java stack. It has been tailored for Kubernetes, containers1 and the Cloud, but works perfectly well on bare metal and virtual machines. Quarkus applications require less memory and start faster than applications using traditionally frameworks. They also have the capability to be compiled into native executables, which make them consume even less memory and start instantly.
One exciting, and central, aspect of Quarkus is the reactive engine! When running in containers or virtualized environments, a reactive engine is essential to reducing memory and CPU consumption. The engine makes any Quarkus application efficient while also enabling the creation of reactive applications and systems.
In this section, we will see the main characteristics of Quarkus, how you can create an application, deploy it to Kubernetes, and create native builds. In a later chapter, Chapter 6, we will cover the reactive engine in detail and how to develop on Quarkus with a unified reactive and imperative programming model.
Java on the Cloud
Java is now 25 years old! Hard to imagine sometimes. From the era of 3-tier and client-server architecture, Java has evolved with many changes in architecture over the years. However, when a language is 25 years old, there will be pieces lingering that may not be suited to modern development.
What do we mean by that?
When the initial versions of Java came out, Clouds, Containers, Microservices, Serverless, and any other term associated with computing today was not imagined yet. There is no way we can expect the Java language created in the era of 3-tier and client-server architecture to perform as we need in containers today!
Yes, there have been many advancements over the years in Java, especially over the last couple of years with a new and faster release cadence. At the same time, Java prides itself on not breaking backward compatibility for developers and users. A large cost of that approach is Java still retains pieces within it that were conceived without the benefits and knowledge of containers and what they provide.
There are many applications where Java “as is” during the last 25 years will continue to work fine, and for many more years to come. However, over the last few years, with the explosion of microservices, and most recently the evolution to serverless, Java does not fit these deployment models naturally.
Only a few years ago Java’s suitability in containers became apparent for all as we found out Java ignored CGroups. For containers, this created a huge problem. Java was unable to see the amount of memory allocated to a container, only seeing the memory of the entire physical machine.
In an environment where each container needs to work within a constrained amount of memory, Java didn’t play nice. Java was very greedy. In addition, Java would create application threads based on the number of CPU cores. Causing many more threads to be allocated in a memory and CPU constrained container.
Is it a big deal?
You might get lucky with your Java applications deployed in containers, if deploying to a Kubernetes Node with other containers staying well within their memory limits. Then one day there’s a load spike, and with it the memory consumed by the Java Virtual Machine (JVM), then BOOM! Kubernetes kills the container for using too much memory.
This specific problem with Java and CGroups has been fixed since Java 10, and since Java Development Kit (JDK) 8u131 there are options available for enabling the same behavior. Check out the Java inside Docker article on the Red Hat Developer’s site by Rafael Benevides with all the details.
You might be thinking that Java should now be good in containers, or the Cloud, right? Though this fix is available, with an appropriate JDK version. There are many enterprises using JDK 8, or older, and quite possibly not using a JDK 8 with the flags available!
Java’s issues in the Cloud is more than CGroups alone.
Containers not being killed for grabbing more memory than the container expected is great. However, Java in containers raises concerns in the speed with which applications start receiving requests, and how much memory they consume while running. Neither of these are great for Java applications compared with other languages running in containers. Maybe, startup speed isn’t a concern for many applications running today, but it can impact microservices needing to scale quickly for large traffic spikes, or cold start time for serverless applications.
What do we mean by start receiving requests? While it’s common for frameworks used in building applications to log their startup time, it refers to the amount of time taken for a framework to start.
The time does not represent the time taken by an application before being able to begin to start receiving requests. This time is a critical indicator with containers and the Cloud! The time to start receiving requests can also be called time to first request. Whether a framework can start in half a second doesn’t mean much, if another 2-3 seconds passes before any traffic can be received and processed by the application. In such an example, it could be anywhere from 2.5 to 3.5 seconds before a new application instance can begin receiving user requests.
Granted, time to start receiving requests and memory consumption may not be a concern for a monolithic application with a few hundred, or even thousand, internal users. Monolithic applications can be developed with Quarkus, though the benefits we talk of for Quarkus will not be as prominent when developing monoliths. However, for microservices, and especially serverless, both these factors impact the costs of running a service, and the availability to users.
Important
Frameworks can often have very low startup times by delaying work until receiving the first request. The remainder of any startup tasks are performed before processing the first request. Lazy initialization is another name for this behavior, offering a false indication on when an application is really ready. The time to start receiving requests is the best measure of application startup time. Having a low time to first request is essential in serverless workload, as well as any kind of mechanism using a scale to zero approach, where the services are only started when needed. In more common architectures, such fast startup time reduces the recovery time after a crash.
How can we measure startup time?
There are many possible approaches,
including modification of endpoints to output a timestamp when they’re accessed.
To make our lives a bit simpler,
we’re going to use a Node.js script2 developed by John O’Hara from Red Hat.
The script takes the application start command, and the URL to access it,
starting the application in another process.
Waiting for the URL to return a 200,
meaning success,
before computing the time to first request.
Note
For ease of use, we included the contents of the GitHub repository (https://github.com/cescoffier/reactive-systems-in-java) along with the code
in the chapter-2/startup-measurement directory.
Ensure you have Node.js installed,
and run npm install request to install the script dependencies.
Right now you might think us talking about startup speed and memory consumption are very hand wavy discussions which are too subjective. We totally agree, which is why we’re now going to use a traditional Java EE stack, in this case Thorntail, to illustrate these concepts in practice. We chose Thorntail for the comparison as the first microservice framework from Red Hat, while Quarkus is the latest.
One last thing before we get coding and running applications! “Memory” can be a somewhat vague term, as there are many types of memory that could be meant.
When we’re talking about “memory”, we’re referring to Resident Set Size (RSS), and not the JVM heap size, as heap is only a part of the total memory a Java application consumes. When running an application on the JVM, the total allocated memory can include:
-
Heap space
-
Class metadata
-
Thread stacks
-
Compiled code
-
Garbage collection
RSS represents the amount of memory that a process is occupying from main memory, i.e. RAM. RSS includes all the memory that the JVM requires to run an application, providing a more accurate value for the amount of memory actually occupied. As we’re running a single application in a single JVM process, we can easily ensure we’re not measuring memory consumption of non application processes.
Note
All performance numbers are from our MacBook computer. As such, the results you see below may differ slightly based on particular hardware configuration. If you happen to have an Apple M1, you could see even better results!
Ok, time to run some code and see what we’re talking about with startup speed and memory consumption.
Thorntail example
We start by creating a traditional application with Thorntail to provide a comparison of the memory, or RSS, and time to first request metrics. For anyone not familiar with Thorntail, the project focused on the idea of a customizable WildFly. Only taking the bits you need for a specific application, and removing everything else. Though the Thorntail project is no longer maintained, sadly. The good news is Quarkus incorporates lots of ideas from Thorntail!
The Thorntail application requires a Java API for RESTful Web Services (JAX-RS) application, and a simple resource endpoint for us to make requests against. The Thorntail example needs a JAX-RS Application, and a JAX-RS Resource with a single method returning a greeting for an HTTP GET request. All the source for the Thorntail example can be found in the /chapter-2/thorntail-hello directory.
There’s nothing special about the classes, they’re the bare minimum we need to provide an HTTP endpoint with JAX-RS to make requests against.
Let’s build the Thorntail application and then start it:
Example 2-1. Build and run the Thorntail hello world application
> mvn verify
> java -jar target/thorntail-hello-world-thorntail.jar
Once the application has started,
hit the http://localhost:8080/hello endpoint with curl or a browser.
After you’ve made a few requests,
or more if you prefer,
it’s time to take a look at the RSS memory used by the process.
Accessing the endpoint before measuring RSS is important because
an application may not have loaded all classes during startup,
meaning we could see a misleading figure.
To be able to find out the memory used, we need the id of the process the Thorntail application is running in.
On Linux based systems, including Mac,
we can use ps -e | grep thorntail which lists all the active processes and restricts the results
to those containing “thorntail” in the name.
With the process id in hand,
we can now find out how much RSS the process is using:
Example 2-2. Measure the RSS usage of the Thorntail application
> ps -o pid,rss,command -p 4529 | awk '{$2=int($2/1024)"M";}{ print;}'

PID   RSS COMMAND
4529 441M java -jar target/thorntail-hello-world-thorntail.jar
PID RSS COMMAND
4529 441M java -jar target/thorntail-hello-world-thorntail.jarpsretrieves the RSS and command, andawkconverts the RSS value to Megabytes.
You will see something like the above terminal output, showing the process id, RSS converted to Megabytes (M) and the command. Full details on how to find RSS for a process can be found on the Quarkus website3.
We can see a “Hello World” style application with a single endpoint returning a string uses 441 Megabytes (MB). Woah! That’s a lot of memory for a single JAX-RS endpoint returning a fixed string!
We should caution we’re running these tests on OpenJDK 11 without any customization for limiting how much memory the JVM captures, or any other tuning available to the JVM. We can limit what the JVM is able to grab and see how that affects the overall RSS:
Example 2-3. Start the Thorntail application to configure the heap size
> java -Xmx48m -XX:MinHeapFreeRatio=10 -XX:MaxHeapFreeRatio=20
    -jar target/thorntail-hello-world-thorntail.jar
Now we get:
Example 2-4. Measure the RSS usage
> ps -o pid,rss,command -p 5433 | awk '{$2=int($2/1024)"M";}{ print;}'
PID   RSS COMMAND
5433 265M java -Xmx48m -XX:MinHeapFreeRatio=10 -XX:MaxHeapFreeRatio=20
    -jar target/thorntail-hello-world-thorntail.jar
That dropped the memory usage down to 265 MB! That saved nearly 200 MB of RSS by limiting the amount of heap the JVM grabbed to 48 MB. Maybe 48 MB isn’t quite the “sweet spot” in terms of throughput, but that’s something to verify with your own applications to find the balance between reduced memory consumption and increased throughput.
We’ve shown the RSS usage, now we need to calculate the time to first request. Ensure all previous instances of the Thorntail application are stopped before continuing. Let’s check out time to first request!
Example 2-5. Measure the time to first request of the Thorntail application
> node time.js "java
    -jar [fullPathToDir]/thorntail-hello/target/thorntail-hello-world-thorntail.jar"
    "http://localhost:8080/hello"
We see a bunch of 404’s fly past in the console until the application returns a 200 response,
and then we see the time taken.
In our case it was 6810 ms!
That’s not exactly fast in the world of microservices and serverless.
You can run it a few times to see if the time varies much,
or not really at all.
With a 7-second startup time,
scaling microservices can’t meet traffic spikes quick enough, causing user delays and possibly errors.
From a serverless perspective,
we’re even worse off as we’d expect a serverless function to be started, run, and stopped well before 7 seconds elapsed.
Note
The time to first request captured with time.js may be fractionally longer than it actually is,
as a very small amount of time will be included as the child process spawns but before the JVM starts.
We’re not too worried about such a small amount,
as the impact applies to each runtime we test in the same manner.
So, we’ve seen what a “traditional” application consumes for RSS, and how long it can take to reach time to first request. Now it’s time to see how Quarkus compares!
Quarkus example
We’re going to create an identical “Hello World” endpoint, though it doesn’t say “Hello from Thorntail!”. With Quarkus, we don’t need the JAX-RS4: application class, we only need the JAX-RS resource which has the same content as the Thorntail version, except for the message. The source for the Quarkus example can be found in the /chapter-2/quarkus-hello directory.
In section “Create your first Quarkus application” we will cover how to create a Quarkus application.
Now build and run it:
Example 2-6. Build and start the Quarkus hello world application
> mvn verify
> java -jar target/quarkus-hello-world-1.0-SNAPSHOT-runner.jar
As with Thorntail, we’re not optimizing the JVM to see what raw RSS usage we see. Hit http://localhost:8080/hello a few times as we did with Thorntail. Hopefully you’re seeing a message saying “Hello from Quarkus!”, otherwise you’re still running the Thorntail application!
Go find the process id for the Quarkus application and check out the RSS:
Example 2-7. Measure the RSS usage of the Quarkus hello world application
> ps -o pid,rss,command -p 6439 | awk '{$2=int($2/1024)"M";}{ print;}'
PID    0M COMMAND
6439 133M java -jar target/quarkus-hello-world-1.0-SNAPSHOT-runner.jar
Here we see Quarkus using 133 MB of RSS, over 300 MB less than the 441 MB with Thorntail! That’s an astonishing improvement for what is essentially the same application.
If we limit the maximum heap size to 48 MB, as we did for Thorntail, how much of an improvement do we get? Don’t forget to use the endpoint once started!
Example 2-8. Constrain the heap usage of the Quarkus application and measure the RSS usage
> java -Xmx48m -XX:MinHeapFreeRatio=10 -XX:MaxHeapFreeRatio=20
    -jar target/quarkus-hello-world-1.0-SNAPSHOT-runner.jar
> ps -o pid,rss,command -p 7194 | awk '{$2=int($2/1024)"M";}{ print;}'
PID    0M COMMAND
7194 114M java -Xmx48m -XX:MinHeapFreeRatio=10 -XX:MaxHeapFreeRatio=20
    -jar target/quarkus-hello-world-1.0-SNAPSHOT-runner.jar
That got it down to 114 MB, but let’s see how far we can push Quarkus into smaller heap sizes! Once again, don’t forget to use the endpoint once started!
Example 2-9. Constrain even more the heap usage of the Quarkus application and measure the RSS usage
> java -Xmx24m -XX:MinHeapFreeRatio=10 -XX:MaxHeapFreeRatio=20
    -jar target/quarkus-hello-world-1.0-SNAPSHOT-runner.jar
> ps -o pid,rss,command -p 19981 | awk '{$2=int($2/1024)"M";}{ print;}'
PID    0M COMMAND
19981 98M java -Xmx24m -XX:MinHeapFreeRatio=10 -XX:MaxHeapFreeRatio=20
    -jar target/quarkus-hello-world-1.0-SNAPSHOT-runner.jar
With a max heap of 24 MB, we’re down to 98 MB of RSS! More importantly, the application still works! See how low you can reduce the maximum heap to before Quarkus is unable to start. Though for regular applications, and even microservices, you wouldn’t be setting the maximum heap so low, being able to set it this low is critical for serverless environments.
Small heap and Performances
Setting the heap size to a very low value may penalize the performance of the application, especially if the application does a lot of allocations. So, do not seek for the smallest value as possible, but verify the value according to your expected performance and deployment density gain. Note that the Quarkus architecture tries to avoid have such a penalty, however, we highly recommend you to check with your application.
Time for startup speed!
Example 2-10. Measure the time to first request for the Quarkus application
> node time.js "java
    -jar [fullPathToDir]/quarkus-hello/target/quarkus-hello-world-1.0-SNAPSHOT-runner.jar"
    "http://localhost:8080/hello"
If your hardware is similar to ours, you should see a time to first request of around 1001 ms! That’s nearly seven times faster than the “traditional” application!
All this is really great, but what’s the point? Recalling from earlier in the section we talked about Java in containers, let’s see the impact when running in containers. Assuming we have a node with 2 GB of RAM available, how many containers of each application can fit?

Figure 2-1. Java memory in containers - Quarkus allows increasing the deployment density.
Container density is a key characteristic of Cloud deployments with Kubernetes. Given a specific node size, such as 2 GB of RAM, the more containers that can run in that single node, the greater container density we can provide. Improving container density enables better utilization of the resources available. From the example in Figure 2-1, will more throughput be achieved with four instances or fourteen! If each of the fourteen containers support less throughput, or requests per second, compared with one of the traditional containers, it doesn’t matter. A minor reduction in throughput in a container is more than offset by supporting fourteen containers instead of four.
Container density is an important metric in determining the number of instances that are required. What a developer needs to determine is their expected, or desired, throughput to be supported. Maybe less containers with larger memory requirements are fine for today’s needs, but keep in mind things change and you could easily need more than four to support your users!
We’ve now seen the amount of RSS memory and time to first request with “traditional” applications on the JVM, and how Quarkus can significantly reduce these aspects for an application.
Quarkus wants to tackle the challenge of improving Java in containers with a new approach. This approach improves the startup speed and the memory consumption of Java in a container.
The next section will explain the details of how Quarkus makes this possible, and more importantly, how it differs from a traditional framework approach.
The Quarkus Way
We’re sure you want to know all the intricate details of how Quarkus starts faster and consumes less memory than a traditional framework, right?!
We need to slow down a bit first, by explaining how traditional frameworks work to have an understanding of what changes with Quarkus.
Some well known features of traditional frameworks include (Figure 2-2):
-
Annotations within code defining expected behavior, with many examples of this we’ve all used over the years. Typical ones include
@Entity,@Autowired,@Inject, and many, many more! -
Configuration files of various kinds. These files do everything from defining how classes should be wired together to configuring persistence data sources, and everything in between.
-
Classes used only during the startup for creating runtime metadata and classes for the application to function.
-
Utilizing reflection in determining methods to invoke, setting values into objects, and dynamically loading classes by name only.

Figure 2-2. The Quarkus Way
We’re certainly not saying that Quarkus doesn’t have annotations, configuration files, or any other features of traditional frameworks. We are saying Quarkus handles them in a very different manner.
Why would these features of traditional frameworks be considered “bad”? That’s a good question, and the answer requires some understanding of how these frameworks handle the above features.
When there’s any type of configuration to be parsed or annotations to be discovered, framework classes are required to perform this work. Depending on how complex the process might be, anywhere from dozens to hundreds of classes could be needed to perform the task. In addition, each of these classes would typically be holding state within themselves representing intermediate states as startup occurs, or a final desired state after everything is processed.
There’s nothing particularly special about this, frameworks have worked this way for years, decades even. What you may not realize though is any classes used to perform these startup tasks are still present, even if the JVM process has been running for six months without a restart! While any memory those classes grabbed should be eventually garbage collected, provided the classes properly released their hold on the memory when work was complete, the class metadata for them is still present in the JVM, even on the latest Java versions. It may not seem like much, but a couple of hundred classes that are no longer needed can impact the amount of memory required by the JVM.
This problem impacts all JVMs today, without special handling by a framework. All the classes used during startup, and never again, can only be garbage collected by the JVM if all objects of the class can be garbage collected, all references to the class are removed, and most importantly, all other classes in the same classloader are also no longer referenced. To facilitate the garbage collection of startup classes, a framework would need to utilize a classloader for startup classes, and another classloader for runtime classes. It can be difficult to enable garbage collection for startup classes when thread pools are used, especially the ForkJoin pool, and when Thread Local variables are set during startup.
Why should we retain classes in JVM memory if they will never be used again?! Ideally we shouldn’t, as it’s wasteful. This is where Quarkus shines.
Quarkus’ extensions are designed and built to separate the various pieces of the traditional framework startup processing into smaller chunks of work. Doing this enables the build process, with Maven or Gradle, to take advantage of those smaller chunks and execute them during build, instead of waiting until runtime start. Utilizing startup classes during build time means those classes don’t need to be included in the JVM at runtime! Saving us memory and startup time.
How does it help to do this at build time, where does the output go that’s needed during runtime?!
Extensions use byte code recorders to do everything from setting static values on classes for runtime, to creating new classes to hold metadata that’s needed for runtime. What do we mean by that? Earlier when we talked about frameworks doing a lot of work during startup, Quarkus is able to create the output of that work during build time and write byte code equating to the same result as with traditional frameworks at startup. At runtime instead of performing the startup work, the JVM loads the class written by a Quarkus extension into memory as if all that startup work just happened. Without the cost of the memory and classes to do the work.
Looking at some steps a traditional framework performs at startup, we can see how Quarkus does it differently in Figure 2-3.

Figure 2-3. Framework startup phases in Traditional Frameworks vs Quarkus
While Quarkus reads the configuration at build time, some properties, such as locations and credentials are still configured and read at runtime. However, everything application-centric that can be decided at build time is handled during the build process.
So far we’ve been using “build time” to describe when Quarkus completes these typically startup related tasks, but there is another term. The term is Ahead of Time (AOT) compilation.
Having explained how Quarkus differs from traditional frameworks in how it approaches optimizing your application code and dependencies. Yes, this approach reduces the variability that is generally handled at runtime. However, modern workloads deployed in the Cloud or in containers do not need such variability, almost everything is known at build time.
We hope you now have a clearer understanding of what Quarkus offers with this innovative approach, and why it is bringing excitement to Java development in the Cloud again.
Create your first Quarkus application
There are quite a few different ways to create a Quarkus application for the first time.
-
Manually creating the project
pom.xmlorbuild.gradlefile, adding Quarkus dependencies, setting up and configuring the plugins, and defining the source folders. Pretty messy and tedious in our view! -
Using Maven and the Quarkus plugin in a terminal to construct the project skeleton.
-
Browsing to https://code.quarkus.io/ and selecting the dependencies that are needed. This is the simplest, and quickest, for getting started, which is why we will use this method.
Time to dive into creating a project! Head over to https://code.quarkus.io/, and you will be presented with the following page:
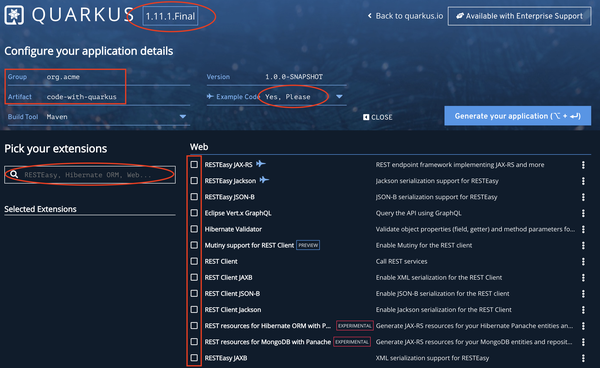
Figure 2-4. Quarkus project generation
In Figure 2-4 we’ve circled some key parts of the webpage to explain them in detail. At the very top of the page is the Quarkus version of the generated project. Just below it to the left you are able to customize the group and artifact names that will be set for the project. These can be changed later if desired as well, you’re not stuck with org.acme if you forget to customize it.
To the right, users can decide whether they want example code added to the project or not. The default is yes, so if you select any extensions with the plane logo, such as RESTEasy JAX-RS, example code for that extension will be generated for the project. Below it are the list of all available extensions of Quarkus. There’s a lot of available extensions, the screenshot only shows the ones that would fit on a single page! Use the checkbox to select specific extensions to include in your project.
Lastly, if you don’t want to scroll through all the extensions, start typing terms into the search box to the left. As you type, the list of extensions on the right will filter, only showing the extensions matching your search criteria. As extensions are selected, they appear under the Selected Extensions area below the search box.
Figure 2-5 shows how it looks when we’re about to generate the application.

Figure 2-5. Quarkus project generation
You can see we’ve chosen not to generate any example code, and the RESTEasy JAX-RS extension is selected. We’re sticking with plain JAX-RS for now. We will explore a more Reactive JAX-RS in Chapter 8.
As we hover over Generate your application, we can decide to download the project as a zip or publish it to a GitHub repository. Right now we will download as a zip. The zip will be automatically downloaded, with a name matching the artifact name. Once the download is finished, extract the zip to a directory.
With that done, we open a terminal window and change to the directory where the generated project was extracted. Let’s dive into using Live reload and experience real Developer Joy!
Example 2-11. Run the application in dev mode
> mvn quarkus:dev
The above command starts Quarkus in Live reload, enabling us to quickly iterate with code and instantly see the impact. A successful start will have the terminal output:
Example 2-12. Output the Quarkus application
__  ____  __  _____   ___  __ ____  ______
 --/ __ / / / / _ | / _ / //_/ / / / __/
 -/ /_/ / /_/ / __ |/ , _/ ,< / /_/ /
--\___\_\____/_/ |_/_/|_/_/|_|\____/___/
INFO  [io.quarkus] (Quarkus Main Thread) code-with-quarkus 1.0.0-SNAPSHOT on JVM
    (powered by Quarkus 1.11.1.Final) started in 0.937s.
    Listening on: http://localhost:8080
INFO  [io.quarkus] (Quarkus Main Thread) Profile dev activated. Live Coding activated.
INFO  [io.quarkus] (Quarkus Main Thread) Installed features: [cdi]
We’re off and running. Open http://localhost:8080 in a browser, and you will see Resource not found. Oh, no! What went wrong?
Actually, nothing went wrong.
Eagle-eyed readers might have noticed the startup log only listed cdi as an installed feature.
What about RESTEasy, we selected the extension for it when creating the project?
Have a look inside pom.xml, and you will see the dependencies:
Example 2-13. Quarkus extension dependencies of generated project (chapter-2/code-with-quarkus/pom.xml)
<dependency>
  <groupId>io.quarkus</groupId>
  <artifactId>quarkus-resteasy</artifactId>
</dependency>
<dependency>
  <groupId>io.quarkus</groupId>
  <artifactId>quarkus-arc</artifactId>
</dependency>
<dependency>
  <groupId>io.quarkus</groupId>
  <artifactId>quarkus-junit5</artifactId>
  <scope>test</scope>
</dependency>
RESTEasy is definitely there as a dependency, so what’s going on?! During the build process Quarkus recognized there wasn’t actually any code present utilizing RESTEasy, making the feature uninstalled and available for removal to save memory! Let’s fix that now.
With Quarkus still running,
create the org.acme package within /src/main/java.
Now create a class named MyResource within the package and the following content:
Example 2-14. JAX-RS MyResource (chapter-2/code-with-quarkus/src/main/java/org/acme/MyResource.java)
import javax.ws.rs.GET;
import javax.ws.rs.Path;
import javax.ws.rs.Produces;
import javax.ws.rs.core.MediaType;

@Path("/")
@Produces({MediaType.TEXT_PLAIN})
public class MyResource {
  @GET
  public String message() {
    return "Hi";
  }
}
Note
You may wonder why in the previous snippet none of the import are Quarkus specific.
Quarkus provides a cohesive full-stack framework by leveraging a growing list of over fifty best-of-breed libraries.
In the previous example, we use JAX-RS a simple but efficient and flexible approach to build HTTP and REST APIs.
Refresh http://localhost:8080. Wow, we now see Hi in the browser, what happened? Take a look in the terminal window:
Example 2-15. Automatic restart of the application after a code change
INFO  [io.qua.dep.dev.RuntimeUpdatesProcessor] (vert.x-worker-thread-7)
    Changed source files detected, recompiling
    [{pathToProject}/code-with-quarkus/src/main/java/org/acme/MyResource.java]
INFO  [io.quarkus] (Quarkus Main Thread) code-with-quarkus stopped in 0.037s
__  ____  __  _____   ___  __ ____  ______
 --/ __ / / / / _ | / _ / //_/ / / / __/
 -/ /_/ / /_/ / __ |/ , _/ ,< / /_/ /
--\___\_\____/_/ |_/_/|_/_/|_|\____/___/
INFO  [io.quarkus] (Quarkus Main Thread) code-with-quarkus 1.0.0-SNAPSHOT on JVM
    (powered by Quarkus 1.11.1.Final) started in 0.195s.
    Listening on: http://localhost:8080
INFO  [io.quarkus] (Quarkus Main Thread) Profile dev activated. Live Coding activated.
INFO  [io.quarkus] (Quarkus Main Thread) Installed features: [cdi, resteasy]
INFO  [io.qua.dep.dev.RuntimeUpdatesProcessor] (vert.x-worker-thread-7)
    Hot replace total time: 0.291s
We can see Quarkus noticed modifications to MyResource.java, stopped, and then restarted itself. Looking at the installed features, we see it now includes resteasy. How cool is that? Even better, the server stopped and restarted in just over 300 ms.
Why don’t we explore Live reload some more to have a better feel of the real Developer Joy!
With mvn quarkus:dev still running,
open http://localhost:8080/welcome in a browser.
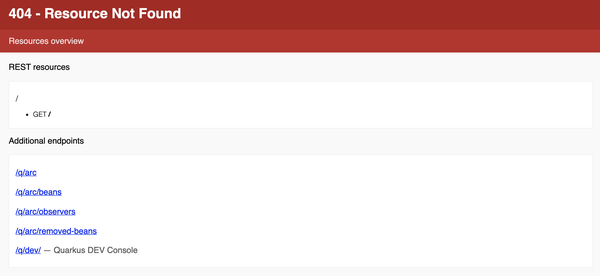
Figure 2-6. Resource not found
We got an error. Oh no!
Don’t fear too much, we did expect it because we don’t have anything to respond to the /welcome endpoint yet. However, Quarkus offered us some links to help diagnose the problem based on what it knows about the application. In Figure 2-6 we are shown the list of valid endpoints, in this case there is only an HTTP GET on /. Under Additional endpoints, there are endpoints to assist while developing applications. In this case Figure 2-6 has endpoints related to Arc, which is the bean container based on CDI for Quarkus, as well as a link to the developer console. Clicking on the developer console link will bring you to its main page (Figure 2-7).

Figure 2-7. Quarkus Dev console
There isn’t a lot there now, but we need to remember the only extension we’ve added is RESTEasy. As we enhance an application with more extensions, more options and abilities will be available from the developer console.
We went down a side track there, let’s get back to resolving our failed page load! With the /welcome page open to the failure in the browser, go back to the source and create a new class called WelcomeResource:
Example 2-16. JAX-RS WelcomeResource (chapter-2/code-with-quarkus/src/main/java/org/acme/WelcomeResource.java)
@Path("/welcome")
public class WelcomeResource {
  @GET
  public String welcomeMessage() {
    return "Welcome to Quarkus!";
  }
}
With the class written, head back to the browser and click refresh.
Triggering an HTTP request causes Quarkus to check if any files were modified since the last request,
as we’re running with Live reload.
Quarkus notices the presence of WelcomeResource,
compiles it, and then restarts the server.
If you’re like us, you may not have realized everything happening behind the scenes because the browser
gave the expected response without much delay!
Are you exhausted yet? We are!
That was a lot of information on creating a Quarkus project for the first time with https://code.quarkus.io/, and experiencing the ease of development Live reload with Quarkus brings! It does have drawbacks, less chance to get a coffee during a compile and restart! We will continue to explore everything Live reload can do as we work through the chapters, but take it for a spin yourself adding new extensions and seeing what can be done without stopping it!
Kubernetes with Quarkus in 10 minutes
In the previous section we had lots of fun changing code and seeing the application update on the fly as we did it. We hope you had fun, we know we did!
While that’s great for developing the code, can we use Live coding in production? Well, maybe you could, but we really don’t think you want to do that!
For deploying to production we want to use immutable containers, which requires container orchestration, which for most means Kubernetes! “The new kids on the block: Cloud-Native and Kubernetes-Native applications” will cover cloud-native and Kubernetes in further detail.
Why is Quarkus great for the Cloud, and in particular Kubernetes? Quarkus applications are designed to run efficiently in containers and have built-in health checks and monitoring capabilities. It also provides a great user experience including the ability to deploy in a Kubernetes cluster in a single command, without having to write Kubernetes resource descriptors.
Kubernetes introduces its own specific jargon, which may be confusing. This section also introduces the main concepts.
What are the steps to take our Quarkus application from the previous section and deploy it to Kubernetes? Let’s extend the application we generated in the previous section!
First thing we do is add the extension for Kubernetes to our application:
Example 2-17. Kubernetes extension dependency (chapter-2/code-with-quarkus/pom.xml)
<dependency>
  <groupId>io.quarkus</groupId>
  <artifactId>quarkus-kubernetes</artifactId>
</dependency>
With this new dependency, the build can generate the necessary resource files for deploying the application to Kubernetes, but also enable us to deploy the application as well. What a time saver! Let’s see how it works!
Before we can see how it works, we need to choose the preferred containerization mechanism. With Quarkus, we can choose between Docker, Jib, and S2I. We will choose Jib as all dependencies are cached in a layer separate to the application, making subsequent container builds much faster. Let’s add the Jib container dependency:
Example 2-18. Jib container extension dependency (chapter-2/code-with-quarkus/pom.xml)
<dependency>
  <groupId>io.quarkus</groupId>
  <artifactId>quarkus-container-image-jib</artifactId>
</dependency>
We’re nearly there! But first, we need a Kubernetes cluster! The easiest is to use minikube, but you can also use Docker Desktop, or MicroK8s. In this book, we will use minikube, as it’s one of the most straightforward solutions. Minikube is not a complete Kubernetes cluster, but provides enough features for us.
Follows the instructions from https://minikube.sigs.k8s.io/docs/start/ to download and install minikube.
With minikube installed, start it:
Example 2-19. Start minikube
> minikube start
The default configuration of minikube will be used unless we have specific configuration options set. Right now the default is fine, which is two CPUs and four GB RAM for a virtual machine. If it’s the first time being run, there will be a short delay while minikube downloads the necessary images.
Quarkus provides an additional extension for use with minikube to tailor the Kubernetes resources
specifically for minikube.
A big advantage to this approach is not requiring a Kubernetes Ingress to access services inside Kubernetes,
instead we can access them through a NodePort service.
This allows us to see localhost accessible URLs for our services when running minikube services list.
To activate it, we need another dependency:
Example 2-20. minikube extension dependency (chapter-2/code-with-quarkus/pom.xml)
<dependency>
  <groupId>io.quarkus</groupId>
  <artifactId>quarkus-minikube</artifactId>
</dependency>
Before deploying our application, let’s play a bit with Kubernetes to understand some concepts.
You can interact with Kubernetes clusters using the kubectl command:
Example 2-21. Retrieving the nodes
> kubectl get nodes
NAME       STATUS   ROLES    AGE     VERSION
minikube   Ready    master   2m45s   v1.18.3
The previous command prints the nodes managed by Kubernetes. You should not be surprised to see that we have a single node here, named master. That’s your machine, or virtual machine depending on your operating system.
Unlike other systems such as Docker, Kubernetes doesn’t run containers directly.
Instead, it wraps one or more containers into a higher-level structure called pods.
Pods are used as the unit of replication.
If your application is getting too many requests, and a single pod instance can’t carry the load, you can ask Kubernetes to instantiate new replicas.
Even when not under heavy load, it is a good idea to have multiple replicas of a pod to allow load balancing and fault-tolerance.
You can get the list of pods using kubectl get pods.
Example 2-22. Use the kubectl command to list the running pods
> kubectl get pods
No resources found in default namespace.
Not a big surprise, our cluster is empty.
In the section “Java on the Cloud”, we talked a lot about wanting to reduce the amount of memory for services written in Java within a container. To be able to determine that in minikube, we need to install an addon before deploying our service:
Example 2-23. Add the metric server to the minikube cluster
> minikube addons enable metrics-server
To create pods, we need a deployment. Deployments have two primary purposes:
-
indicate which containers need to run in the pod
-
how many instances of the pod should be running at a time
Generally, to create a deployment, you need:
-
A container image accessible to your Kubernetes cluster
-
A YAML document describing your deployment 5
Quarkus provides facilities to avoid having to create the image and write the deployment manually, such as the Kubernetes, minikube, and Jib container extensions we mentioned earlier.
With all the pieces in place, time for us to build and deploy the application to Kubernetes in minikube!
Open a terminal window and change to the directory of the project.
As we don’t want to run our own Docker daemon for building the containers,
we can run eval $(minikube -p minikube docker-env) to expose the Docker daemon from minikube to the local terminal environment.
Note
eval $(minikube -p minikube docker-env) must be run in every terminal window we use to access minikube.
Without it any Docker commands we execute will use the local Docker daemon,
which we don’t want.
Next we build and deploy the container:
Example 2-24. Deploy a Quarkus application to Kubernetes
> mvn verify -Dquarkus.kubernetes.deploy=true Package the application, create the container image, create the deployment descriptor and deploy it to our cluster
Execute the kubeclt get pods command to verify:
Example 2-25. List running pods with kubectl
> kubectl get pods
code-with-quarkus-66769bd48f-l65ff   1/1     Running   0          88s
Yeah! Our application is running!
Quarkus created a deployment for us:
Example 2-26. List the installed deployments
> kubectl get deployments
NAME               READY   UP-TO-DATE   AVAILABLE   AGE
code-with-quarkus  1/1     1            1           6m23s
You can check the created deployment in target/kubernetes/minikube.yml:
Example 2-27. The generated deployment
apiVersion: apps/v1 kind: Deployment metadata: # ... name: code-with-quarkus spec: replicas: 1imagePullPolicy: IfNotPresent name: code-with-quarkus ports: - containerPort: 8080 name: http protocol: TCP # ...
the number of replicas
the container image name
As you can see, it indicates the number of replicas and the set of containers running in the pod (here, a single one).
If you look carefully at the generated descriptor, you will see services:
apiVersion: v1
kind: Service
metadata:
  # ...
  name: code-with-quarkus
spec:
  ports:
  - name: http
    nodePort: 31995
    port: 8080
    targetPort: 8080
  selector:
    app.kubernetes.io/name: code-with-quarkus
    app.kubernetes.io/version: 1.0.0-SNAPSHOT
  type: NodePort
Random local port number we can access the service on.
A service is a channel of communication delegating to a set of pods (selected using labels).
In our example, the service is named code-with-quarkus.
This name can be used by other applications to discover the functionality we expose.
This service delegates the port 8080 on pods with matching labels (app.kubernetes.io/name and app.kubernetes.io/version).
The good news is that our pod is configured with these labels.
As a result, calling this code-with-quarkus on port 8080 delegates to the port 8080 of our container.
Note
Quarkus generates multiple descriptors.
The minikube.yml is tailored for minikube.
The kubernetes.yml is more generic.
The main difference is the type of service that gets created.
So, let’s invoke our service! We need to ask minikube to give us the service url:
Example 2-28. Retrieve the service url
> minikube service code-with-quarkus --url

?  Starting tunnel for service code-with-quarkus.
|-----------|-------------------|-------------|------------------------|
| NAMESPACE |      NAME         | TARGET PORT |          URL           |
|-----------|-------------------|-------------|------------------------|
| default   | code-with-quarkus |             | http://127.0.0.1:31995 |
|-----------|-------------------|-------------|------------------------|
http://127.0.0.1:31995
❗  Because you are using a Docker driver on darwin, the terminal needs to be open to run it.
Open a browser and use the URL of the service to access it, or curl if you prefer. If deployment worked, we see “Hi” as a response on the root path. Add /welcome to see “Welcome to Quarkus!”.
We deployed a Quarkus service to Kubernetes!
We’ve verified our Quarkus service deployed and works as expected, but what about the memory situation?
Example 2-29. Measure resource usage using kubectl top
> kubectl top pods
NAME                                 CPU(cores)   MEMORY(bytes)
code-with-quarkus-66769bd48f-l65ff   1m           80Mi
Wow, only 80 MB is really nice and compact! That’s a large improvement over traditional frameworks in containers.
We’ve just seen how to take a Quarkus application and add the ability to deploy it to Kubernetes, or in this case to minikube. There are certainly some potential gotchas in defining the Kubernetes resources we need for deployment, but that’s why we use the Kubernetes extension with Quarkus to handle all that for us. We prefer not to hand code YAML or JSON, inadvertently making an error with indentation, and the deployment fail!
Going native
What does “Going native” mean?
We’re referring to an ability to build native executables for an environment. Many applications we use every day on our machines are native executables, meaning the code of the application was compiled down to low level instructions for a specific operating system, in our case Mac OS X.
Developing Java applications has always required the presence of a JVM for execution. However, the ability to build a native executable from Java code has recently been made possible with releases from the GraalVM project. In this section we explain how to utilize the GraalVM project with Quarkus to generate a native executable for your Java code!
Earlier in “The Quarkus Way” we discussed how Quarkus utilizes AOT to perform actions during build time instead of application start. Quarkus extensions achieve this by breaking down all the work into three separate phases:
- Augmentation
-
Build steps process descriptors, annotations, and augment the application classes by generating bytecode containing any required metadata. This phase is always executed within the build process on a JVM.
- Static initialization
-
Runs any steps intended to have their resulting output captured in bytecode. There are restrictions on what these steps can do, as they should not open ports for listening or start threads.
- Runtime initialization
-
These steps are run as part of the application’s main method during startup. What is performed here should be kept to a minimum to take the most advantage of AOT.
Static and runtime initialization both occur at startup when executing on a JVM. However, with native executable we have an extra benefit. With initialization separated into two phases, we’re able to perform static initialization during the native executable build process. This allows the output from the static initialization phase to be serialized directly into the native executable, allowing any classes used in this phase to be dropped from the native executable as they’re no longer needed. Providing benefits in native executable startup time and reduction in memory requirements.
As part of the native executable build process with GraalVM all execution paths are evaluated. Any classes, methods, or fields deemed to not be on the execution path are removed from the resulting native executable. This is why reflection, dynamic class loading, and other features of JVM usage are disallowed without special flags, because the goal is to not retain every piece of code within a native executable. If we were to attempt to build a native executable for the earlier Thorntail example, it would require flags to be set to allow reflection, dynamic class loading, and possibly others. The design of Thorntail is not suitable for a native executable build, whereas Quarkus has the goal of code reduction in mind from the beginning.
Let’s see what’s needed to actually build a native executable6.
Creating the project with https://code.quarkus.io means a Maven profile was already added to the project for us, here’s what it looks like:
Example 2-30. Native image generation Maven profile (chapter-2/code-with-quarkus/pom.xml)
<profile>
  <id>native</id>
  <activation>
    <property>
      <name>native</name>
    </property>
  </activation>
  <properties>
    <quarkus.package.type>native</quarkus.package.type>
  </properties>
</profile>
We now have the ability to build a native executable for Quarkus, but without GraalVM installed we won’t get very far! Check https://quarkus.io/guides/building-native-image for all the details on installing GraalVM for building native executables.
Once installed, let’s build a native executable:
Example 2-31. Compile a Quarkus application into a native executable
> mvn verify -Pnative
Unfortunately, building a native executable does take longer than usual JVM builds. For this reason we suggest not building a native executable regularly, and recommend doing these builds as part of a CI pipeline.
Running these builds is our new opportunity for coffee breaks!
Note
As the number of classes grows in an application, the longer a native executable build takes to complete. Due to the larger number of execution paths requiring evaluation.
With the native executable built,
we can run it with ./target/code-with-quarkus-1.0.0-SNAPSHOT-runner!
Relish in the speed with which it starts,
be sure to verify the two endpoints we created still work.
We’ve now built a native executable for our local environment, but unless we’re using a Linux operating system, our native executable won’t work inside a container! As native executables are specific to an operating system, we need to specially build one for use in a Linux container.
To build a native executable for containers, we need to utilize Docker. Once Docker is installed, ensure it’s started. As the current terminal has been switched to use the Docker daemon inside minikube, we need to open a new terminal, so we can use local Docker for a build. Navigate to the project directory and run:
Example 2-32. Compile a Quarkus application into a Linux 64 bits native executable
> mvn verify -Pnative -Dquarkus.native.container-build=true
What we’ve done is utilized our local Docker environment to build a native executable for a Linux operating system. If we tried to run the native executable, and our local operating system is not Linux, we see an error:
Example 2-33. Format error when we start an application not compiled for the host operating system
zsh: exec format error: ./target/code-with-quarkus-1.0.0-SNAPSHOT-runner
We need to go back to the previous terminal now, as we want to interact with the Docker daemon in minikube. Let’s run a Docker build inside minikube:
Example 2-34. Build a container running a Quarkus application compiled into a native executable
> docker build -f src/main/docker/Dockerfile.native
    -t <your_docker_username>/code-with-quarkus:1.0.0-SNAPSHOT .
Note
Don’t forget to replace <your_docker_username> with your local Docker username.
We now have a container available inside minikube, let’s create the application deployment!
Example 2-35. Deploy the Quarkus application into minikube
> kubectl apply -f target/kubernetes/minikube.yml
We used the minikube specific Kubernetes YAML from an earlier build to create the deployment.
This version creates the NodePort service we need to access it from our local environment,
but also modifies the imagePullPolicy of the container to IfNotPresent instead of Always.
This last change prevents minikube from trying to check for a newer container image from DockerHub,
which is good because it wouldn’t find one there!
With the deployment done,
grab the URL from minikube service list and test out the endpoints again.
Everything should be good, and we get the same messages as before.
Now for the interesting part!
Earlier we installed the metrics server into minikube to track memory utilization, time to see what our native executable looks like. Though we’ve made requests and the deployment is present, it can be a few minutes before the metrics are available, keep trying until they appear. We should see something similar to:
Example 2-36. Measure resource usages in Kubernetes
> kubectl top pods
NAME                                CPU(cores)   MEMORY(bytes)
code-with-quarkus-fd76c594b-48b98   0m           7Mi
That’s fantastic!
Only 7 MB of RAM used!
This is where the combination of Quarkus and native executable really shines. We can also check the logs of the pod to see how quickly the container started, we would expect it to be around 10-20 milliseconds.
Note
We made an attempt to build a native image for Thorntail to provide a comparison. However, we experienced issues in building a usable native image and were stopped by https://github.com/oracle/graal/issues/2724.
Conclusion
We’ve covered a great deal with Quarkus in a short amount of time, and there’s still plenty more to go through in the remainder of the book. Quarkus is a Kubernetes Native Java stack, focused on minimizing memory requirements with AOT, amping up the memory reduction even further when we want a native executable. With the Kubernetes and container extensions, Quarkus takes the hassle out of handwriting YAML deployment files, doing it all for us!
In this chapter, we learned:
-
the problems with Java in containers;
-
how Quarkus differs from traditional frameworks in moving runtime startup tasks to build time with AOT;
-
creating a Quarkus project with https://code.quarkus.io/;
-
how Kubernetes and minikube extensions are used to generate the required deployment configuration;
-
how to build a native executable for Quarkus with GraalVM;
-
how to use the Kubernetes extension to deploy Quarkus applications to a container environment.
In the next chapters, we will take a step back briefly to detail distributed systems, reactive systems, reactive programming, and how they relate to each other.
1 In this book, “container” refers to a form of operating system virtualization, not to JavaEE containers.
2 You can find the script to measure startup time on https://github.com/johnaohara/tools/tree/master/scripts/startup
3 Platform Specific Memory Reporting - https://quarkus.io/guides/performance-measure#platform-specific-memory-reporting
4 Quarkus offers multiple ways to implement HTTP endpoints. JAX-RS is one of them. You can also use controller classes using Spring MVC annotation, or reactive routes if you prefer more programmatic approaches.
5 YAML (Yet Another Markup Language) is the most used format to describe Kubernetes resources. You can find a gentle introduction on https://en.wikipedia.org/wiki/YAML.
6 GraalVM is not the first tool to build native executables from Java Code. Dalvik, Avian, gcj, and Excelsior JET predates GraalVM.