Chapter 4
Volatility
The most important part of trading options is to understand volatility. More often than not volatility, or ‘vol,’ is presented as a theoretical concept. If XYZ option does X, then what happens to Y? However, what you need to understand is that volatility is the most important part of recognizing a good trade. If you are able to fully understand the concept of movement (realized vol) and perceived movement (implied vol) you will be able to better distinguish a good trade from bad. In this chapter, I will discuss the zones in which the underlying and options trade. Additionally, I’ll talk about how each zone has its own characteristics, levels it trades within, and its general effects on the trader. If you need to brush up on volatility, see Appendix A.
Realized Volatility
The first key to understanding edge is to understand the movement in the underlying. Volatility is mean reverting, not just in how it trades in the long term, but how it trades in the near term. Thus, while long term vol has its mean, current volatility also has levels it will trade within in the near term. The near term can be one week, one month or one year. In order to simplify the process of understanding where volatility is in the near term, at Option Pit we have broken up the levels of current volatility into four main zones. Each zone represents a general level of realized volatility for the overall market for any individual stock. Zone 1 represents low realized volatility, zone 2 represents low volatility, zone 3 is long term mean volatility (remember that long term means tend to be higher than a normal VIX level, because VIX can go super high but has never settled below 8) to elevated volatility, and zone 4, high volatility. Each zone has its own characteristics and tendencies. Traders must understand each zone and the signs that the market is moving away from one zone to another.
Zone 1 Ultralow Volatility
One thing traders may easily fail to recognize is how often volatility is ultralow. The VIX has a range from a few occurrences below 10, to many occurrences in the 11s and 12s, to a few in the 60s and 70s. While the long term mean of the VIX might be 18 to 20, there are more occurrences of VIX in the 12s than there are in any other whole number. When VIX is 12, while it is ‘ultralow’, it is also common and not something that should scare a trader. Ultralow volatility happens for long periods of time and at a much greater rate than 25% of the time. Traders need to be used to these numbers. So, what are the characteristics and ranges of low volatility?
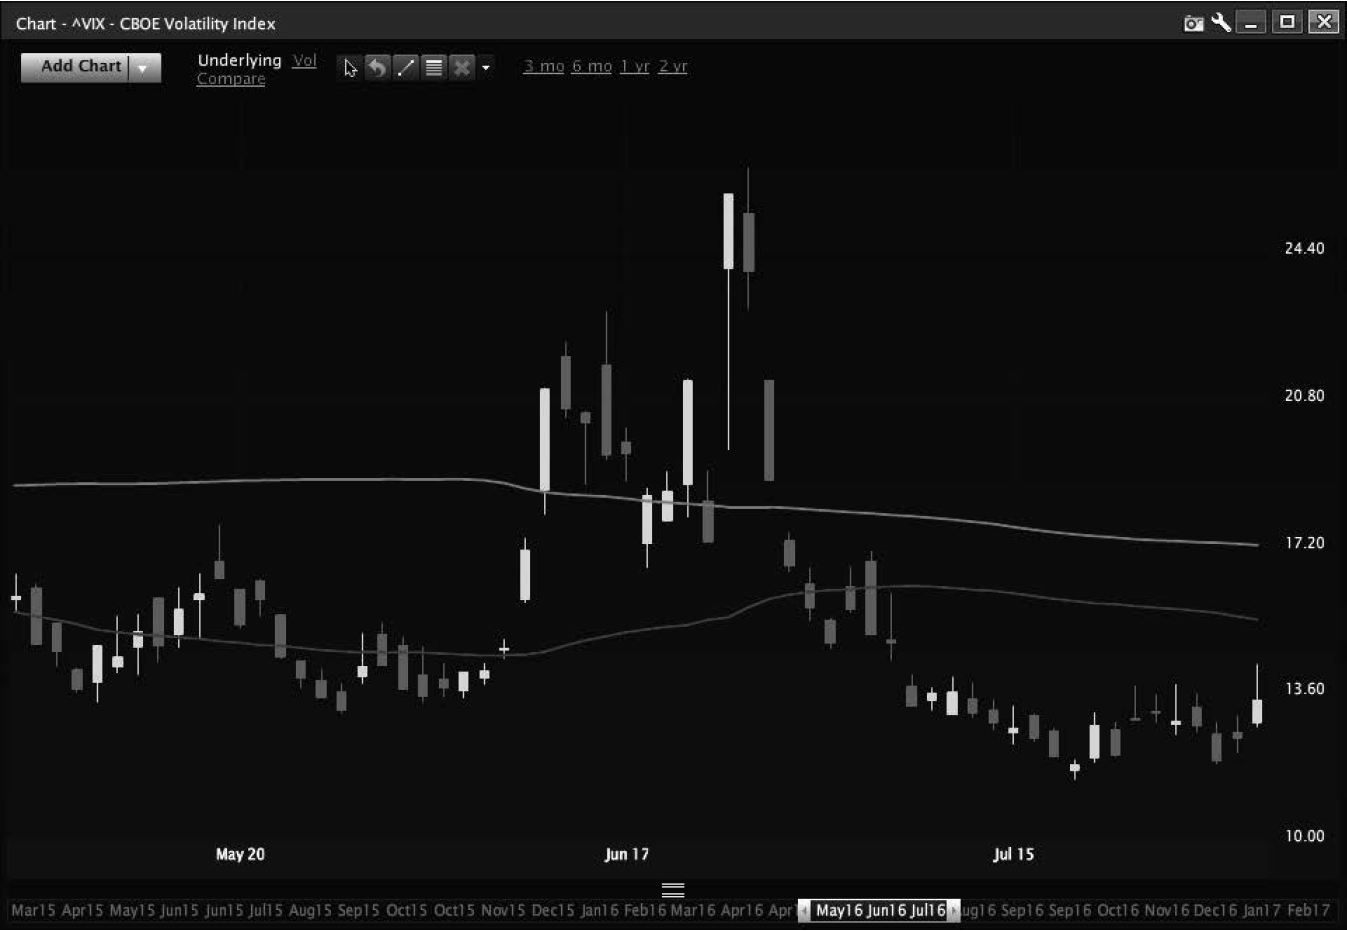
Low volatility is the bottom quartile of realized volatility in a stock; it will have serious dips that can approach a crawling pace of movement. In the S&P 500 this range is going to be realized volatility in the 13% or lower range. It may have small spurts where movement gets toward 15–16% but they will be points not trends. Figure 4.1 is a shot of movement in the SPX in a 4-month time span of 2014. You can clearly see that realized vol is in a tight, low range.

Low vol can be frustrating in that it doesn’t mean that every day is low movement. A market can have many days of little volatility intermixed with a dot of high volatility in the form of a single day move of 1–2%. That said, day to day analysis can be boring. When realized vol is low, those who have a plan that involves mass selling of options will probably win. This is because while realized volatility is low, implied volatility, assuming mean reversion, will be higher. For instance, a VIX of 12 usually occurs when realized volatility is between 8 and 10%, not when movement is 12. Those traders will have days where they get beaten badly, but they will also get many wins.
These times can be profitable and extremely dangerous, because they can cause traders to think they are smarter than they actually are. This is because when realized volatility is ultralow, option prices tend to be at their most overpriced. If realized volatility is 8 and implied volatility is 12, that is a huge premium in relative terms, and that creates a huge edge in points. Even at its peaks in this range, the times when there are ‘pops’ in movement, options sold at the bottom will be worth just slightly under where the market movement gravitated. Movement increasing from 8 to 12 or 13% has a huge buffer in options built in before the move happened.
Another issue for the trader in this zone is momentum. Volatility assumes that movement is ‘regardless of direction.’ Yet in low vol times, the market tends to have a direction . . . higher. For those that are not ‘dynamically hedging’ this can make producing income more difficult. While a strangle or iron condor is sold at too high a price regardless of direction or if the S&P or AAPL decide to move up or down in the same direction, at a slow pace, over and over again, even well-executed condor or strangle trading strategies can get beaten badly. This is because while the volatility sold was at a premium, the pure direction is likely to threaten the short call spread of the condor. The dollar collected selling a condor is going to quickly see the call spread expand to 2 or 3 bucks if you don’t monitor and manage the condor’s delta. For an overview of spreads and condors, see Chapter 7.
We will discuss IV in zone 1 and then techniques for trading zone 1 shortly, however we first need to understand when zone 1 is ending.
When Does Zone 1 End?
Zone 1 is the most common zone, so how does one recognize its end? The key is seeing the switch in movement. As ‘dots’ in movement become more common, this zone is ending. If you see an outlier dot once, not a big deal; twice in a 20-day period, not a big deal. It can even happen for a week and not be the end. When the market sees movement for more than a week or the market sees a three-standard-deviation move, followed by continued movement in the underlying above the top of zone 1, this can be a sign that things are changing. This is especially true if the movement was not driven by a one-off event. However, just be aware that, especially with zone 1, there will be many false signals. If it reverts back for a week or so, that can mean things are retracting back to normal levels. The dollars forgone, assuming that the market is leaving zone 1, relative to the dollars to be made assuming the market will revert back to zone 1’s mean, are often not worth it. If you believe that the market is leaving zone 1, even if it takes a month, trading zone 1 like it’s zone 2, despite the dollars forgone, will be worth it. A zone 1 trade gone wrong can be costly and take many months to recover if you do not actively manage risk. Zone 1 can create high profit for many months but you may give it all away in one month if you are slow to manage risk. If I am managing a trade to make 0.50 100 times, I am trying to make 5,000. If I let a spread expand to 3.00 before closing, I need to work for six months just to get back to even. This is why zone 1 needs to be aggressively managed.
Zone 2
Zone 2 is the second most common zone. It is what many consider a normal range of realized volatility. This zone is the second quartile in the index or stock’s range; in the SPX, this is movement in the 12–17% range. This movement is associated with uncertainty of current market conditions, but awareness of the current conditions that could cause the market to make a large move and volatility to increase. When what is unknown becomes known, that can result in zone 2. One common example is earnings season. During earnings season, there are no stock buybacks, and earnings can be particularly good or bad. Even in a long-term low vol cycle, during earnings season the market tends to enter zone 2. A common market entrant from 2008–2015 was Fed policy; every time changes in Fed policy threatened to occur, the market entered zone 2. We were in zone 2 for a chunk of 2015. See Figure 4.2 for a look at the characteristics of zone 2.

Zone 2 can be confusing because it can look so much like zones 1 and 3. When trading in zone 2, short premium trades can be highly effective as zone 2 tends to see volatility revert lower, not higher. A sale in zone 2 when the zone reverts back to zone 1 tends to make a lot of money. However, as the market enters zones away from zone 1, time becomes a factor. Additionally, you should understand that simple trades become trickier in zone 2 because of the potential for volatility to move higher. While most of the time, zone 2 will revert back to zone 1, it is not a sure thing. The times it doesn’t and vol moves to zone 3 and 4 (which we will discuss) are when traders can get caught and lose a lot of money if they do not manage risk properly or are to slow to see that volatility is not reverting back to zone 1.
Characteristics of Zone 2
Zone 2 can seem to present real opportunity to the option seller. This is because more often than not the market either stays in zone 2 or heads back to zone 1. However, if it stays in zone 2, there will be a problem for the trader used to trading in zone 1. Zone 2 shows up often, as a top for zone 1 or as a transition to zone 3 or 4. In zone 2, it is key to understand that the strangle or condor may seem expensive, but may actually be cheap given the movement to follow.
One advantage of zone 2 is that momentum becomes less of an issue over weeks of trading as opposed to a move that might occur in the first day or two. However, in zone 2 momentum can cause real pops in volatility and the market can have small moments that seem to be panic. Generally speaking, when vol is in zone 2 it is the price received on the trade that matters and directional price movement in the underlying becomes less of an issue. Yes, the market is moving around much more in zone 2, but the market is moving in one direction.
Zone 2 is quite possibly the best zone for the option seller. However, if you do not prepare for zone 3 or 4, you may set yourself up for an ending worse than the Sopranos. Zone 2 is interesting, since it can move to zone 3 or jump to zone 4.
Zone 3
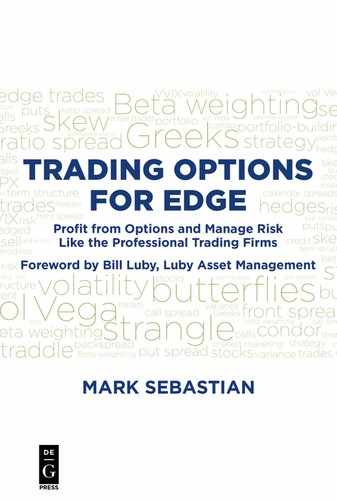
Zone 3 is in many ways like zone 2 in that it represents transition. While zone 3 occurs less often than zone 1 or 2, it is not uncommon. It can happen for a few weeks at a time due to non-US-based risks. Events that can create zone 3 are potentially systemic, but not quite there yet. See December 2014 and January 2015 in Figure 4.3. Note the divergence between the HV10 and HV20 lines, the widest on the chart; this was followed by fast convergence by the end, typical of rapid changes expected to occur during transitions.
Zone 3 is a time where vol is high, well above the long-term mean of volatility. It’s the point where things can fall off the rails, but . . . often vol just stops before that happens. It can represent levels where things could have gone wrong, but didn’t. That said, zone 3 represents the market’s recognition that there is real fear in the market. This is a time where the market might be really moving 1–1.5% and smaller moves are not the norm. I think the best word to describe this zone is transition. It’s a level that the market tends to hang around in when it’s transitioning from low to high vol or high to low vol. Zone 3 is also the level the market will move toward when there is a threat of a serious issue.
Zone 3 represents truly high vol somewhere above 22% in something like the SPX (as measure by VIX) and below market panic. Zone 3 can be seen most notably in January of 2016 when the VIX held in the 20s for a long time without a true panic sell-off.
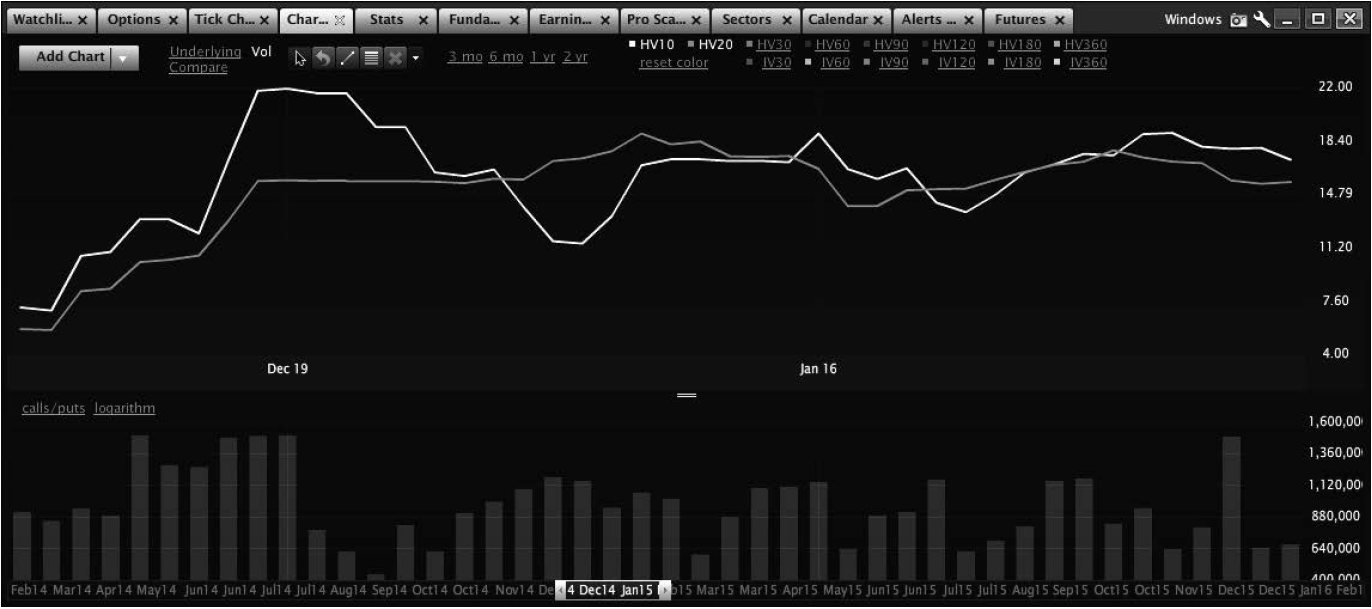
Figure 4.4 shows how realized vol can climb continuously. That climbing movement should produce a high VIX. One of the advantages of zone 3 is the huge premiums that can be received relative to where options prices have been in the past. In addition, the tendency of this zone is to head back to zone 2 and even zone 1 relatively quickly. Money can be made trading from the short premium side (selling options), assuming you do a good job of portfolio management (a subject we will delve into). Movement will be higher, but this is often where fear can top out. When that happens, options sales can be juicy as fear in the market is maxed out. IV maintains a huge premium over movement, but when movement dies, IV can completely collapse. Take a quick look at how IV tanked coming out of ‘Brexit’ in Figure 4.5.

In Figure 4.5, VIX fell from over 20 to below 15 in about a week. A massive move.
If you have been a premium seller and you’re getting beaten, this can be the level where you are tempted to roll out and increase size because premiums are so juicy. Generally speaking, selling premium wins, unless the market is entering a true volatility event.
However, it is also the time where the market truly spears traders. The market can move from zone 3 to zone 1 multiple times in a short period, as quickly as a week; and you can win nicely on those trades. If you short premium in this zone just once and it moves to zone 4, the trade may blow up. The description of this zone as a transition applies; when it does represent a transition, vol can completely explode, costing you serious dollars in the process.
One final note, if the SPX hits zone 3, it will take a minimum of 6 weeks to see zone 1 again.
Zone 4
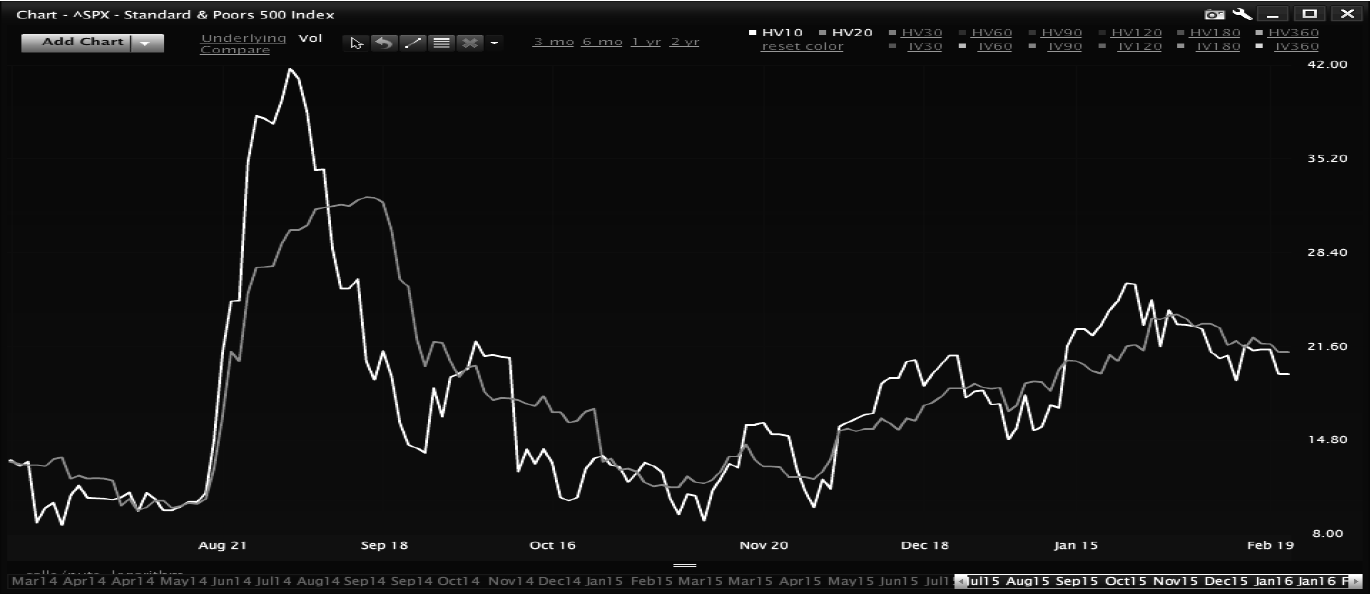
This is the panic zone. Zone 4 is the rare air that we seldom see. When we see zone 4, the market is in complete disarray. It can represent a 30% vol if the market has been trading in the low 10s, or more likely into the 40s or 50s if the market is coming from zone 3. This is when the market’s worst fears are realized. Lehman Brothers is going bankrupt, or the US is getting downgraded along with Europe having a crisis; most recently China looked like its financial markets were completely melting. You typically don’t know zone 4 is happening until you wake up in the morning and futures are down BIG. It typically represents being in zone 3 and seeing an opening gap in the S&P eclipsing 2%. It can lead to a flash crash in today’s algorithmic trading. We most recently saw zone 4 (as of the writing of this book) in August of 2015, for example (see Figure 4.6).
The issue with zone 4 is that volatility can go up and up and up. In 2008, the market entered zone 4 in August and did not leave zone 4 until April of the following year. The truth is that while it can seem profitable to sell premium in zone 4, it more often than not loses. This is because vol can keep going for a long time. In August 2015 selling premium worked out, it did in 2011 as well; it did not in 2008, to the point that it would have more than swallowed the returns made selling in 2011 and 2015 combined. As we state often, the key to vol is to buy high and sell higher.
So, when is it safe to sell vol in zone 4? When the market hits a new low after a vol spike and implied volatility (which we will discuss next) does not spike. Until then, zone 4 is the cash zone, meaning that one should take cash as a position rather than trying to be a hero and attempt to make a fortune. For the more seasoned trader it is a surgical strike zone; there are opportunities to be long vol premium and short vol premium but only in brief stints.
The properly managed portfolio will do well if zone 4 occurs; for the average retail trader, zone 4 typically leads to a major haircut on profits.
Implied Volatility
Implied volatility and realized volatility are very similar. We are going to touch on IV over and over again. For now, we are going to discuss the small differences between the zones when it comes to IV and HV.
The two concepts are sisters. Sometimes realized vol leads implied volatility, other times implied volatility leads realized volatility. Recall that implied volatility is the market’s interpretation of what is expected to happen between the day of the trade and the options expiration. It has the same zones as realized volatility, but they can happen at different times and represent different market events. More so than realized vol, implied vol is the market’s interpretation of the threats of zone 3 and zone 4 than it is the actual occurrences of those zones. Basically, the fear of underlying movement entering zone 4 can cause zone 3 or 4 to occur in implied volatility terms without zone 3 or 4 type of movement actually happening. Here I’ll quickly discuss the zones associated with implied volatility. Zone 1–4 represent the same zones, it’s just the causes that change.
Zone 1
Similar to realized vol, zone 1 with implied volatility represents ultra-low volatility and it can stay there for a long time. The main difference is how implied volatility moves in and out of zone 1. Typically zone 1 will be led by implied volatility both in and out. With the S&P 500, zone 1 is below 14 in the VIX. When the market has been moving around, before realized vol measures recognize movement is stopping, implied volatility typically starts to fall. When the market starts to move around, implied volatility will start to move out of zone 1 before the underlying. IV is often described as a leading indicator. IV, especially in indexes, has been described as a lagging indicator. The fact is that it is both: IV can lead, as it often does in zone 1, or it can lag as it tends to do once it enters the other zones.
With zone 1, the extremes in implied volatility will be less than the extremes in realized vol. When RV gets to 5, IV might get to 10 or 11%. On the other end, there may be periods where realized vol gets higher quickly, but implied volatility stays somewhat near where it was before the move.
Zone 2
Zone 2 is normal and exhibits standard levels of volatility; it represents a VIX in the 14–18% range. If you look at the occurrences of implied volatility, it will land between 12–16 more often than in any other range, see Figure 4.7.
This is the meat of the market and unlike RV, where zone 1 is possibly the most common zone, in implied volatility, zone 2 is going to be the most common area in which the options market hangs. Implied volatility in zone 2 tends to be above RV and, when movement increases, zone 2 is where implied volatility is most likely to be slow to react. Within zone 2 the market typically acts normally. The S&P 500 will be generally rallying, there may be blips of volatility, but the market is moving higher. Zone 2 will have the bull market highs in volatility. When there is a Fed meeting, the high end of Zone 2 is likely to be reached. Zone 2 is where the market moves ahead of non-farm payroll reports. Within individual equities, there may be some earnings reports, especially in lower vol stocks. To learn zone 2, follow the VIX during the bulk of 2012 and 2014.

What makes zone 2 different is that unlike realized volatility which can hang in zone 1 for a long time, even when realized volatility is in zone 1, implied can hang at the low end of zone 2 rather than dipping into zone 1. It takes an extremely long period of time to pull IV into zone 1. Thus, even if realized volatility is 8, 9, or 10%, implied volatility might stay above 14%. When IV is in this bottom range of zone 2 it can stay there for a longer period of time even if RV starts to move. And once IV moves within zone 2 it tends to stay in zone 2 for too long and then quickly move back.
Traders should plan to do the bulk of their trading within this IV zone 2 and then expect to see RV in zone 1 and zone 2. However, be aware that zone 2 in both realized and implied vol invites a recency bias, the belief that things will go back from whence they came. Traders that trade zone 2 think IV is going to be in this zone forever; it won’t.
Zone 3
Zone 3 represents elevated volatility in the VIX, generally at 18–23, but can be as high as 28 or 30. Zone 3 is when the market goes through a short period of fear but has not hit the panic zone. Zone 3 occurs less often than zone 1 and zone 2, but it can happen quickly. Typically, unlike zone 1 and 2, it happens simultaneously with market movement. When the market starts having multiple 1% daily moves, it is getting into zone 3, and IV will quickly catch up to RV. IV can spike into zone 3 with movement of the underlying (realized volatility) meeting it, most notably the fiscal cliff in 2012. In 2012, IV got to 28% in the VIX and movement never came close. Zone 3 can be scary, but presents some high IV that can give you a chance to sell market premium, if you are positioned properly. On the other hand, when IVs get to zone 3 they can expand . . . for a long time.
Zone 3 in RV is somewhat rare in a bull market; however, it does happen in short spurts. It happened in 2012 ahead of the fiscal cliff, and it happened during 2014 a few times. In a bear market, zone 3 becomes much more common. The SPX will spend months in zone 3 with blips of zone 4. The good news is that you can see zone 4 coming in a zone 3 situation in a bear market. Looking at bull and bear, zone 3 is when markets tend to transition to serious volatility.
In zone 3, be prepared to sell premium, but be prepared to hedge and to leave money on the table. Traders willing to trade small and opportunistically will be able to make many small trades for short periods of time that make more than what you might make in zones 1 and 2. Quickly touching on sizing, this zone invites smaller size and more traders for shorter periods of time.
Zone 4
Just like zone 4 in realized volatility (RV), this is the market in total panic and represents true fear in the market. The VIX is typically above 30, although zone 4 could be lower than that level. Like zone 3, the market is moving. However, unlike zone 3, zone 4 is almost always reactionary. IV pops into zone 4 because the market popped into zone 4. As rare as it happens, zone 4 is the level you need to be prepared for. Your approach to trades should flip; when it comes to vol, sell low and buy lower and vice versa. Its more than true with IV.
The main difference between RV and IV in zone 4 is that IV tends to be a little slower to calm down. Yet, zone 4 has a lot of pump fakes; in 2011 the market went to zone 4 in August for a few weeks, calmed down, and then showed its face again in October. In zone 4, you should be short and sweet and on the attack. The slow play is not in effect and standard ‘income’ trades should be dropped because they will likely get caught. This means that of you have a ‘system’ to sell Iron Condors, Butterflies, or other short premium trades, you also need to see what’s in front of you and not blindly trade your system. The standard trades most traders rely on are not what you should be trading in zone 4. You need to be ready to trade for an hour or a day, not all day for three weeks through systematic short premium trades.
Zone 4 is, in short, almost exactly the same as zone 4 in the RV section because the two are so similar, but without the duration. You should be willing to execute short trades in zone 4 and close them when the market threatens zone 3. More importantly, you should be willing to flip your approach to trading and buy premium or set up hedges in zone 4. We will spend a chapter discussing hedging and how to trade in zone 4 in later chapters.