Chapter 9
Butterflies and Condors
Beyond basic call and put spreads, the interesting next step is trading butterflies and condors. Much of what goes into a call or put spread creates a good butterfly or iron condor. And just as with a call or put spread, creating a butterfly or condor with edge demands a firm grasp of three matters:
- Volatility
- Skew
- Management
In piecing these together, you create a butterfly or condor with high odds of success, even with an ATM spread, because you will trade with edge. The key is to use the information in front of you to piece the right trade together, both in choosing the right spread and in identifying strikes and expiration for maximum potential.
The Butterfly
The basic butterfly is illustrated in Figure 9.1. In concept, a butterfly utilizes the following conditions:
- Short implied volatility
- Short realized volatility
- Centering around one strike
What other trade performs that way? A butterfly is simply a straddle that is hedged if the underlying moves. Straddles are executed by maximizing volatility or lack of volatility. Here is a graph of a short straddle.

If the underlying moves hard, your losses are largely stomped out because of the hedge. An iron butterfly (a straddle sold ATM with a wider strangle set up as a hedge) looks like the comparison in Figure 9.2; this one is set with wings 50 points wide.
The Greeks of the two trades are revealing. Both trades begin with:
–short gamma
–long theta
–short vega
The butterfly has the least extreme Greeks. The trade is about half as sensitive to movement, time, and volatility as a straddle. Interestingly, it does not give up nearly as much upside as half of the short straddle. So, what makes these trades winners? For a straddle, the answer is easy: if the underlying sits or only moves around a bit, you win. A butterfly is not nearly as easy, since you can use the other pieces of the trade to create spreads with a greater chance of success than that of a straddle. What makes a good butterfly?
Trading a Butterfly
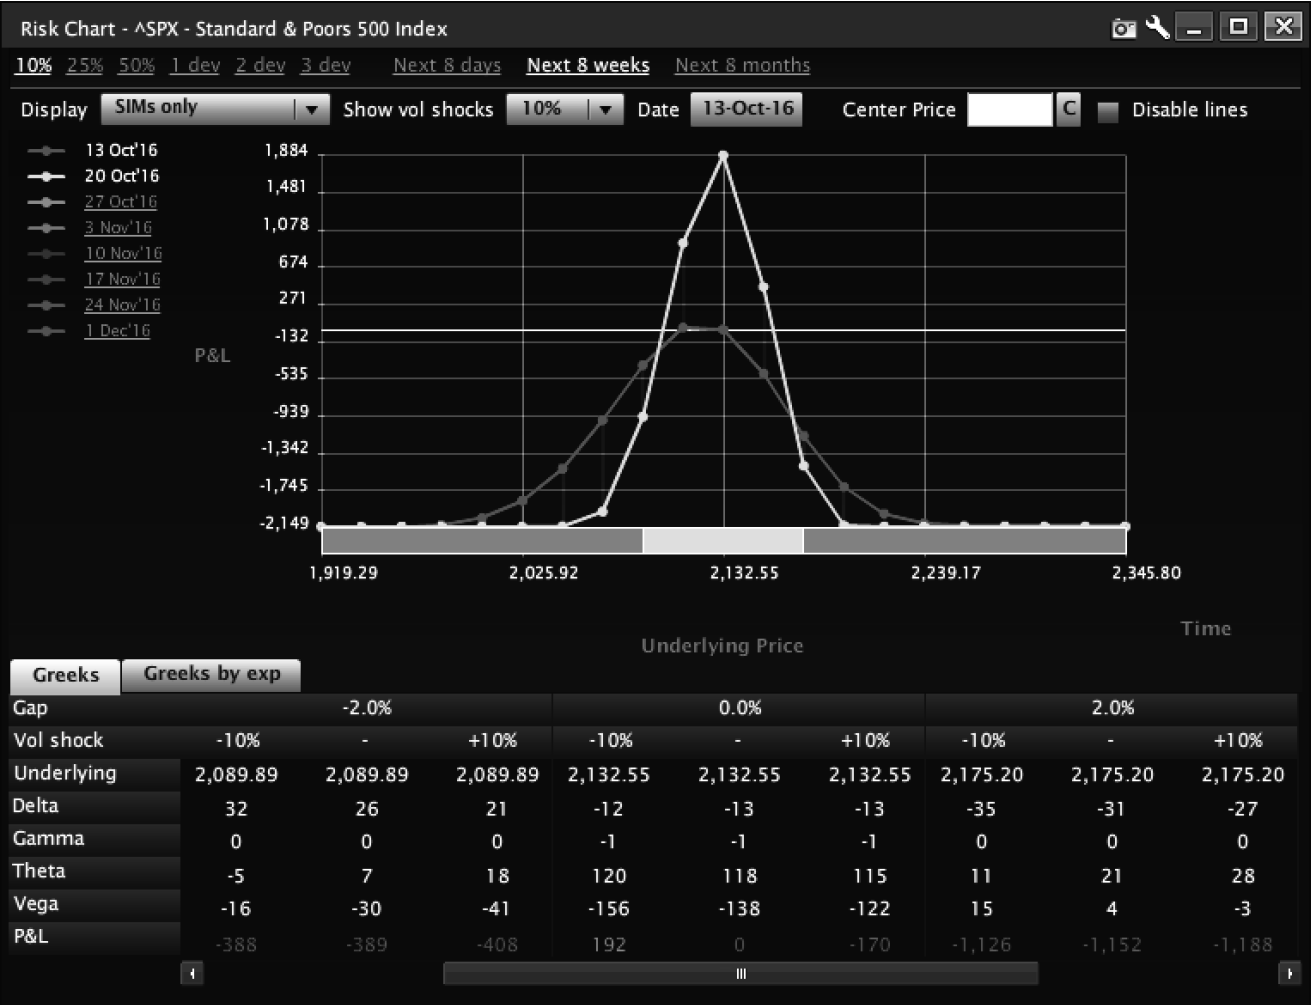
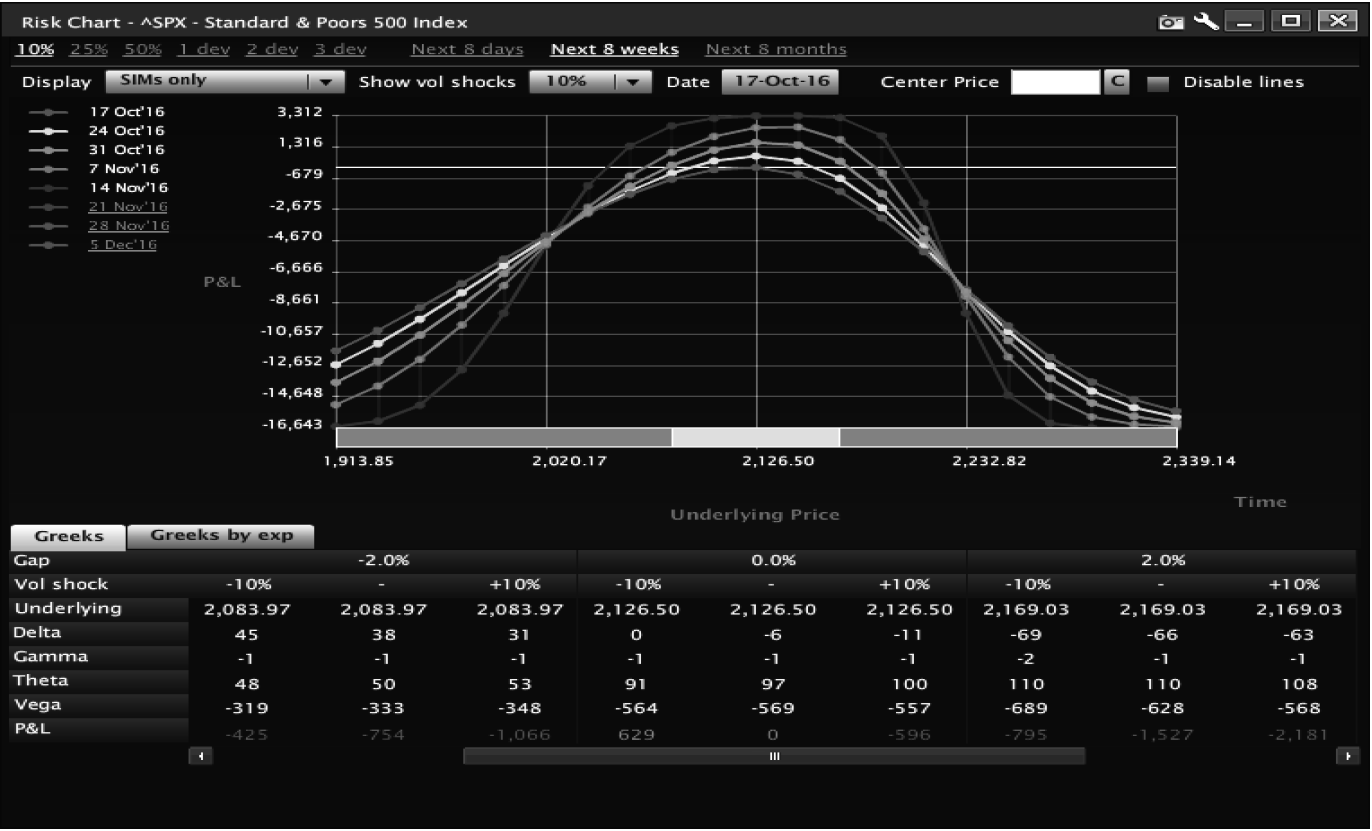
To start a trade in a butterfly, it should first have falling IV. The butterfly is short vega; this means the trade has volatility exposure. If IV falls, the butterfly will make money quickly as its vega exposure delivers. In Figure 9.3 a butterfly sees a 10% drop in IV ATM in one day.
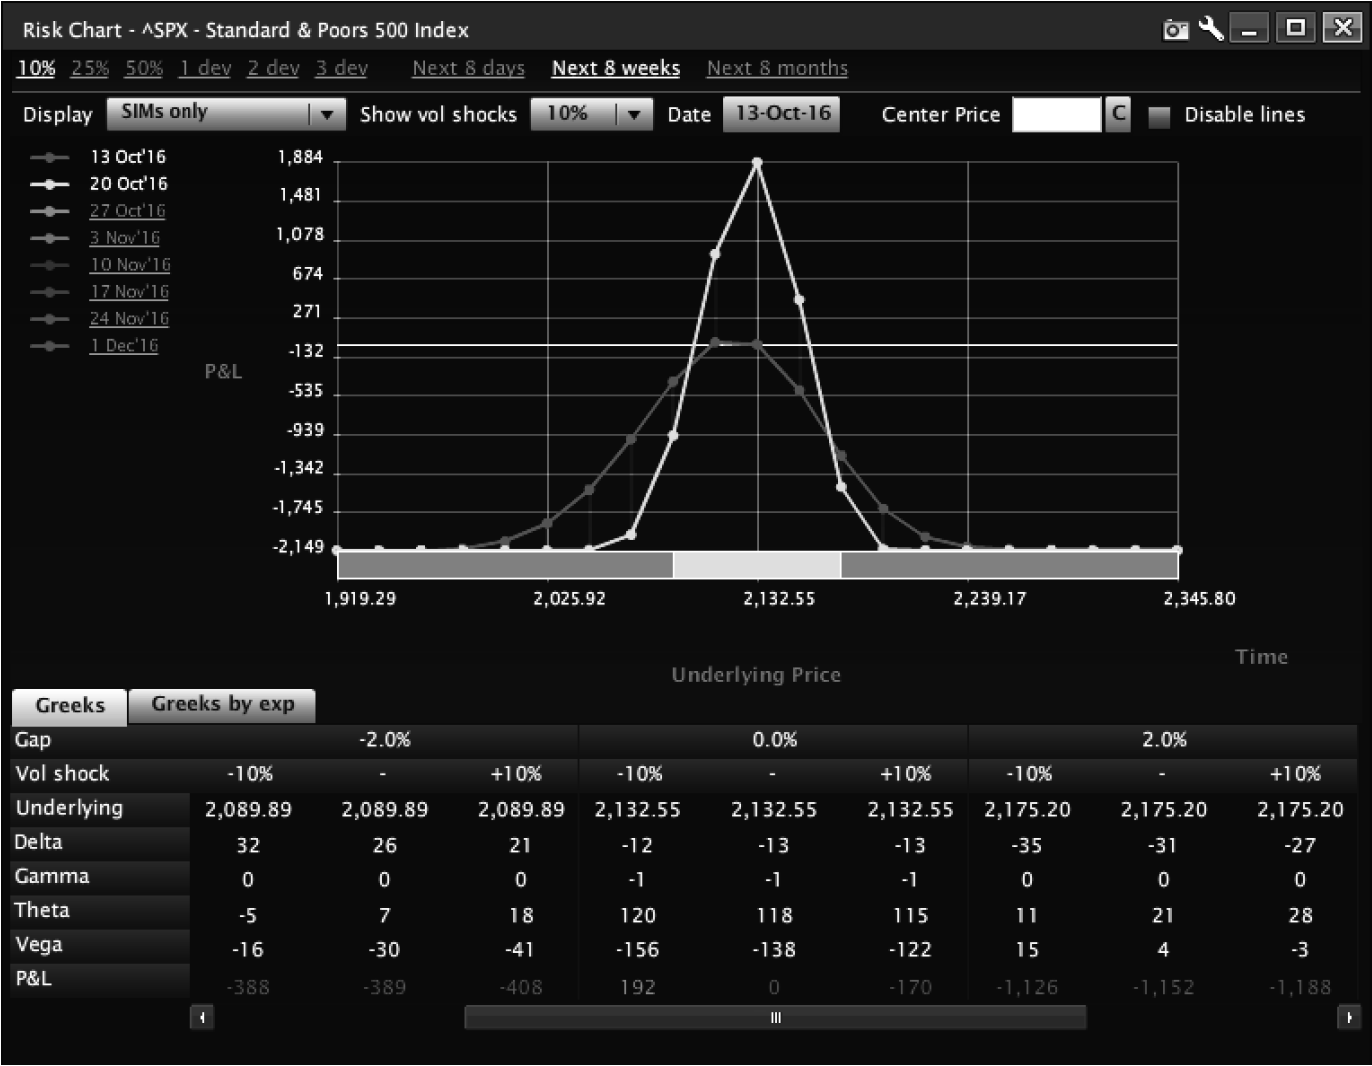
With a drop in volatility of 10%, the butterfly made $192 on risk of $2,149, net of commissions (you can see the 10% drop category under 0% move; P&L moves from zero to $192 on a drop, almost 10% on the trade with just a move in vol). Given a day or two of decay after this event, the trade is likely to close. When we discuss risk management, we argue that with a 10% drop in vol and no time passing, the above trade is a close. If IV falls immediately, thus trending down, that is favorable to a butterfly.
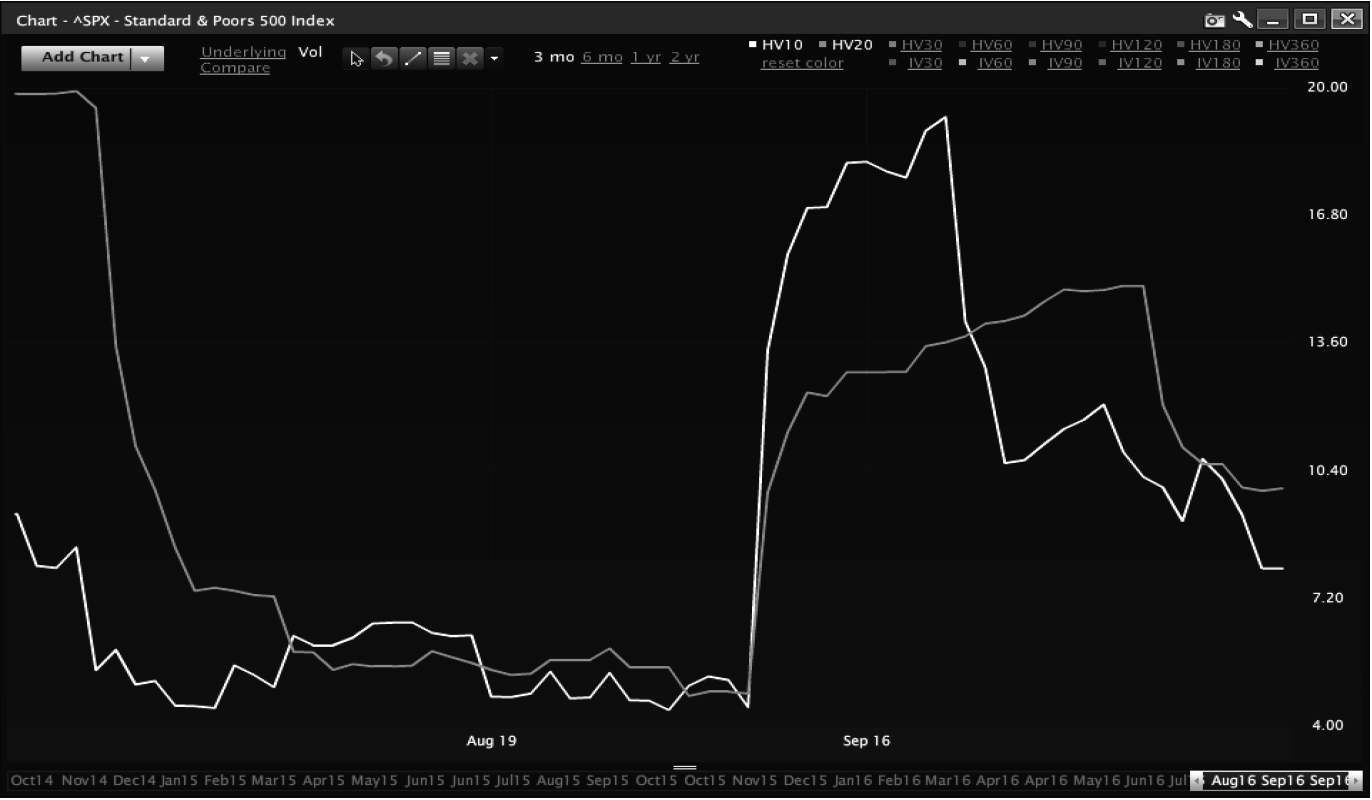
The next key is movement. What is going on with the underlying? Is it decreasing or increasing? It’s okay to execute a butterfly if IV is up, but if movement is also up, it’s a terrible idea. If movement is stable or falling, investigate further. Why is implied volatility increasing? If a butterfly is a bad idea, it’s because IV is rising or movement is rising, a real problem for these spreads. If movement is falling and IV is falling as seen as in Figure 9.3, it makes sense to trade a butterfly, otherwise you would need to believe that price levels were going to fall. Figure 9.4 is a chart showing a price (top) IV movement and HV movement in the S&P 500 (SPX). It might have been a perfect butterfly candidate. Over the 6 months shown in Figure 9.4, the underlying was unable to keep up with IV. If IV is going to hang out above movement that long, a butterfly might be appropriate.

That being said, I would not be ‘all over’ butterfly trading in SPX in this case. The reason is that IV was rising starting in June and rallying quickly. Very rarely does IV make a big move higher and then stop. We know that IV tends to correlate to itself. In other words, when IV rallies it tends to keep rallying and when IV drops it tends to keep dropping. Knowing this, what does a butterfly expect to happen? It expects IV to drop. If you execute a butterfly, be aware that if IV is rallying it probably won’t work. In addition, IV is meant to be a leading indicator of movement. Even though it is not particularly accurate, and almost always overpriced, this doesn’t mean you should unload butterflies into rising IV, because IV close to 50% of the time leads to a nice pop in volatility.
If you trade butterflies, be on top of volatility and how it is acting at the time; it should be falling, not rallying, hopefully from a level not overly sold (low). See the chart in Figure 9.5 for Citigroup.

If IV falls with movement, that may be the best time to execute a butterfly. However, there is one other factor important to the success of a trade: skew. A skew chart is shown in Figure 9.6.

The speed of IV increase on puts relative to calls is clear. Puts, options below the strike, tend to be sensitive to IV movement, but can also move on their own. When running tests on butterflies, how overpriced is the downside of the curve? If puts are expensive, the iron butterfly is going to be cheap (the standard butterfly will be too expensive). We trade straddles because the IV is expensive. We trade butterflies because the IV is too expensive, and because it is cheap to buy the downside. If puts are cheap, the butterfly is cheap and the trade will probably make money. To trade butterflies effectively, you cannot pay too much for downside puts. Cheap puts produce an iron butterfly that collects more profit and a standard butterfly that is too cheap.
Sounds easy, right? The problem is that it can be difficult to spot cheap vol and skew. The key is to be on top of volatility and curvature (skew). If curvature is cheap, even if IV is low, the trade may still be good; the opposite tends not to be true. The moral of the story is that skew (curvature) makes butterflies succeed.
The final step is picking strikes in an environment where HV and IV are falling and skew is normal or flat. Review the curve and find the best strikes to buy and sell. Look at the curve in VIX in Figure 9.7.

Some strikes are expensive and some are cheap. In the case of VIX, you would need to buy the 19s and 17s and sell the 18s. That would create a better butterfly from a price perspective. Compare, knowing the underlying is about $17.35. Comparing the 18–19–20 butterfly to the 17–18–19 butterfly, the value difference is apparent.
Consider the 18–19–20 iron butterfly discussed in the previous paragraph. It creates a credit of about 0.90. The17–18–19 discussed above creates a credit of 0.95. When the trade is this close to the money and this tight, there is little difference between the two trades, yet one produces a better price by0.05, which is a lot of edge for a trade of this width. You apply vol and skew concepts to pick strikes with an extra 0.05 on a tight spread, meaning you will have a hard time losing money on the trade.
The checklist for butterflies:
- Sinking movement
- Sinking IV
- Flat skew
- Picking the right strikes
Targeting Profit in a Butterfly
Once you put the butterfly on, the goal is the to make a quick dollar. Look for 10–15% on margin; if you want to get aggressive, shoot for 20%. On the other end, if managing losses, never accept a loss greater than what you are gunning for in wins. Win the same amount as you lose and win more often. The alternative is to win more than you lose and then make the same as you might lose. Either works, but you want to win, not lose.
Condors
Much of what makes a butterfly a successful trade makes a condor successful as well. While a butterfly is very similar to a short straddle, a condor is much more like a short strangle. Compare the two spreads in Figures 9.8 and 9.9.
At expiration, because of the long wings (long options against the short options), there is a difference in how much money can be lost in a disaster; at their onset and within the short strike, the two spreads have similar characteristics. Much like a butterfly’s P&L, the success of the trade is decided by whether HV is sinking, whether IV is sinking, and whether you can get the best price on the spread as a whole. However, the roles of IV, HV, and skew for a condor are slightly different than for the butterfly.
IV and HV
Like a butterfly, the condor expects HV and IV to fall; it will perform best under those circumstances. The difference in execution between the condor and the butterfly has to do with range. While a butterfly expects the underlying to stop completely, a condor is much more forgiving of movement. The distance between the short strikes leaves room for the underlying to move around. This makes the spread great for choppy markets, where you can capture IV spikes and have room for the underlying to move on a reaction and IV to drop.
Retail condor traders often believe that because IV is overpriced naturally, that makes condors a perfect spread to trade. The problem is that low HV might also be in conjunction with momentum. With a condor, you look for a choppy market that might have a slightly higher movement, but the underlying is spinning wheels (going nowhere).
A market where wheels spin is perfect for a condor because there will be opportunities to execute the sale on a lower spin and carry the trade as it rallies. Within one spin, the trader may be able to get out of the iron condor trade.
Several periods are perfect for condors that might not look as perfect on the basis of HV alone. To see this effect, overlay an indicator such as Bollinger Bands to visualize HV. The chart in Figure 9.10 demonstrates this point, specifically for periods where HV is declining. If you sold a condor in mid-August it might have gotten stuck or whipsawed by the market. If you were to sell in mid-September in the middle of a huge candle caused, say, by fear Deutsche Bank was going to go bust, but you believed that Deutsche Bank was going to be all right, you could have executed a condor and been in a position to collect a lot of chop and be out of a condor for a profit.

Meanwhile, look at the HV in Figure 9.11.
IV is cut and dried: if it’s dropping, it’s good for a condor, as well as for a butterfly. The big difference is that a condor can take a little more change in IV relative to a butterfly. Where a butterfly seeks a thumping of implied volatility, a condor is better with a ‘melt,’ meaning the underlying is doing little to nothing or chopping in a range, and is a trade that makes sense when there is a chance that IV still has more chop to it. Like a butterfly, condor trades expect a sinking of option premiums.
Skew
The big difference between a condor and a butterfly is the use of skew in analyzing the trade. While a butterfly necessarily makes money because of the skew, a condor relies less on curvature to succeed. That does not mean that you should ignore the skew curve. Skew is especially useful in condors for strike selection, which is visualized in the curve and makes a big difference by helping you decide what options to buy and sell. While a few pennies here and there can make little difference on an individual basis, making a few extra dollars on every trade over time creates a system of consistent profits.
Look at the curve in Figure 9.12.
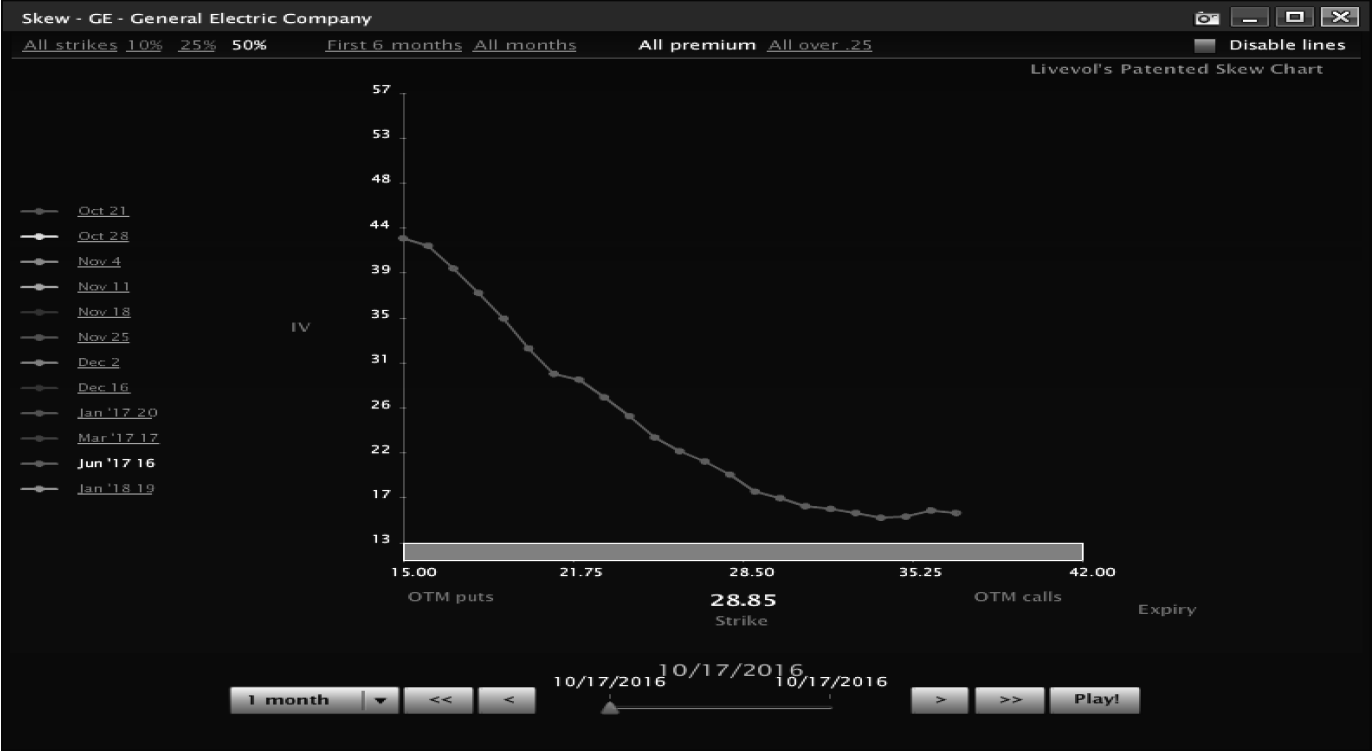
In this curve of GE options, there is a kink in the downside curve. You can sell the 22.50s and buy the 20 puts at nearly the same volatility. This is the type of trade that makes a condor profitable over time. By selling the same volatility on the put portion of the curve, you collect more premium. In an equity index, the lower the strike, the higher the IV. If you buy and sell the same IV, you collect more premium than you would expect otherwise. More premium means a greater credit, which in turn means higher odds of success.
Set Up and Management
Like the butterfly, there are many ways to set up a condor depending on style. In managing a condor, follow the same rules as a butterfly. Never try to make too much, never lose more than you are trying to make. In adjusting, make trades that reduce risk, not ones that strap on risk.
Follow these guidelines for setting up a condor:
- Look for falling HV and a choppy market
- Look for falling IV
- Take advantage of skew to set up the trade
- Manage the position
- Exit the trade
In the end, much like a butterfly, if you follow the steps to put on a good trade, you will win more often than not, and you will have an easier time managing risk.