Chapter 11
Calendar Spreads
The calendar spread is a trade betting that IV in one month is mispriced against another. While many view calendars as long or short implied volatility trades, in actuality, calendars are a play on the exact opposite. A calendar spread is a play on movement. Compare the long calendar to a short straddle. Figure 11.1 shows a risk chart of a short straddle for the SPX, whereas Figure 11.2 shows a calendar spread for the SPX under the same conditions.
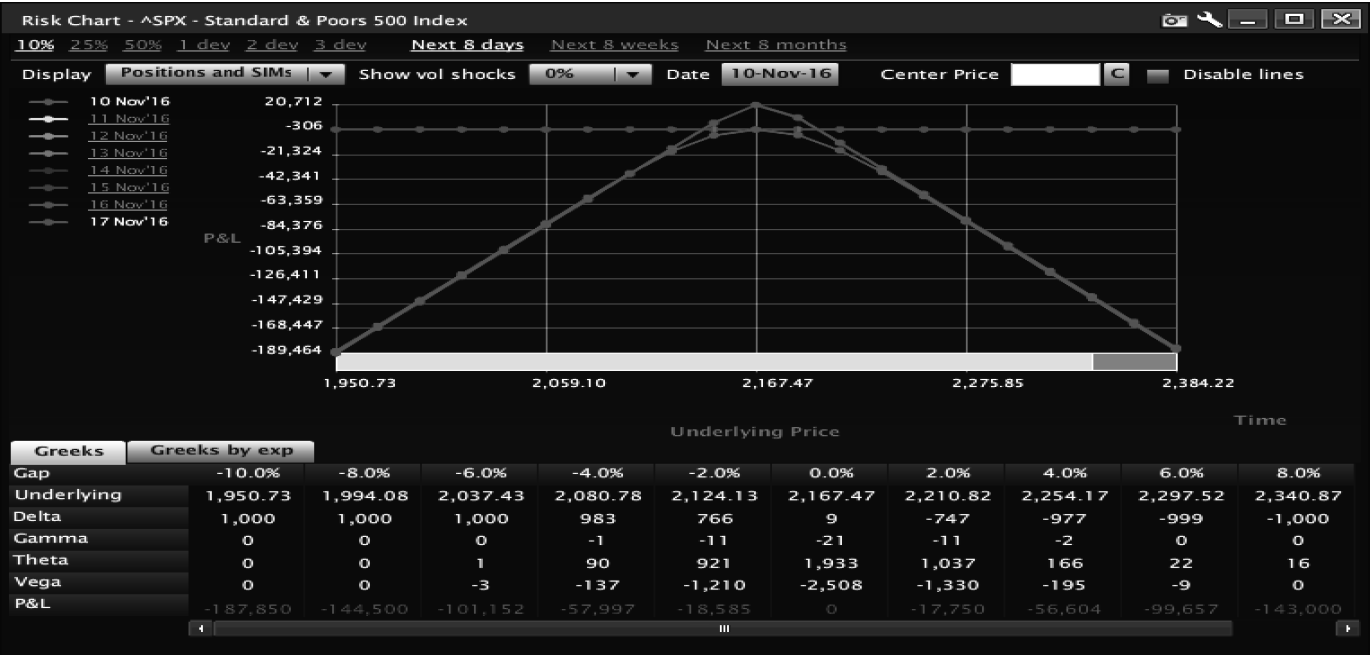
The only difference between the two is that there is a limit to how much a calendar can lose. On the surface, though, calendar spreads and straddles are in a sense the same trade. The major difference is that owning the back-month contract creates a hedge in the case of a major move and it creates a hedge if and when IV explodes.

Creating a Calendar
A calendar is exposure to realized volatility, but with sensitivity to implied volatility rallying. It’s a vol swap. You are betting that near-term volatility is too high and long-term volatility is too low. You also believe that the overall perception of volatility is too low, while movement itself is sinking. To say these are complex vehicles is an understatement; however, you can develop a trade with a ton of edge in it and have a hard time losing while enjoying huge upside potential. Here are the steps to developing a good calendar spread.
- Evaluate overall implied volatility
- Evaluate term structure
- Evaluate event risk
- Evaluate realized volatility
- Evaluate the market trend
- Choose the right strikes
- Execute the trade
- Manage the trade
- Exit
Evaluate Overall Implied Volatility
Calendars do best when they are executed in a low implied volatility environment. Like all purchases, the lower the price, the better. In addition to a lower price, since IV is mean reverting both within and between zones, buying calendars when volatility is cheap will lead to trades with higher odds of success. The next chart in Figure 11.3 is VXAPL.

In July and August, IV of AAPL options was cheap (compared with past movement)—at levels where you should buy. IV was low over this period. AAPL prices in August versus September for an option with 30 days to expire reveal more. Figure 11.4 shows August 9th options:
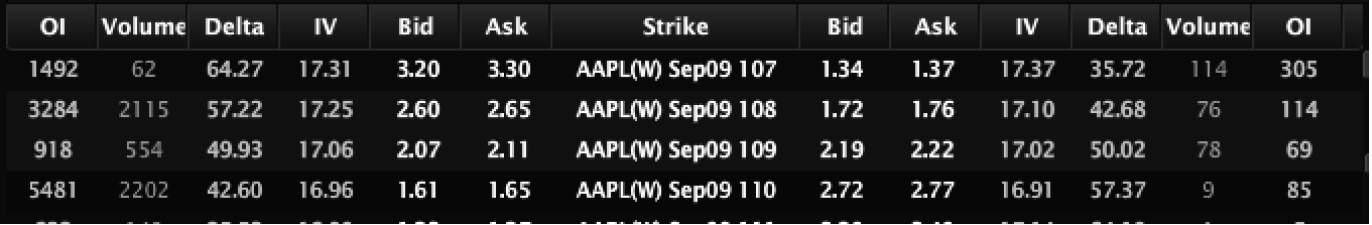
In the montage above the ATM options (using the offer price) cost about 2.4% of the value of the underlying stock (2.1/109 = 1.92%). Options with 30 days remaining until September expiration are shown in Figure 11.5.
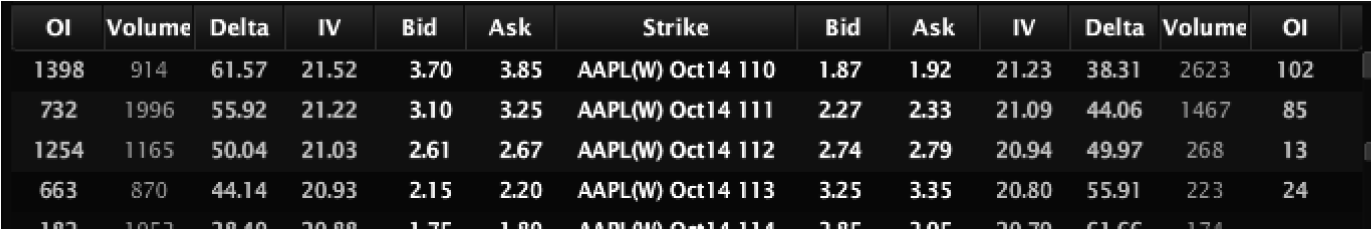
The ATM options cost about 2.4% of the value of the stock (2.65/112 = .0237). That is no small difference in straddle price for a stock costing $100.00 per share. .50 in a straddle is a big change in straddle price; now let’s think about how that might affect much large stock and index options In the SPX or NDX indexes with values in the thousands, instead of 0.50 a spread in the bid-ask in index options can be worth 5.0–6.5 dollars per contract or more. That is not a small dollar amount in an option spread. Most traders in index options are only trying to make 1.00 to 2.00 on the entire trade. Thus, small changes in IV can dramatically change the cost of the straddle and will mean the difference between a trade with high odds and a trade likely to lose.
When VXAPL is low, calendar spreads are cheaper, making them potent. However, overall low IV is not the only way price is determined. The second (and almost as important) piece of overall pricing is term structure.
Evaluate Term Structure
The next key to a calendar is the relationship between contract months; the IV of one week or month against another. It’s not enough to have low volatility if the option being sold is also too cheap. When IV is low, term structure tends to steepen, just like a VIX futures curve. Vol is low in the near-term contract, but gets progressively higher with each week and month. Because IV is low, the assumption that IVs will revert higher pulls the curve. When it’s low, traders look for a quicker and slightly stronger reversion; however, unlike the VIX futures curve, the structure is far more inefficient. Vol doesn’t move as smoothly across contracts in individual months among index options, especially with daily and weekly options. It is even less efficient in equity options, where one trade can throw off the entire volatility curve in one month relative to all the other months. Figure 11.6 is a chart of options on AAPL.

Even when IV is low, spreads between the 30 and 60 day IV widen and tighten over time. When IVs tighten and IV is low, calendars can work and work quickly. However, with weekly and daily options now available, it’s not enough to look at simple vol charts. You need to study aggregate vol. Look at the weeks in Figure 11.7 to determine which contracts can be bought or sold.

You could have bought the December 30 contract and sold the December 2 or December 9 contract for even volatility. You could get a credit selling the December 16 against the December 30, but there might be a reason not to, as explained in the next paragraph.
Evaluate Event Risk
In Figure 11.7, December 16 seemed to have a much higher IV than the contracts in front of and behind it. Why? If you don’t review event risk, you would overlook the fact that December 16 was the week of a major FOMC (Federal Open Market Committee) meeting. Traders believed that the FOMC might raise rates in December, but the result was not certain at the time. Because of this belief, IVs were high across the board in all major stocks and indexes for the December 16 contract. This means that IV term structure likely did not have an edge around that contract. Unless you were willing to hold through the Fed meeting, there was no edge in being short the December 16 contract. Given our belief in not trading events, the high IV amounts to no theoretical edge. Thus, you would be better off taking a small negative vol trade selling December 2 and buying December 30 than doing a trade around December 16. If you are looking for edge, event risk is not the way to trade.
Evaluate Realized Volatility
While overall IV and term structure are the primary keys to trading calendars, also recognize the movement of the underlying. If the underlying is moving a lot, a calendar will lose. Thus, while you should look at the IVs, you also need to examine HV movement (see Figure 11.8).
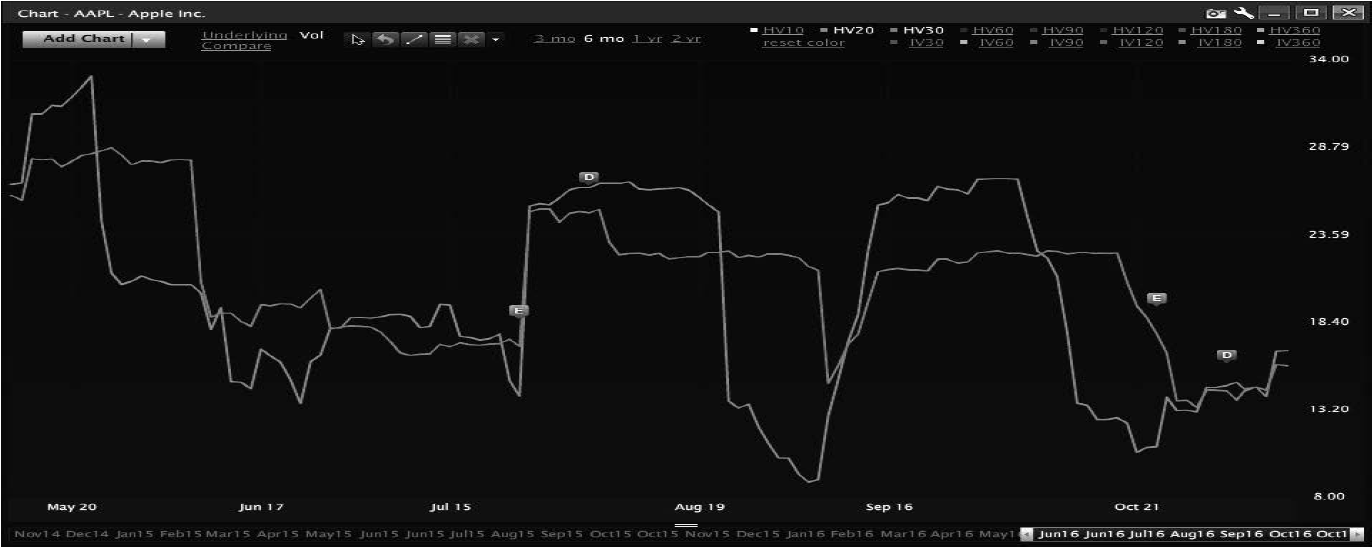
Like a straddle, a calendar wants the underlying to sit; so look for periods where movement is starting to fall. In August, you could have set up a trade that bought cheap volatility just as movement stopped—a great time to execute a trade. Alternatively, movement is mean reverting, so the times where movement was at its lowest could line up with low volatility. Trade into sinking movement, not bottoming out movement. Look at movement with IV in SPX in Figure 11.9.
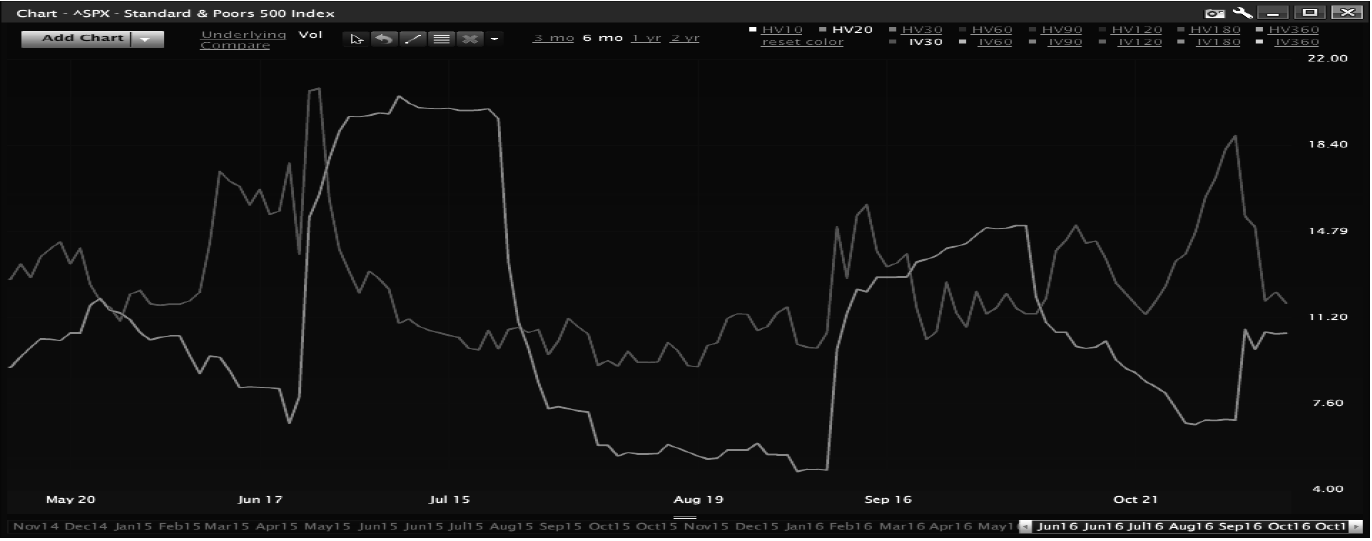
The time to execute a calendar was in late July when HV was dropping and IV was low. At the end of August, HV was bottoming and vol was low, but then HV started to move again. It is important to pay attention not to where HV is, but the direction of movement. If HV is falling and is in the toilet, that could be a great time to execute a calendar. If HV and IV are both low, that might seem like a great spread, but might not have as much edge in the trade.
Choose the Right Strikes
Don’t ignore strike-to-strike volatility—how one strike’s IV is priced against that of another strike. Within a month, each strike has its own volatility and that can be expensive or cheap. Examining standard term structure provides insight into where volatility is currently; in order to optimize a trade, review each strike to find the right price. Look at the December 9 contract and December 30 contract in AAPL around the ATM strikes as shown in Figure 11.10.
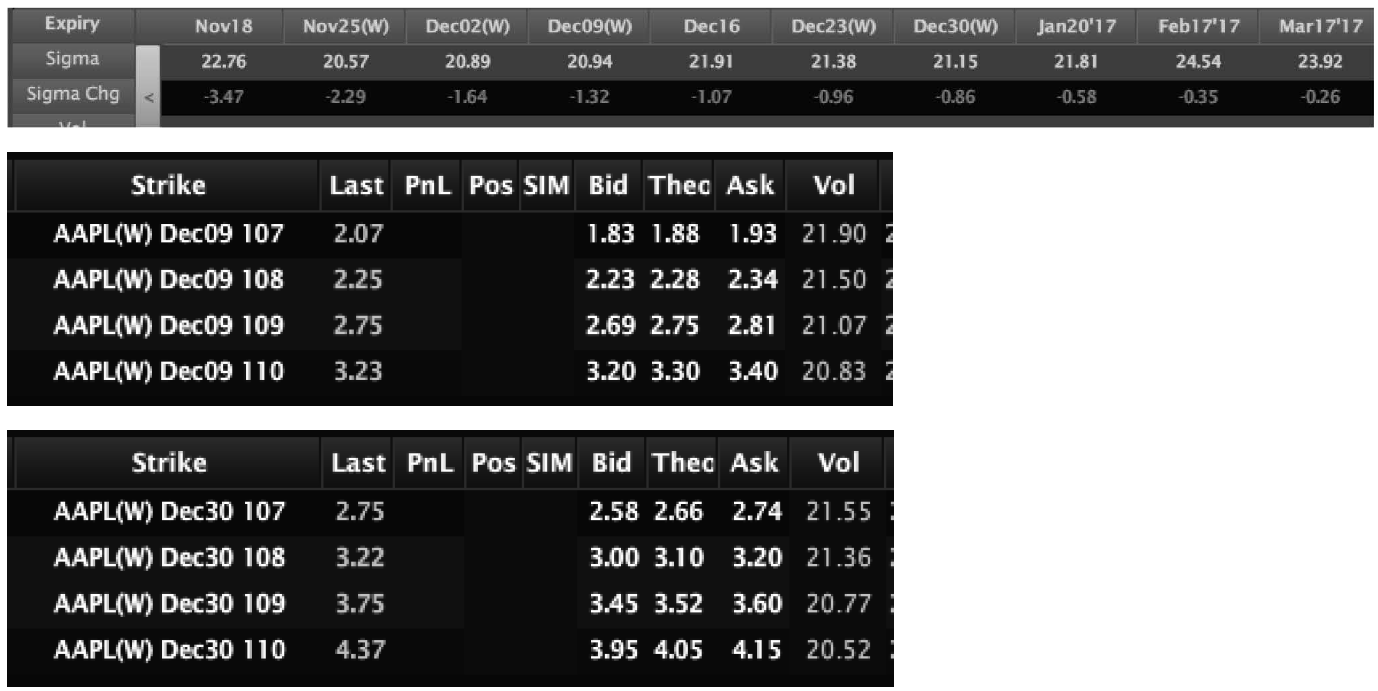
The spread between the different strikes varies from strike to strike. The 107s have a vol spread of 0.35 (21.9 less 21.55), the 108s are 0.14, the 109s are 0.30 and the 110s are 0.31.
Based on the spreads, there is more potential in trading the 108 calendar with its tighter spreads than the other contracts. If you are setting up an ATM calendar, the 108s appear to be the strike to trade as the IV spread is less than half of the surrounding strikes. While 0.14 to 0.3 might not seem like much based on the net vega of the spread, which is about 4 cents in the calendar, executing the 108 would produce an extra 0.01 in the calendar. A penny is equal to the commission on the trade.
If you are able to trade commission-free, how much more would you make in a year? While you can’t trade commission-free, you can create enough edge in a trade to negate its cost.
Execute the Trade
If you put on a calendar and then the underlying moves (unless the move is a crazy hard move), given the edge executed in the trade, the trade should be near break-even or only slightly down. Practice closing these trades almost immediately. A well-executed calendar should make money in a few days. If it doesn’t, or starts losing money, there might not have been nearly as much edge, or the edge could lose. Closing trades with edge that lose, quickly, and then making money on the winners should result in more profits than losses.
An alternative to this management tactic is to add a calendar in the direction of movement. This is a more nuanced approach to management, and requires conditions the trader liked about the first calendar to still be in effect, thus the calendar would have an edge to it. If you do this, you will end up with a double calendar that will be around the current price. However, you still need to have great calendar trading conditions. In this scenario, you sell a calendar one strike beyond where the underlying is currently trading; thus, if you executed an AAPL 150 calendar initially, and the stock ran to 155, you would then add a calendar at the 157.5 or 160 strike (see Figure 11.11).

The underlying is now surrounded by calendar spreads. If the underlying sits, you will make money as time passes and if IV runs higher. If the things that make a calendar not work continue to happen, you will lose more. This is why, when the conditions for a calendar are no longer present on the initial spread, you should kill the trade.
Manage the Trade
With calendar spreads traded for edge, we believe in the simple approach to adjusting. Each trade should have edge. We look for a simple approach to calendar management.
Exit
When managing a calendar, you should be going for about 10–15% of the margin, while looking to lose less than 5%. If this is done over time, calendar trading should produce net overall profits. The absolute max loss on a calendar should be about what you are trying to make in profit. The key is the edge though. If you trade these with edge over time, calendars will win.