Chapter 12
How a Market Maker Trades
How do market makers trade? There are two answers, a general approach and a “manage the book” approach. At the onset, how a trader acts is what builds the book. Market makers would rather be involved in trading, not in building the book. This is a primary driver in option pricing; market makers dislike carrying positions.
Market Making
The story of market making begins with middlemen. They do one thing: manage demand, regardless of their actual jobs. Middlemen buy fish from fishermen, then sell them at the wharf. Middlemen buy furniture, then sell it to office managers when they need to furnish their offices. Middlemen are some of the biggest companies in the world. Walmart is the world’s largest middleman.
With stocks, middlemen take a different name: market maker. In a perfect world, the market would be able to match buyers to sellers exactly. This does happen every now and then, but most of the time someone has to buy an unwanted stock, or sell a wanted stock to an individual and hold the opposite position for a period of time. Here is how stock market making works:
–A market maker presents a market on XYZ currently trading at $100.00
–The bid is $99.95 for 1,000 shares and the offer is $100.05
–The offer trades as the underlying prints (sells at) $100.05
–The market after the trade is: The bid is $100.00 for 1,000 shares and the offer is $100.05
–The bid trades $100.00. The market maker makes $100.05 – 100, netting $0.05 on 1,000 shares, or $50.00
Fifteen years ago, that was the model on a few hundred million shares a day. Now that there a billion shares a day, spreads have tightened to 0.02 wide for active stocks and 0.05 wide for less liquid stocks. The ‘trade by appointment’ stocks still can have spread-widths of 0.20 or more. In a given day, a firm can make good money simply buying stock, holding it for a few seconds, and then selling it to someone else.
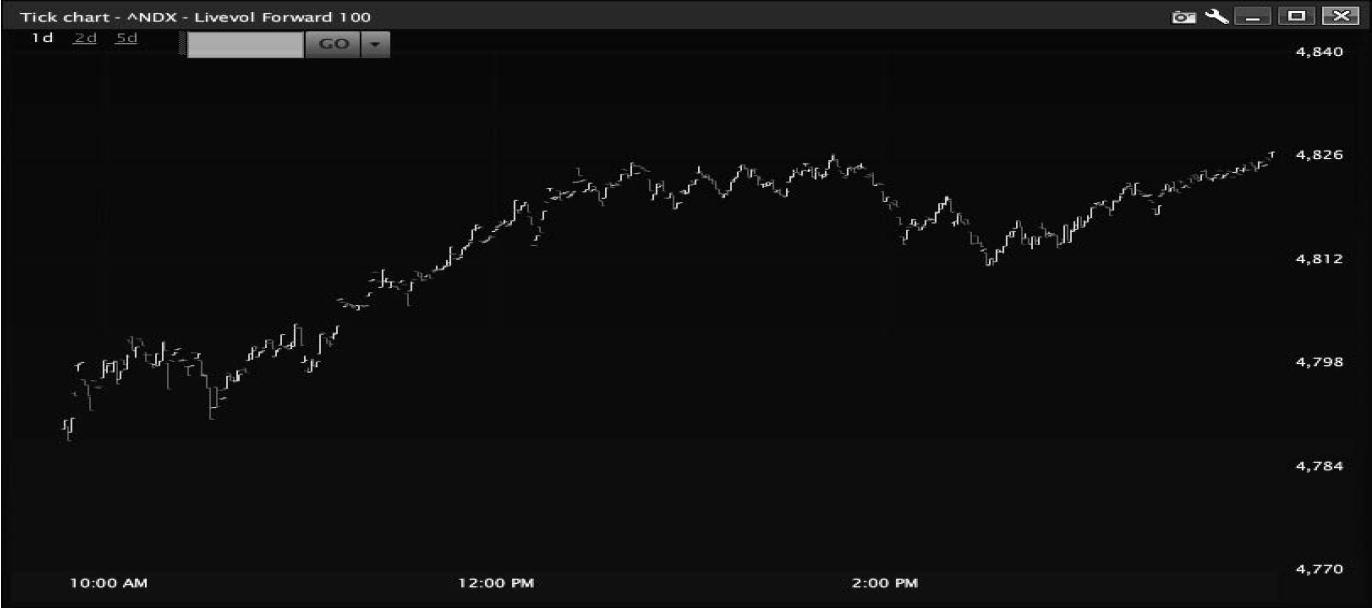
Why do market makers make money? Because they are willing to hold a position for a short period of time. However, because market makers don’t want to hold a position, markets move. This movement is the risk the market maker takes. Prints can go in stocks when the underlying moves. For example, consider the intra-day tick chart of NDX in Figure 12.1.

From 10:30 AM to 12:00 PM the stock went straight up, yet the market maker had to take the risk of being short the NDX over that brief time. For this reason, market makers are able to trade on the bid/offer spread. In the end, they do not make $50 dollars per trade or even $20; it ends up amounting to less than $1.00 per trade. With dynamic hedging (hedging as the delta moves), direction should not be important as hedging takes directional moves out of the equation (except for gaps).
While the above is similar to option market making, it is not exactly the same. A stock market maker needs to make markets in one instrument, the stock. A market maker in options needs to make markets in hundreds of strikes, all of which move with the underlying. While a market maker could try to make markets on each individual case, given the scope of the job and the correlated relationship of each contract, option market makers have to move all options when a single option trades.
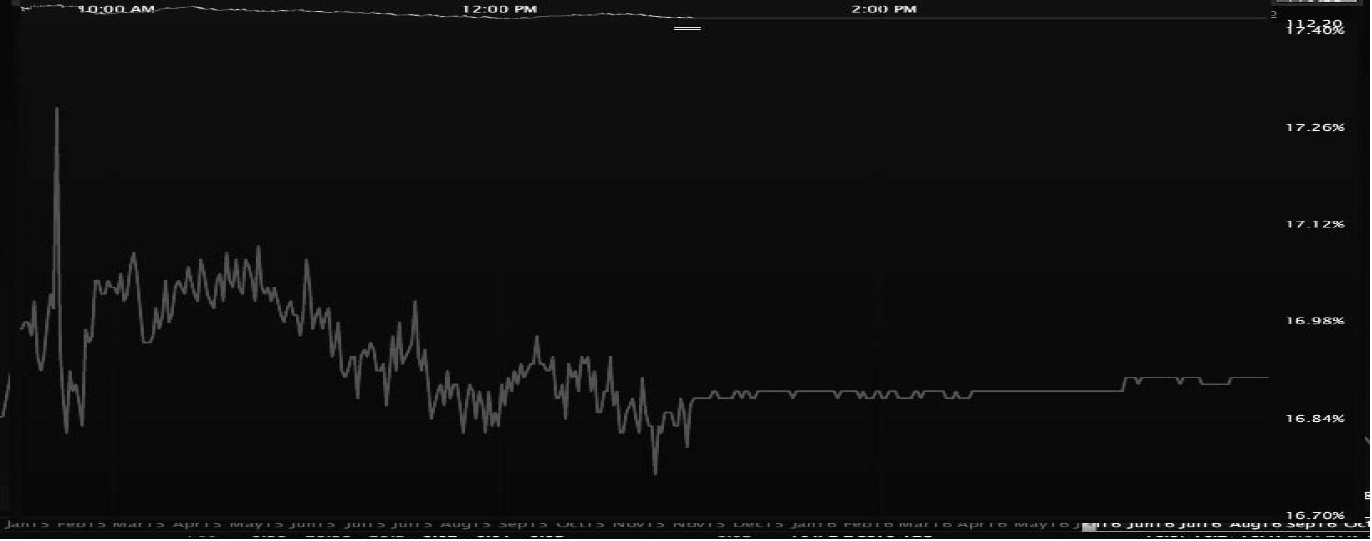
Option traders, in order to manage the entire curve, need to trade volatility. Look at the vol chart of AAPL in Figure 12.2.

Much like a stock price, option volatility moves around on a daily basis and moment to moment. This point is made in Figure 12.3.

At any given time, regardless of the movement in the stock, the vol price is based on what traders buy and sell. Market makers trade volatility on option prices. They hedge off directional risk when they trade and hedge delta as the underlying moves. A trader might set his fair value volatility at 40: for example, you might set your vols based on 39 bid and 41 offer.
When you trade an option, regardless of the strike, it is going to move volatility. Whether you buy an out-of-the-money option or an in-the-money option, downside or upside, volatility is going to move. Because you bought an option, the new vol levels may move to 40 bid and 42 offer. While this example is more extreme than movement most of the time, it’s indicative of how markets are made by market makers.
The market makers do not want to hold too strong a position one way or the other. By moving markets based on vol, you avoid establishing too large of a position. If vols get too high, someone, likely a professional customer, will sell the overpriced volatility back to the market maker. The market maker will have very little position open, and vol pricing will be near equilibrium.
The Trader
What does this have to do with the retail or ‘prop’ trader? The above approach applies to those producing trades. One of the major mistakes retail traders make is over-playing their hand. By this I mean that traders tend to sell or buy too much. Thus, you should approach position building much like a market maker; you don’t wait for the trade to come to you, but allow your trades to determine the next trade increment. The first trade shouldn’t be the biggest.
The most powerful weapon you have is your ability to initiate a trade, or not initiate it. When trading, you will tend to think it is important to develop a management system. A numbers system can work (this is something we work on with people at Option Pit) or it can be some other approach. We like our students to rank each trade on a scale from 1 to 5. The higher the number, the more they pay to remove risk. This way, we rank the likelihood of success on a trade. If a trade is good, it should demand less capital. The equation is direct: by ranking your trade based on risk, you identify an appropriate level of risk you are willing to take. Too many traders fail to understand this and end up losing money because they lacked a rating system.
The first key to portfolio building is to develop a rating system for this purpose. How good is this trade? If it’s a great trade, you might apply a rating of a 7 or 8 on a scale of 1 to 10. If the trade isn’t that great, you might apply 5. If the trade is below 5, don’t even bother. This is something traders do all the time. Market makers have an advantage: They see orders come in, and do not generate them. The fact that orders have to be generated by upstairs traders and the public makes the process of rating trades that much more important. As you create the trade, you are not getting the bid-ask spread. The only value the upstairs trader has is the edge generated by the trade. Prop desk and major upstairs traders likely go through this process in their heads as well. We think the retail public (which does not have the luxury of managing a multi-million dollar book) needs, at the onset, to use a system of rating each trade.
Here are the steps for rating a trade:
Step 1
Establish fair value of a given trade. This may be a credit received, given the risk, or it may be a value above a theoretical value. Newer traders tend to go with the former and more experienced traders will go with the latter. For our assumptions, this example is the former. The fair value should be set for each trade, and really for each product (which really means the volatility of the underlying). Time spreads and similar trades are a little more complicated as it’s the vol spread that sets the edge, but all things being equal, it’s not that different from buying or selling a single option.
Step 2
What is the maximum capital to allocate to a trade? If a trade is just okay, you might be willing to place 2% of your portfolio at risk. If a trade is a home run, you might be willing to put 5% toward the trade. Even the absolute home run percentage should be less than the maximum you are willing to apply toward a trade. If we have one rule it is, “always be able to trade.” Thus, while a single position should never take more than 10% of your portfolio, it should not meet the maximum and should be limited, probably to about 5% maximum.
Step 3
Slowly build a book. One of the mistakes retail traders make is the failure to let the right trade come to them. While you have to press the buy or sell button, you do not have to do it on any specific date or time. Traders that take the time to let a good trade “show up” (and by that, I mean set criteria, stick to them, and wait for the right trade) will be more successful than those traders that wing it. The key is that as the book builds, the rating system changes. While at the onset you might be willing to trade a 3 out of 5, after one trade, the next trade needs to be a 4, and then a 5 after that. The next trade, if it’s not a 5, needs to be skipped. In fact, if an offer on the other side of the current position comes in near a 3, you might be willing to take the trade if you have sold recently at 5.
While you rate each trade, in the end, you look at the portfolio as a whole. We are going to look at a portfolio in the next section and how it might be built in a single day. We discuss managing the portfolio as a whole in the next two chapters.
Step 4
Unwind the book. Much like putting on a trade, take trades off in waves. If the trade makes the profit target quickly and you only have one trade on, the plan becomes easy; close the trade. If you have many trades on, it is more convoluted. This is where profit targets for every trade matter. The following is an example of how a basic portfolio might trade condors.
Using the Option Pit Method to build a portfolio of trades:
Day 1: Sell a condor with a rating 3: 2%
Day 2: Sell a condor with a rating 4: 2%
Day 3: Sell a condor with a rating 5: 4%
Day 4: Sell a condor with a rating 5: 2%
Even though you saw a rating of 5 on day 4, you only sold 2%; this is because the condor as a whole had allocated 10% of the portfolio’s risk. Thus, even though it was better than the day 1 trade, it went at the same level. You should not stop yourself from being able to trade by trading too much at one time. This is the key to the day 4 sale level.
Now looking at a larger portfolio, the tricky part is understanding that each trade adds on to the next. A trade done is additive to the entirety of the portfolio:
Day 1: Sell a condor with a rating 3: 2%
Day 2: Sell an iron butterfly with a rating 5: 5%
Day 3: Buy a straddle with a rating 3: 2%
Day 4: Sell an iron butterfly with a rating 5: 5%
Day 5: Buy a straddle with a rating 3: 4%
Even though the trades are all different, they offset to some degree. Yet this does not negate the fact that each trade does not exceed 5%. If you do too much of the same thing, you have to stop trading. Build a portfolio in which you understand what each trade means to the overall picture. You should build, in our opinion, a spreadsheet that helps you keeps track.
Setting numbers to every trade is part of your retail trader training. It transforms how you look at the Greeks and risk into a skill. To manage a book, you need to be able to weight and understand the Greeks. To do that you need to use weighted Greeks, the right forms of vega, and total delta management.
