Chapter 14
Crisis Alpha
Chapter 14 was written by my good friends Mike and Matt Thompson of Typhon Capital Management. I asked them to write this chapter because while I understand how the process works, they run a fund that engages in the practice. Their domain knowledge exceeds mine and brings more value to you.
Crisis alpha is a relatively new label in the financial industry used to describe investment strategies designed to generate positive returns during equity market panics. Crisis alpha strategies can range from short-focused hedge funds and trend-following CTAs, to specialized “Black Swan” tail risk protection products. This chapter focuses on generating crisis alpha using VIX futures and options.
Like any insurance product, VIX derivatives have a cost associated with their use. When using these products, seekers of crisis alpha must be cognizant of the cost, which can be substantial, while the equity markets are not experiencing a shock. If not properly managed, accumulated losses from ‘always on’ protection in VIX can easily outweigh the benefits delivered during the next equity dislocation. It is one thing to deliver alpha during a crisis, but if the overall costs outweigh the benefits, the position may not make sense for an investor’s portfolio.
Defining a Market Crisis
Distinct from a run-of-the-mill correction, a “crisis” in markets is a prolonged period of widespread re-pricing of risk assets, usually in response to a macroeconomic shock. In a true crisis, though the initial shock often originates in a specific asset class, its effects often propagate to other assets and may continue reverberating for weeks or months as the markets are waiting for the next shoe to drop. As this process unfolds, cross-asset correlations often rise to near 100%, effectively negating any diversification benefits and increasing demand for near-term options-based protection. This sharp shift in demand results in increased near-term implied volatility relative to medium and long-term measures, eventually inverting the VIX term structure, a condition known in the futures markets as backwardation.
Graphically, this is represented as a downward-sloping line connecting short-term implied volatility measures such as the VIX index (30-day S&P 500 implied volatility) with the various maturities of VIX futures (1 – 8 month forward VIX) as shown in Figure 14.1.

Lehman Brothers Bankruptcy
Perhaps the ‘gold standard’ for an acute market crisis was the period beginning with the bankruptcy of Lehman Brothers on September 15, 2008. Though the initial shock was felt in the financial sector of U.S. equities, it quickly spread into the short-term fixed income (commercial paper) market, causing a ‘run’ on money market funds that further exacerbated pressure on the balance sheets of large financials, eventually causing the near-collapse of AIG and many of its counterparties over the ensuing weeks.
Importantly, the VIX term structure inverted before the crisis began and remained inverted throughout the turbulence of the following weeks (as shown in Figure 14.2). This behavior is distinct from a singular event-driven spike in volatility which is defined by a flattening or brief inversion of the term structure, followed by a quick resolution as the event passes and hedges unwind.

VIX Term Structure Determines ‘Value’ for VIX Derivatives
When it comes to VIX derivatives, the self-evident ‘buy low, sell high’ rule becomes more complicated. Since they settle to an index which cannot be owned or replicated, VIX futures are a pure ‘expectations’ market. As such, they trade with a volatility risk premium (VRP) not present in most other markets.
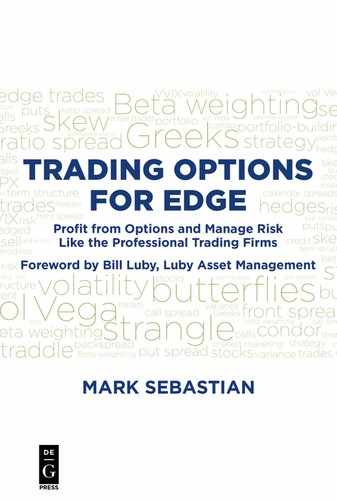
VRP is represented by the slope of the VIX term structure. When markets are calm and the VIX index is low, it is common to see a steeply upward-sloping curve that signals high VRP embedded in each VIX future. This becomes hugely impactful for long positions in VIX futures or associated VIX calls which pay this premium on top of the typical theta in an option or implied interest rate in a future. Since their introduction in March 2004, the median price difference between the second and first VIX future is approximately 8% per month. In other words, the market assigns (and long VIX positions pay) an 8% premium for the roughly 30-day period between those two expirations (see Figure 14.3).
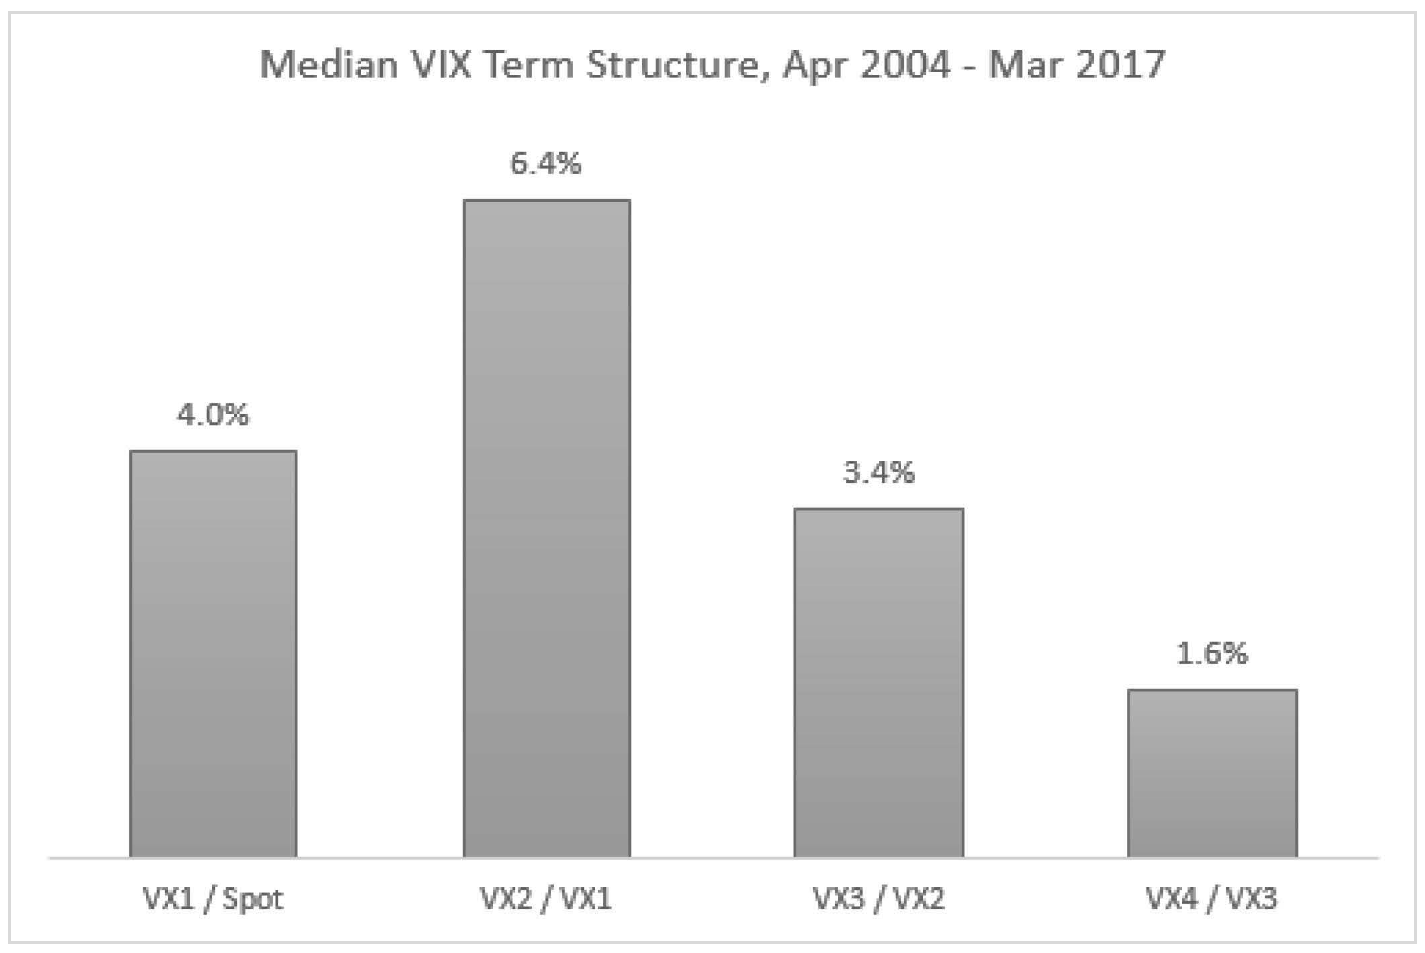
Factoring in this additional cost sets up the somewhat strange situation where the curve shape can render a long VIX position ‘cheap’ with the VIX near 20 and ‘expensive’ with the VIX near 13, confounding the “buy low, sell high” crowd focused solely on the VIX index level. Perhaps nowhere is this phenomenon more apparent than in the $1B iPath S&P 500 Short Term VIX Futures ETN, ticker VXX. VXX is designed to track a constant 30-day maturity VIX future, which means constant exposure to VRP. As shown in Figure 14.4, VXX tends to perform poorly when it is paying the VRP while the VIX futures curve is upward-sloping (in contango using futures parlance) and tends to perform best when it is receiving VRP while the curve is downward-sloping (in backwardation). In other words, VXX has often performed best after the VIX has risen toward 20 where the curve usually begins to invert, while the worst time to buy is when the VIX is low and the VIX curve is steep.
Crisis Alpha Approaches
With an understanding of the factors affecting VIX derivatives pricing, the need to manage the ‘cost of carry’ of any long VIX position quickly becomes apparent. While there are nearly infinite variations, cost-conscious crisis alpha positioning in VIX derivatives generally falls into one of two categories: (1) a tactical approach that attempts to find the most effective risk/reward environments to hedge, or (2) the construction of low-cost positions designed to be always carried. As with most investment strategies, each approach has its own trade-offs and the best choice will ultimately depend on an investor’s specific circumstances.
Approach 1: Tactical Long VIX
The concept of a rolling panic in equity markets can be compared to fighting a forest fire. Often, containing the damage from the initial brush fire is easy and the surrounding environment quickly bounces back. However, occasionally a series of brush fires combine to form a large-scale forest fire, exponentially raising risk and complicating containment efforts, which can ultimately lead to widespread damage and a lengthy recovery period.
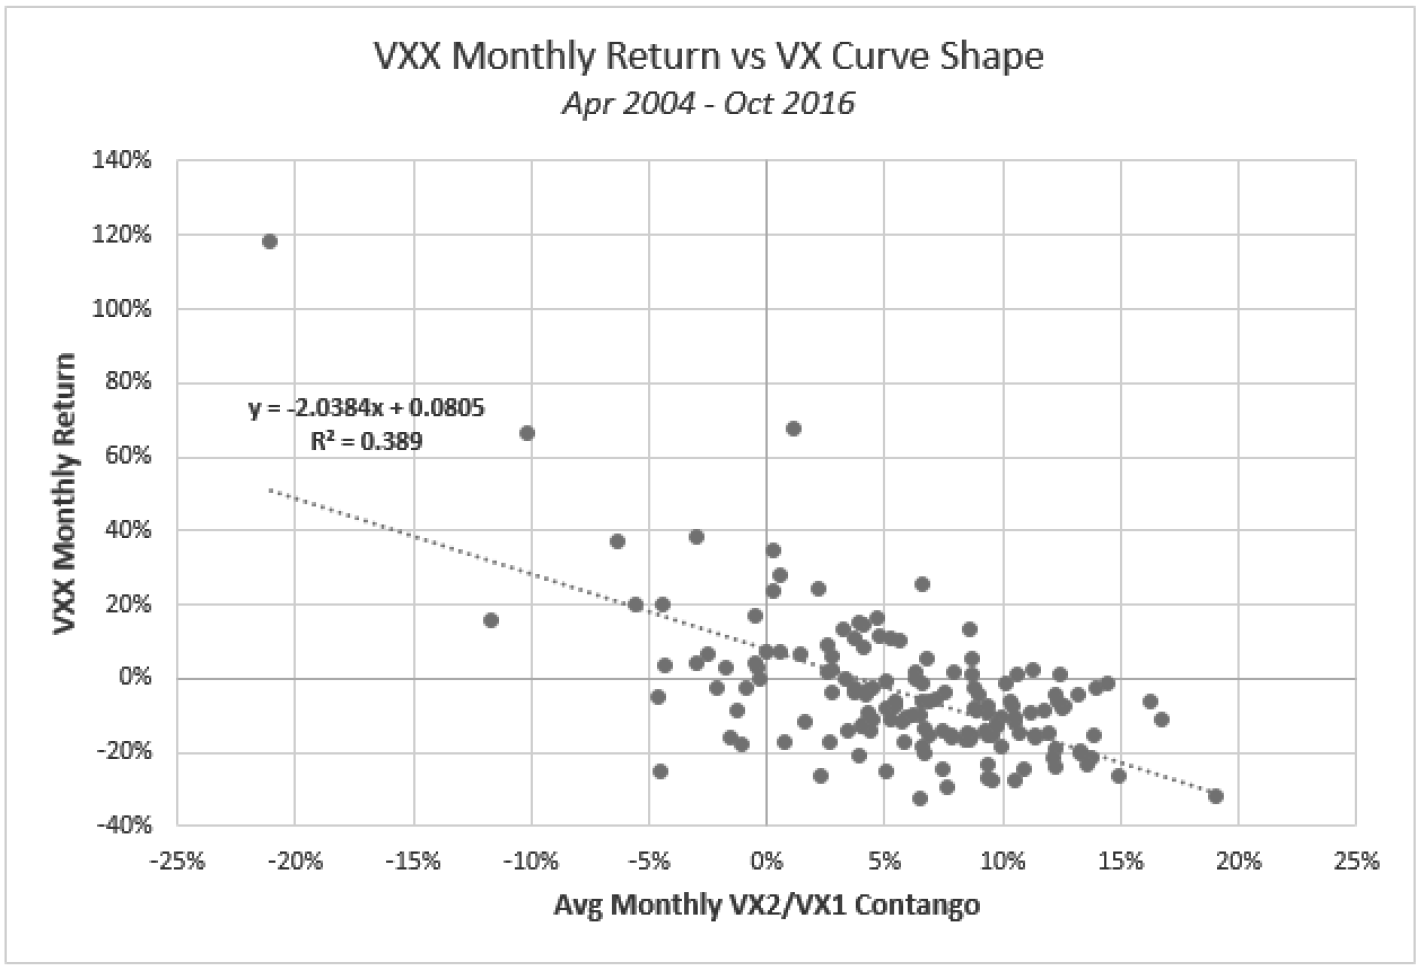
The financial market equivalent of a forest fire is an inversion in the VIX term structure. Inversions are caused by high demand for equity hedges (S&P 500 Index options) that drives the price of near-term volatility above longer-term volatility. This occurs because longer-dated volatility pricing typically is anchored by the strong tendency of the VIX index to revert to its long-term average of about 20. This can be seen in the historical ranges and median values in the VIX futures. The farther out the curve, the closer the median values cluster around 20, and the tighter the range around that median (see Figure 14.5).
Since VIX futures were listed in 2004, an inverted VX curve has been the “gateway” to a crisis; while not every inversion has led to a crisis, all major crises have started with an inversion (see Figure 14.6). This fact makes the VIX curve a logical place to look for a tactical signal to apply crisis alpha strategies. While there are many variations, the general approach for this signal is to monitor the price of the VIX index relative to the various VIX futures or among the VIX futures themselves. Whether in real-time or on a slower time frame, an inverted term structure flagged by this calculation would then indicate that a hedging position in VIX futures or options is warranted.

Aside from its benefit as a timing signal, an inversion turns the typical cost of carry on its head. While the curve is inverted, time is a benefit for long VIX positions as the underlying futures are pulled up toward the VIX index by expiration. In a true crisis, as panic rolls from one asset class to another, keeping the VIX elevated for an extended period, this can be a substantial ‘wind at the back’ for crisis alpha positions. Under this scenario, the term structure can indeed make the VIX ‘cheap’ to own, even at 20 or higher.
Pros
Past equity panics have been characterized by a rapid fall in equity indexes such as the S&P 500. The rapidity of decline in combination with the magnitude can cause large moves upward in near-term volatility as market participants struggle to price in new and rapidly changing information. This period of acute uncertainty can be very profitable for a long volatility position as the rapid rise in VIX combined with the tail wind from the inverted term structure can result in an exponential rise in VIX futures prices. As an example, the S&P 500 Short Term VIX Futures Index returned +334% in the 59 days from August 29, 2008 to its peak on November 20, 2008.
Cons
VIX futures term structure inversion is a process; it takes time to manifest itself and is almost always accompanied by some degree of equity market (S&P 500) drawdown prior to inversion. With this understanding, hedging using VIX term structure will almost always be late compared to ‘always on’ hedges.
High volatility periods and VIX futures curve inversions are an iterative process that develops over days and weeks. “One-off” shocks like the Japanese earthquake and tsunami or the “Flash Crash” in May 2010 can cause large spikes in the VIX index, but are usually transitional and do not lead to inversion beyond a few days. For an investor using inversion as a hedging signal, this leaves the portfolio unhedged at the beginning of most equity drawdowns and subject to false signals.
Approach 2: Low Cost-of-Carry Options Structures
Investors looking for a protective position at all times must be aware of the cost of protection. A cost-conscious position with explosive return characteristics is a VIX 1x2 call spread. Specifically, this position is created by selling 1 out-of-the-money call option to buy 2 further out-of-the-money call options. Typically, the goal is to search for strike price combinations resulting in a very low up-front cost or even a credit in some circumstances.
The VIX backspread is an explosive position if owned prior to a large move higher in volatility. With this position, you are long not only the price/level of volatility but also the ‘volatility of volatility’ (VVIX index) as seen in Figure 14.7. The cost of this position will therefore be highly dependent on the implied volatility level in VIX index options themselves (the VVIX index) as well as the distance between strike prices.

Pros
Due to its explosive potential when the VIX and VVIX index spikes, this position has been described as “banging two sticks of dynamite together.” Once a spike in volatility occurs, you also have flexibility to convert the backspread into a butterfly by selling an even further out-of-the-money call, collecting additional premium while holding the position. The position can also be customized by adjusting the distance between strikes to suit your particular outlook or capital requirements.
Cons
This position has margin requirements that need to be taken into consideration before entering it. The August 2015 scenario laid out also demonstrates that this position needs to be managed and adjusted if a volatility event occurs. This is not a “set it and forget it” type of trade. You can lose money in this position if the VIX index settlement ends up above the short strike, but below the long strike.
Exit Strategy
The benchmarks of a high-quality hedging strategy are not only its performance during times of equity market drawdowns, but your ability to know when to stay on the sidelines and when to take profits. Given the historical tendency of equity markets to rise over time, cost minimization and profit-taking are key to a successful crisis alpha strategy.
While VIX futures curve inversion may be a satisfactory entry signal, waiting for full VIX futures curve normalization is not recommended as an exit condition, as this will generally result in a ‘round trip’ or reversal of any profit from a long volatility position. Systematic profit-taking and position reduction based on levels of the VIX index or stages of curve normalization may provide a more effective way to monetize successful hedge positions. Profit taking based on the duration of term structure inversion may also be advisable. For context, the crisis periods of Fall 2008 and Fall 2011 saw the two longest periods of VIX futures term structure inversion in history, both persisting for about a calendar quarter. A more typical inversion would tend to last only for a matter of days or weeks.
The high VIX index levels benefitting crisis alpha strategies are rare and only provide a brief window of opportunity when they occur. High VIX levels sow the seeds of their own destruction as market participants incorporate new information and market movements fail to justify investors’ worst fears. For example, to sustain a level of 40 on the VIX index, equities would technically need to have a daily trading range outside of +/–2.5% in 10 of the next 30 trading days, an exceedingly rare occurrence in stock market history. In the long run, markets are adaptive systems that are not surprised by the same information twice.