7 
Deciding about Anything Approach
AGREE ON THE WHY BEFORE THE WHAT
Frequently you discover that people have similar purposes, values, and criteria, and yet they cannot agree. Why? People cannot agree because they have different priorities. For example, when choosing a new car, everyone values appearance and clean air. Yet while some prefer an aesthetically attractive appearance more than power efficiency, others may be unwilling to sacrifice their concern for carbon displacement, preferring a hybrid, even if an affordable hybrid for them looks less fashionable.
Significant business decisions are much more complex than personal vehicle decisions. This chapter shows you how to forge consensual decisions by developing purpose, options, and decision criteria. This chapter also provides another dozen Tools to guide you through simple, complicated, and complex decision-making for any type of group, organization, or situation.
Decision-Making Options
While there are highly elaborate forms of voting and authoritarian decisions, three forms of decision-making dominate the business landscape:
- Authoritarian—decision made by a sole source such as a person or group
- Voting—formal or informal; used when the leader is incapable or lacking the time or knowledge required to build consensus
- Consensus—an interactive method particularly helpful when the deliverable is complicated, or an elevated level of commitment and ownership is required of the participants to yield successful results
Voting Sucks
Eric Maskin and Amartya Sen considered Kenneth Arrow’s Impossibility Theorem, which established a series of mathematical proofs based on Condorcet’s work. Suppose a nine-person leadership team that wants to cut costs looks at three options: (a) closing plants, (b) moving from a direct sales force to distributors, and (c) reducing benefits and pay.1
While any executive can rank their preferences, it is mathematically possible for a majority to simultaneously support each alternative. Five members might prefer “closing plants” to “moving sales to distributors” (a > b), and a distinct set of five might prefer “moving sales” to “reducing benefits and pay” (b > c). Through the transitive property, “closing plants” should be preferred to “reducing benefits and pay” (a > c). The paradox is that five members could rank “reducing benefits and pay” over “closing plants” (c > a).
Maskin and Sen demonstrate that no voting method—neither allocation of points nor rank-ordering of choices—will generate a shared favorite. Although this concept is frequently understood in political science and economics, it is rarely acknowledged in organizational management. Understanding the paradox of the impossibility theorem improves the likelihood that you will build consensus, because the theorem proves that the best decision might not be anyone’s favorite.
Three Requirements for Any Decision
Whether you are deciding which new software to use, which product to develop, or which corporate acquisition will be your most valuable target, three building blocks are required for all decisions, simple (personal) and complex (consensual).2
- Purpose of the object (for example, vehicle, product, or corporate acquisition)
- Options3
- Criteria
- Testing (optional but encouraged)
PURPOSE OF THE OBJECT
Even if you purchase a new shirt or blouse, you first determine why. Your purpose has a significant impact on deselecting. If you need a T-shirt for exercising, you won’t be looking at dress shirts with French cuffs. Conversely, if you plan to attend a formal wedding, T-shirts are not an appropriate style to consider.
OPTIONS
For a new blouse, brick-and-click retail establishments provide lots of options—in the store, racks and retail displays of products, and online, page after page of shirts and blouses. How do you decide? If you visit a store, you may even take less shopping time than you will online. Why? Because there are fewer options in a store to consider than when you shop online.
CRITERIA
At the same time you will consider your selection criteria. For a standard T-shirt, you may consider features such as availability, brand, color, country of origin, fabric, quantity, price, size, style, weave, and so on. The human mind integrates all your decision criteria into one sparkline representing the optimal profile you seek.4
If the shirt or blouse on the shelf or your screen has an identical sparkline, the deal is done. Since this rarely occurs, you evaluate the variances. When you are assessing, you also allocate value according to the relative importance or weighting of your criteria, thus complicating your decision further.
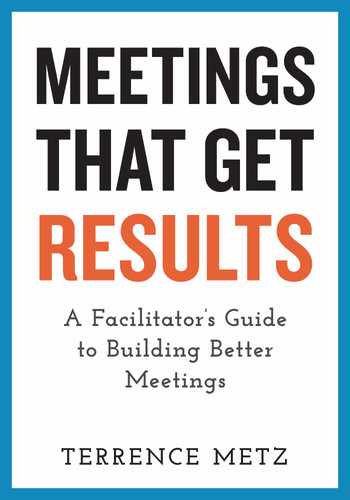
As implied by the sparklines in figure 7.1, availability for the dress shirt is much more important. There is a sense of urgency and timing for the wedding rather than the immediate need for another T-shirt. The brand of the dress shirt is also more important than the brand of the T-shirt, although brand is much less important than size for both shirts. There’s more price sensitivity to the T-shirt, meaning that you are willing to pay more of a premium for the dress shirt than the T-shirt. And since the style of most dress shirts remains similar, the T-shirt style is more important since you may want to avoid a V-neck or tank top.
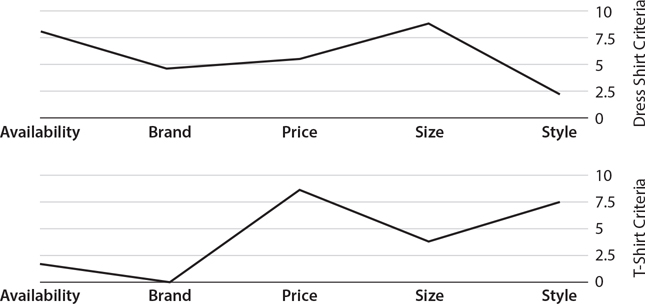
Figure 7.1. Large-Scale Sparklines of Shirt Profiles
NOTE: Personal plans and decisions (such as purchasing a new shirt or blouse) are both simpler and more concrete than business plans and decisions (such as launching a new product) that are more complex and abstract. However, both require the same three components to test for decision quality.
Two Scenarios
SCENARIO 1: NEW CLOTHING
Suppose you are making an individual decision, let’s say some type of clothing, although it doesn’t really matter because any decision-making requires all three components: purpose of the object, options, and criteria.
Deliverable
A decision about some object (for example, a shirt or blouse to buy).
Procedure
Although it happens so quickly as to be transparent to you, even for simple purchases, your mind will hastily consider purpose, options, and criteria. Therefore, to build consensual decisions around straightforward business decisions, use the seven Agenda Steps provided.
SCENARIO 2: RETIREMENT GIFT
Suppose you are asked by your leader to conduct a meeting and make a decision about what gift should be given to a valuable individual who is retiring. Since the example is both concrete (physical) and straightforward, the same Basic Agenda below works perfectly.
Deliverable
A decision about a retirement gift with budget of US$500 to be presented at a retirement party on October 1, 20__.
Procedure
Adapt, leverage, or modify the seven Agenda Steps below.
NOTE: Adapt or modify this Deciding Approach whenever your group needs to prioritize or make a consensual decision. What changes will be the Tool you use to analyze your options against the criteria. This chapter provides nine new Tools to consider.
BASIC AGENDA
- Launch (chapter 5)
- Purpose of the object (for example, shirt or blouse, or retirement gift)5
- Options (for the objects)
- Criteria (about the objects)
- Deselection and Decision (prioritization)
- Testing (for decision quality)
- Wrap (chapter 5)
NOTE: A quick comment on sequencing—indeed, you can invert the agenda sequence and build criteria before options. In fact, most untrained groups usually begin with criteria; here’s why.
They claim that starting with criteria is faster because you do not waste time on ideas that fall outside the parameters of the criteria. However, they also concede that the “answer” they develop is constrained and produces a result that is not innovative—a decision that remains “in the box” rather than outside of it.
My structured method suggests beginning with options when you seek innovation or breakthrough. Far-fetched ideas can lead to a practical alternative that no one thought of before. As a gift idea, a “trip to Tahiti” could lead to “digital binoculars for bird-watching” that no one considered until they deliberated about the question, “Why Tahiti?”
In addition, I am fastidious about the rules of Brainstorming, so while enforcing high energy, I do not permit any discussion during the Listing activity.6 If groups maintain high energy only for 6–8 minutes, then the most amount of time wasted is 6–8 minutes, yet I’ve increased the likelihood of an innovative result.
Visual Aids to Anticipate
- Meeting purpose, scope, and deliverables in writing. Use handouts or large-format paper for in-person meetings and optimally a handwritten and handheld artifact for online meetings.
- Basic and easily accessible agenda (included in the pre-read)—also a suitable candidate to use as an artifact for online meetings.
- Definitions for each of the key terms, especially Options, Criteria, and Testing.
- Ground Rules (chapter 4), readily available as a poster or as a handheld artifact.
- PowerBalls (chapter 7) and Prioritization legends (chapter 7).
- Scorecard or Quantitative TO-WS Analysis spreadsheets (chapter 6).
- Parking Lot and Plus-Delta (chapter 5).
1. Launch (Introduction) Agenda Step
Follow the seven-activity sequence for the Launch, which is fully explained in chapter 5. Keep in mind that the Launch is the “preachy” part for a meeting facilitator. My own Annotated Agenda for the Launch is always around three pages. If you want to rehearse anything, try explaining the white space behind your Agenda Steps—a terrific opportunity to develop confidence among your participants.
NOTE: For multiple-day workshops, cover the same items at the start of subsequent days. Additionally, review content that was built during the preceding day or days and reinforce how that relates to the progress being made toward completing the deliverable.
Before you begin your meeting Launch, have your physical or virtual room set up to provide a visual display of the meeting purpose, scope, and deliverable. Let me repeat that if you do not know what the deliverable looks like, then you do not know what success looks like.
PROCEDURE
Follow these activities in this sequence for a robust start.
- Introduce yourself and stress the importance of meeting roles. Stipulate how much money or time is at risk if the session fails.
- Unveil your meeting purpose, scope, and deliverable. Seek audible assent from all. Ensure that all the participants can support them.
- Cover “administrivia” to clear participants’ heads from thinking about themselves, especially their creature comfort. Explain where to locate lavatories, fire extinguishers, emergency exits, and other stuff they may be thinking about. Provide a check-in activity or icebreaker, especially for online meetings and workshops.
- Carefully explain the logic behind the sequence of your Agenda Steps. Explain how Agenda Steps relate to one another. Link Agenda Steps back to the deliverable so that participants see how completing each Agenda Step provides content that helps complete the deliverable.
- Share Ground Rules (chapter 4). Supplement your narrative Ground Rules with audiovisual support, including humorous clips, but keep them brief.
2. Purpose of the Object
The purpose of the object (gift, shirt, or business object) establishes the why before the what.
DELIVERABLE
A run-on sentence, 50 words or less, that describes the general purpose, reason, and rationale for the object. This may include some benefits and features but is not likely to include all of them.
RELATIONSHIPS
The purpose of the object establishes the foundation for the decision and enables trade-offs and prioritization. If the object is a gift and the purpose is to provide a gag gift, the decision will be entirely different, based on the purpose, not on the options or criteria. If the object is a shirt for a mud race, expect a decision different from a decision about a wedding shirt, based on the purpose.
PROCEDURE
Use the Purpose Tool, fully explained in the next section. Optionally, consider substituting Breakout Teams (chapter 6), Creativity (chapter 8), Coat of Arms (chapter 6), and Categorizing (chapter 6) to yield a 50-word (or shorter) expression that everyone supports.
In addition, I’ve included a wonderful transition Tool for Agenda Steps called the Clarifying Tool (chapter 7). In place of the overgeneralized question, “Can we move on?” substitute the Clarifying Tool, which confirms clarity, deletions, and additions by asking three discrete questions, before moving on to the next Agenda Step.
CLOSURE
Once the group is comfortable with the stated purpose of the object, apply your analogy, and move the agenda indicator for a smooth transition.
Purpose Tool
Understanding why is so critical to building consensus that it needs to be listed as a separate Agenda Step, even though it may take less than 10 minutes to accomplish. Use the Purpose Tool to construct a basic requirement7 (I want X so that I can do Y) or to build consensual expressions that capture the benefits, intent, purpose, and reason for any scope of work.
This Tool is perhaps the best Tool in this book that you did not know about previously.
The Purpose Tool provides the group a consensually built foundation to reconcile arguments—and help galvanize consensus around the criteria, prioritization, and decision-making that follow.
PROCEDURE
Either on one or two separate easels, or a split screen, build out the visual prompt in advance. Because the prompt itself is context and not content, use a nonprimary color: “The purpose of [insert object] is to. . . So that . . .”
- Prompt your participants: “The purpose of [insert object] is to . . .”
- Do not forget the word “to” because it forces a verb (an action).
- Maintain cadence. As you are scribing, if the room is silent, as you print the last word, prompt quickly with “so that. . . ,” because you want to keep the energy high.
- I frequently say, “Why else do you want ____?” since this is the why before the what. You may also consider the “so that . . .” as the benefit or value-add.
- Use commas when you capture input as you are helping participants to build one long run-on sentence.
- Do not allow arguments whether something belongs in the “purpose is to . . .” section or the “So that . . .” section; in a run-on sentence, it does not matter where the clause is located.
- Likewise, do not allow arguments over whether something belongs at all. If one participant’s purpose is X and another’s purpose is Y, then the integrated purpose is X and Y, not X or Y. Be prepared to emphasize and defend this advice. If my purpose for the shirt is comfort and your purpose is style, than our integrated purpose is both comfort and style. We’ll solve for how to accomplish both later.
- Do not wordsmith the results, but be certain to reread, review, and confirm that participants have created an expression that everyone can support. You have now created a strategic plan at the level of a business area or process or activity—why something is important.
- Refer to this statement during the meeting as an appeal to ensure that contributions support the purpose. If necessary, either take out-of-scope conversations and ask that they be placed in the Parking Lot (chapter 5) or go back and modify the purpose expression to include their concern.
Clarifying Tool
The Clarifying Tool makes it easy to clear up ambiguities that can impede progress.
WHY?
I have seen participants who were in violent agreement with each other but were using different definitions for terms or defined the same term differently. Additionally, and counterintuitively, we should slow down during transitions when most participants get confused. The Clarifying Tool helps in those situations.
PROCEDURE
“Scrubbing” means cleaning or clarifying input and any unedited lists or content:
- What, if anything, remains unclear about ____________? (clarity)
- What, if anything, needs to be removed from ____________? (deletions)
- What, if anything substantive, needs to be added ____________? (additions)
NOTE: The last question does not ask for “anything.” Rather, it speaks to something substantive—important or critical. Asking a group of smart people, “Is anything missing?” will usually result in something, typically with low-value yield.
3. Options (for the Object)
DELIVERABLE
A list of options, the myriad of objects from which to choose. Depending on the situation, these could range from a few (for example, half a dozen) to many (dozens). Use the Definition Tool (chapter 6) when a description of the option remains too vague to confirm that everyone shares the same understanding about specific attributes, characteristics, or features of an option.
PROCEDURE
Use any of the Listing activities suggested with Brainstorming (chapter 6). Facilitate a quick and thorough Listing with no discussion. Encourage all ideas because my procedures are self-correcting and will eliminate options that are inappropriate or unacceptable.
For example, when deciding on a retirement gift for someone, permit ideas that may be clearly beyond the budget. The subsequent Analysis activity might challenge the reasons for mentioning “ridiculous” options. Their rationale may provide insight into new and potentially powerful options not previously mentioned.
For example, the idea of a trip to Tahiti may reveal that our retiree loves bird-watching, and while we cannot afford to give a trip to Tahiti, further conversation unveils a new gift idea—a pair of digital binoculars with a built-in camera. An ideal gift option that did not “walk into the room”—rather, it was created in the room.
Use Breakout Teams (chapter 6), Creativity (chapter 8), and Perspectives (chapter 8) for generating additional options. The options for business decisions are rarely found on a shelf, so be prepared to inspire and stimulate your participants with Warm-ups (chapter 8). More ideas equate to higher-quality decisions, and when we apply decision criteria during the Deciding Agenda Step, suboptimal ideas will be eliminated.
CLOSURE
Once the group is comfortable with the list of options, apply your analogy and move the agenda indicator for a smooth transition. Remember, set this list aside and do not begin to talk about it or define items yet. We are still in a Listing mode, although next we will list the decision criteria.
4. Decision Criteria (for the Object)
DELIVERABLE
The result is a list of decision criteria, well defined and prioritized. Depending on the situation, these could range from a few (for example, half a dozen) to one or two dozen.
RELATIONSHIPS
Decision criteria capture the reasons for deselecting or getting rid of poor options. Whether you rely on narrative, graphic, or illustrative input, list decision criteria first and then Clarify (chapter 7) or use the Definition Tool (chapter 6) before you prioritize the decision criteria.
NOTE: Please don’t fall into the trap of prioritizing your options. First, you need to prioritize your decision criteria. Then, you will apply prioritized decision criteria to your options. When buying a shirt or a blouse, size is especially important and usually has a higher priority than material or weave—so size is a prioritized decision criterion. Begin the Analysis activity by prioritizing decision criteria.
PROCEDURE
While engaging in some Listing activity associated with Brainstorming (chapter 6), do not mandate or enforce that “all ideas will be allowed.” Here we are restricting ourselves to appropriate reasons. Embrace the sense of “no discussion,” but also confirm appropriateness if there is any doubt.
Some assumptions may be brought into the scenario that also function as decision criteria. Using the retirement gift example, budget and timing must be respected as high-priority decision criteria. The organization may also issue other mandates such as the need to include the company logo on the items selected.
NOTE: A decision about the retirement gift might include more than one item. See the SCAMPER Tool (chapter 8) for additional questions to ask.
Use Breakout Teams (chapter 6), Categorizing (chapter 6), and Perspectives (chapter 8) for generating additional decision criteria. With Breakout Teams, when more than one team returns with the same or similar criteria, consensus becomes (almost) automatic. Use the Definition Tool (chapter 6) when there appears to be misunderstanding about any specific attributes, characteristics, or features of the decision criteria.
CLOSURE
Once the group is comfortable with the decision criteria, apply your analogy, and move the agenda indicator to Deciding for a smooth transition.
5. Deselecting and Decision
DELIVERABLE
The result is a consensually agreed-on decision, selection, or determination of the object (for example, a retirement gift).
RELATIONSHIPS
Deselecting and Decision smash together the options and decision criteria. One size does not fit all. Therefore, in the pages that follow, I will look at seven Tools to guide you from simple decisions through complicated ones and even complex decisions. Additionally, you can use the PowerBalls Tool (chapter 7) to make the other Tools more effective.
NOTE: The word “decide” comes from “to cut off,” from de (“off”) and caedere (“to cut”).
PROCEDURE
If an apparent consensual decision has not become evident or has not been promoted by someone immediately:
- Eliminate any options that do not satisfy mandatory requirements such as not exceeding budget.
- Eliminate any options participants personally object to after they give specific reasons for their objection and those reasons are considered valid by others. Once everyone has rejected their own personal “pet peeves,” then technically you have consensus, although you don’t yet have your decision or deliverable.
- By deselecting we are eliminating objectionable options and can optimize the decision even further by using a tool for applying prioritized decision criteria to the surviving options.
Numerous Tools are appropriate for prioritizing depending on the type of qualitative or quantitative Criteria. Let’s look at prioritization Tools, beginning with simple situations, next more complicated situations, and finally complex situations (see figure 7.2).
Simple Criteria: Use PowerBalls or Estimation
The simplest and most frequently used PowerBalls Tool (chapter 7) provides quick support, especially for deselecting. Keep in mind that it is quicker to get a group to deselect, making it easier to focus on the best candidates.
CAUTION: Do not use PowerBalls without using Bookend Rhetoric (chapter 7).
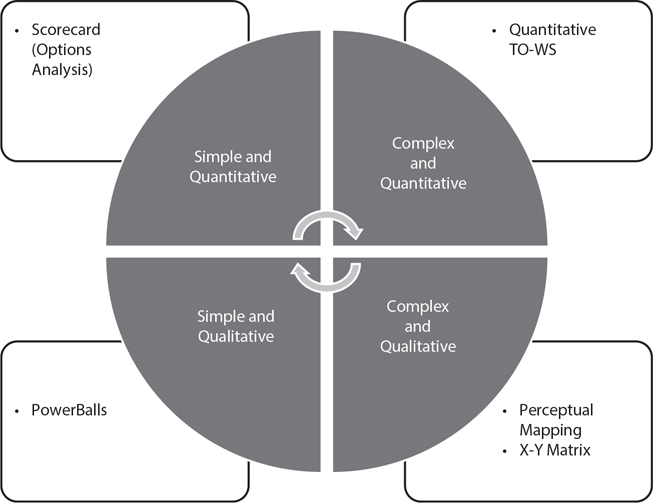
Figure 7.2. Prioritization Tools
Complicated Criteria: Use Decision Matrix or Weighted Scorecard
When the basic PowerBalls Tool is insufficient alone, particularly when there are dozens of Decision Criteria or many of the criteria can be assigned quantitative values, consider the Decision Matrix or Scorecard Tool.
Complicated Criteria: Use X-Y Decision Matrix
Whether we take the time to build a comprehensive Decision Matrix (chapter 7) or not, decisions could be arrayed on a single sheet or slide that compares each option with each criterion. We can use the PowerBall Tool to ascertain the degree of impact each Option provides against each criterion. When you have spent most of your time in a management meeting on one slide in your deck, the Decision Matrix is that slide.
Complicated Criteria: Use Weighted Scorecard
The Scorecard Tool (chapter 7) may be an entire meeting by itself. It may also fail to yield “the decision.” However, it builds solid consensus around what not to select. By eliminating some of the options, your group can focus on the best options by appealing to some of the subjective criteria (for example, “strategic fit”) or even taking a “test drive.” Information technology groups isolate the best candidates to test, avoiding the time and expense of testing marginal options. As if you were purchasing a new vehicle, the Scorecard Tool helps generate the top three to five candidates that you might want to test drive further, without being required to drive dozens of vehicles (or middleware applications).
Complex Criteria: Use Perceptual Map
When your situation remains too complicated for the PowerBalls Tool and yet most of your criteria remain qualitative and abstract, array your options within Perceptual Maps (chapter 7). Yes, that’s plural. No law prohibits you from building more than one Perceptual Map. Consider using the PowerBalls Tool to isolate the most critical decision criteria and then transpose them to numerous two-by-twos so that you can visually compare your options.
With Perceptual Maps, groups can leverage pattern analysis. You are not restricted to one Perceptual Map; when you build multiple maps, patterns appear that make it easier to secure consensus:
- Weak candidates consistently show poorly and therefore are eliminated, frequently without any further conversation.
- Strong candidates reappear, and when you get a group of smart people to focus on the same thing at the same time, magic happens. You can discover a cure or get to Mars faster than you ever thought possible.
Highly Complex Criteria: Use Quantitative TO-WS Analysis (Chapter 6)
An approach that helps analyze dozens of internally controllable Strengths and Weaknesses against dozens of externally uncontrollable Opportunities and Threats, empowering groups to prioritize hundreds of options.
Highly Complex Criteria: Use Real-Win-Worth
When your situation becomes extremely complex, understand the logic, and then adapt the questions recommended for a Real-Win-Worth (chapter 7) analysis. It includes three stages to minimize wasted time. In sequence, Real-Win-Worth analysis helps you understand . . .
- Is the solution, decision, product, or project Real? (if not, go no further)
- Given the solution, decision, product, or project, can we Win? (if not, go no further)
- What is the solution, decision, product, or project Worth?
CLOSURE
Once the group is comfortable with its decision, apply your analogy, and move the agenda indicator to Testing to ensure decision quality and thus avoid the worst deliverable from any meeting: another meeting.
NOTE: If all these Tools fail, take a break. Regather. Resuscitate. Rejuvenate. Gestate. During the entire history of humankind, it has never been recorded that a meeting participant was disappointed when the leader said, “We’re going to take a break.” Alternatively, refer to the four activities for Conflict Management (chapter 4), based on appealing to your organizational objectives.
PowerBalls Tool
PowerBalls are truly powerful. They transport iconic, narrative, and numeric meaning and intent. They are simple to use and highly flexible. In fact, they are used within a variety of other tools such as Alignment and Decision Matrix.8
WHY?
PowerBalls help a group quickly and simply prioritize, using the Pareto principle (also known as the 80-20 rule) to help a group deselect and eliminate as many options as quickly possible. Deselection helps the group stay focused on the most important or commanding options.
CAUTION: The most effective tactic suggests that you should first and always prioritize your decision criteria, before applying them to options. Untrained facilitators prioritize options and not decision criteria—oops!
You can remedy this faux pas by reverse engineering. Why did each option receive its ranking? The answer yields decision criteria, the driving force behind decisions.
PROCEDURE
PowerBalls are flexible instruments for measuring anything. For simple decision-making, use the following activities:
- Establish the purpose of what the team is doing (for example, using the Purpose Tool in chapter 7).
- Build a list of options (for example, Brainstorming, chapter 6, and Categorizing, chapter 6). Set the options aside.
- Build a list of criteria (be prepared to further define specific criteria).
- Look at the criteria to see whether any options are in violation. For example, if Sally is allergic to flowers, then “buying her flowers” is an option we should eliminate (if we want to show appreciation).
- Ask the participants if they can support the remaining options. If someone objects, then eliminate that Option once the group understands and accepts their rationale. Once everyone can support the balance, you have consensus (but not a deliverable).
- To improve the quality of the decision, unveil a legend for PowerBalls and the accompanying definitions.
- –
 —High means “pay any price.”
 - –
 —Low means “want it free, not willing to pay extra for it.”
 - –
 —Moderate is the stuff in between, meaning we are “willing to pay a reasonable amount” (without being forced to define “reasonable”).
 - –
 —Null means “will not have” (only if it comes up)
- –
- The economic definitions listed here can be applied to all types of logic, for example:
- – Attraction versus repulsion (strong—weak—moderate)
- – Frequent versus seldom (frequent—rare—occasional)
- – Full versus empty (full—empty—half full)
- – Liberating versus restricting (free—constrained—compromised)—and so on
- Apply Bookend Rhetoric (next section) to isolate the one-third most and one-third least important criteria.
- Code or score the remaining one-third as moderate by default, without discussion (usually).
- Attempt to force-fit one-third of the candidates to each category—high, low, and moderate—but be flexible. When you take on more than one-third of either high, low, or moderate, reestablish balance by taking on slightly less than one-third elsewhere.
- Appeal exclusively to the high criteria and isolate the options that best support the high criteria.
IF THIS PROCEDURE FAILS
Using only the most important one-third (“pay any price”), indicate that some options now appear best because they strongly support the most important criteria. And yet disagreement might still result, so these are your next steps:
- For misunderstandings, further challenge, define, and discover the supporting rationale.
- You may need a tool more robust than PowerBalls, so begin another analysis activity with a Tool capable of managing more complicated situations.
- If the dynamic is highly political, use the four steps in Conflict Management (chapter 4).
SURROGATES OR SIMILARITIES
The Agile and Design Sprint communities (typically supporting product and project management) use similar logic with different legends.
MoSCoW
One mnemonic being used is MoSCoW; the letter o is irrelevant, but the consonants represent the following:
- Must Have

- Should Have

- Could Have

- Won’t Have

Traffic Lights
With similar logic, the traffic light style, frequently used in scorecards, uses colors instead of symbols whereby green signifies Go (good), red signifies Stop (not good), and yellow signifies Caution (needs modification or be wary).
Bookend Rhetoric Tool
Effective facilitators shy away from analyzing lists in a linear, top-down manner. Bookend Rhetoric imposes a natural habit of squeezing the gray areas toward the middle, rather than wasting time on the least important stuff.
The Bookend Rhetoric Tool is perhaps my favorite Tool because it’s powerful, effective, and will get you DONE fast.
Groups tend to argue about gray areas (“moderate importance”; “pay a reasonable amount”) and frequently the moderate factors have little to no impact on decision quality. For instance, with PowerBalls (chapter 7), you can envision some participants arguing about whether something is more than moderately important but less than highly important. I know from experience that the extreme criteria (high and low) drive decision quality, so Bookend Rhetoric helps me identify the most important criteria quickly.
When untrained facilitators start in a linear fashion with the first item and ask whether something should be categorized as of high, medium, or low importance, they end up with a list that is 80 percent high. The list becomes less valuable, not more. We should concede that items on the list all represent the most important considerations, but that a few items are slightly more or less important than the others. So we can turn to the Bookend Rhetoric Tool for help sorting them.
PROCEDURE
When your cleanly defined list of criteria needs prioritizing, compare and contrast different items with the precise questions detailed here, moving from one end to the other and back:
- Ask, “Which of these is the most important?” (Code the answer with the filled circle PowerBall icon.)
- Next ask, “Which of these is the least important?” (Code the answer with the empty circle PowerBall icon.)
- Then return to the next most important.
- And next return to the next least important.
- – Return and repeat until the list has been two-thirds scored. Code the remaining one-third as moderate by asking the group, “Will you lose any sleep over making the remaining moderate?”
NOTE: Always ask in the singular: “which is,” not “which are.” When two or more participants speak at once, be prepared to take them all. In advance, divide the list quantity (N) by three. You are seeking three evenly distributed buckets. However, you can be flexible and reestablish balance if forced to add an additional “high,” for example. With 12 criteria, we are seeking three buckets with four per bucket. If forced to add a fifth bucket, we simply offset that with three in one of the other buckets.
If force-ranking, apply the highest available number followed by the lowest available number and repeat until each ranking number has been used.
- If comparing or contrasting illustrations, consider these questions:
- – Which is most similar?
- – Which is least similar?
- For general conversations, ask opposing questions:
- – What is your greatest strength?
- – What is your greatest weakness?
NOTE: I do not encourage the use of one-quarter or three-quarter PowerBalls, but remain flexible, if doing so will mitigate an argument and get us back on track. Likewise, I don’t encourage “null,” but you should know what to do if participants say they “will not have” some option.
If needed, here is a five-level list of PowerBall options, plus null:
- High importance
- Low importance
 Moderate importance
 Moderately high importance
 Moderately low importance
 Null or will not have
Decision Matrix Tool
WHY?
The Decision Matrix supports decision-making at every level in the holarchy, from the organization through project and product teams. The Decision Matrix can be viewed as the “logic” behind all decisions. It provides the reasons and explicit support behind selecting or deselecting the options. In a portrait format, when there are more options than criteria, the options are listed vertically (Y-axis), and the criteria arrayed horizontally (X-axis). In a landscape format, or if there are more criteria than options, the largest group is arrayed across the X-axis horizontally and the smallest group is located on the Y-axis vertically.
PROCEDURE
Once the Purpose of the Object (chapter 7) (or of the topic) has been agreed on, use Creativity (chapter 8) or narrative Listing to develop the options being considered and the criteria to evaluate the options. By applying PowerBalls and carefully wording your questions, you can now assess the impact of each criterion on each of the options with a straightforward, yet powerful matrix.
For example, if we want to know which sports to target in a marketing campaign, we might develop two lists and populate the matrix as shown in table 7.1. At the intersection of each criterion and option, precisely recite the following question: “To what extent does X impact (or affect, support, and so on) Y?” From the example in table 7.1 we might determine that from the perspective of a sports drink company, basketball captures a much more desirable marketing profile than curling, even if we know nothing about either sport.
CAUTION: Avoid asking the close-ended question “Does X involve Y?” There is always a subject matter expert who can establish a correlation when you use a close-ended question. We are not seeking an answer to the question “Does it?” Rather, we are seeking the degree, intensity, level, or extent that it does.
BENEFITS
Provide your executive sponsor or steering team with a Decision Matrix that renders visual support for your decisions. This iconic Tool preempts the common question, “Why did you select X?” The Decision Matrix displays the rationale and trail of logic. If executives want to change the decision, the Decision Matrix forces them to share their logic, enabling your team to become more consistent with their subsequent decisions by basing them on the updated or refreshed rationale from the executives.
Table 7.1. Decision Matrix: Which Sports to Target?
Criteria/Sports Examples |
Sweat (Dehydration) |
Participant Growth |
Online Audience |
etc. |
Curling |
|
|
|
|
Basketball |
|
|
|
|
Tennis |
|
|
|
|
etc. |
|
|
|
|
Scorecard Tool
COMPLICATED DECISIONS
Criteria are used to evaluate lists of ideas or options and may be used to prioritize lists or select one or two items from a list. Robust criteria are difficult to develop. The depth of criteria makes the difference between a high-quality decision and a questionable one.
WEIGHTED CRITERIA
A criterion provides a factor against which you can objectively assess options. For example, in buying an automobile, one would look at criteria such as air-conditioning, city gas mileage, heated seats, and styling. Each needs to be considered. A criterion is most effective when it is well defined and a clear, objective set of numeric values can be determined.
Criteria may be drafted ahead of time or developed in the meeting. If drafted ahead of time, list those criteria and check with the group to ensure that participants understand the criteria clearly.
There are three tests (scrubbing) for advancing consensus:
- First, do participants understand the criteria? (validity)
- Can participants support the criteria? (relevancy)
- Which substantive criteria are missing? (omissions)
PROCEDURE
To develop criteria in the meeting:
- Start with a clear and finite set of options to apply the criteria; if you don’t have this yet, use the Listing activity of Brainstorming (chapter 6) to create options the group will consider.
- Next list criteria that participants consider valid and real—criteria participants intend to use in supporting their decision. (Do not mandate SMART criteria when you are in the initial Listing mode.)
- When you list criteria, participants will frequently offer subjective criteria (such as comfort). Do not immediately reject these. Ask participants what they care about, what they need to measure. With enough time and money, you can always find an objective measurement buried within subjective criteria (think Lean Sigma or Six Sigma).
- Scrub each criterion with the three tests (scrubbing) listed earlier. Before going further, make sure each scrubbed criterion is understood and accepted by everyone. In scrubbing, you may need to consider defining or categorizing similar criteria and deleting criteria that may be contradictory. For example, it may not be possible to require both a convertible and a traditional glass sunroof. If the group is uncertain, return to a specific criterion later. Do not allow one criterion to bog down your meeting.
- When scrubbing, apply one of the following icons to each criterion. There are several types of criteria, so explain your legend by posting a visual icon alongside each of the criterion types:
– Deal-breaker |
= |
|
(mandatory and binary, as in “yes” or “no”) |
– Desired |
= |
|
(desired and binary) |
– Fuzzy |
= |
|
(desired and subjective) |
– Scalable |
= |
|
(mandatory and measurable—note that most scalable criteria are also mandatory, but you should always prefer scalable to binary criteria). |
- Explain the difference between binary criteria, determined by whether something exists or not, on the one hand, and mandatory or simply desired criteria, on the other. For example, when buying a car, you might consider:
- – Air-conditioning (mandatory and binary requirement—the desired feature either exists [YES] or it does not [NO])

- – City gas mileage (mandatory and scalable, where more is typically better)

- – Run-flat spare tire (desired and binary—the desired feature either exists [YES] or it does not [NO] but it is not mandatory)

- – Styling (desired and subjective or fuzzy)

- – Air-conditioning (mandatory and binary requirement—the desired feature either exists [YES] or it does not [NO])
- Have the group confer and code each item as one of the four types. Carefully provide reflective feedback and confirmation to ensure that everyone understands the supporting rationale.
- Remember Definitions (chapter 6) and as appropriate, use separate flip charts to carefully define criteria that remain unclear or uncertain. As definitions are built, eliminate other criteria that can now be folded into the updated definition or more fully extract, define, and code new criteria that develop.
- Binary requirements are answered with yes or no. Validate each deal-breaker item
 and (one at a time) change binary criteria that are not mandatory to desired
  . In my vehicle example, a binary requirement may be “must have air-conditioning.” Create a final list of mandatory (deal-breaker) criteria to document as a separate list of mandatory requirements.
 - Do not mix binary requirements with scalable criteria. Either we are satisfied leaving a mandatory criterion as binary (yes or no), or we need to scale the criterion (what is the quantified capacity of the air-conditioning system?).
- For binary items that are optional or desired, but not mandatory, move them to a separate “desired” category that we will score later when combining them with the fuzzy or subjective criteria.
NOTE: Never merge binary requirements with scalable criteria. Binary criteria that are desirable but not mandatory need to be moved to the desired (not mandatory) category. The four types of criteria need to be separated (coded) to be effectively used. Please provide a visual legend to assist your participants with identifying which of the four types of criteria each item represents.
- Next apply the mandatory criteria list against the options (for example, a vehicle list) to see whether each option is available with the mandatory criterion. If not, eliminate the option.
- With the scalable items, stipulate the unit of measurement for each item. For example, with “gas mileage” the unit of measurement might be “miles per gallon—city.”
- Write the numbers 0 and 10 underneath each scale with the number 0 on the left edge of the paper and the number 10 on the right edge. Remember, bigger numbers (more) are better, although there are some reverse scales (less carbon emissions are better).
City fuel performance measured in miles per gallon (MPG)
![]()
- Fully document scalable items, challenging participants with questions like these:
- – What is the unit of measurement?
- – What are you measuring?
- – What is the source of your data?
- – What calculation would you use so that you and your grandmother would arrive at the same answer? Have the group define the values that correspond to 0 and 10—do not use subjective terms such as “slow” or “fast.” Ten is outstanding, and 0 is lousy. In the example, 0 may be “less than 10 MPG in city driving,” and 10 may be “greater than 30 MPG.” As 5 is midway between 0 and 10, so 5 would be equal to 20 MPG in my example.
- To build the scales, use the following questions precisely, and do not vary your rhetoric:
- – Measured in terms of , what is outstanding performance?
- – Measured in terms of , what is lousy performance?
City fuel performance measured in miles per gallon (MPG)
![]()
- After the scales have been built, gather actual values (above the line) for each remaining option.
- There are several ways to complete the scoring. You may use individuals, teams, and even overlap. Consider using Breakout Teams (chapter 6) based on business units, departments, discipline (such as technical versus business), or other meaningful categories. Complete the scoring and aggregate the scores. Select the best method to assign scoring instructions based on your resources, situation, and constraints.
- If individuals or teams score duplicates, you can make scoring comparisons to ensure that all the scores are identical. Then identify and analyze outliers that may be in error.
- Use examples (like those given here or your own analogy) to help illustrate. Within a business community, “importance to business” may be listed. However, counting how many people scream for something may be a poor unit of measurement. Counting how many corporate objectives are supported by an option may provide a better measurement of importance.
Weighting
We know that not all criteria are weighted equally. Weighting supports the rationale behind prioritization and helps to document assumptions.
PROCEDURE
- Start with the scalable criteria and the scores developed in the Decision Criteria Agenda Step. Remember, a score of 1 is lousy performance and 10 is outstanding performance. The scale is linear, and the midpoint can be easily calculated without violating neutrality.
- Bring the individuals or teams and scores together and collect the worksheets.
- Off-line or with the help of a documenter, calculate the scores, per criterion, for each option being prioritized and record on a group worksheet. Speed up the group activity by using an electronic spreadsheet.
- Next, without displaying the results, use the Bookend Rhetoric Tool (chapter 7). Have the group assign a weighting factor for each criterion. The weighting factor is based on a scale of 1 to 5. Again, bigger numbers are better. The most important criterion rates a 5, where more is better. Strive for balance so that you have an equal or approximate number of low, medium, and high priorities. Participants should be able to justify their weightings by appealing back to organizational, departmental, or product or project goals and objectives.
- Apply each criterion weight to the worksheet (see figure 7.3 for a blank scoring sheet). The spreadsheet will multiply the weight by the score and calculate a total for each criterion for each option (multiply the score for each criterion times the weight of the criterion).
Figure 7.3. Blank Scoring Sheet
- Sum all the criterion scores for each option. Display the results with the options force-ranked from highest to lowest scores, on a flip chart, handout, or screen.
- Ask the group to review the list. If participants feel compelled to alter or modify the results, have them justify the changes and document their reasons.
- Look for a natural separation (such as a line break) between the highest and lowest scoring groups. The lowest-scoring options should no longer be mentioned; they should be eliminated. Keep the conversation focused on the group with the highest scores, such as the top three to five options.
- I frequently stop here because we have painstakingly determined the absolute best options and can now conduct a test drive or go off-line to conduct further research on the limited few remaining options.
- If needed (no decision has been made yet) use the remaining desired and fuzzy criteria by taking the remaining options (the top three to five) and appealing to the most important desired and fuzzy criteria to guide a final decision (such as picking a stylish vehicle).
- Prioritize these criteria as high, medium, or low using PowerBalls (chapter 7), and compare the remaining options to the most important priorities. However, use the desired and fuzzy criteria only if absolutely needed—to help optimize a decision or solve for an impasse.
NOTE: This Agenda Step takes from 60 minutes up to four hours or longer. Defining clear, measurable criteria in advance will accelerate your conclusion.
Perceptual Mapping Tool
WHY?
To help a team compare and prioritize its options using graphical indication of prioritization, Perceptual Mapping helps convert qualitative factors into quantitative assessments. Use this Tool to solicit supporting arguments about how options should be ranked against criteria and which options may demand urgent attention or priority.
PROCEDURE 1
After you have helped the team build their options (actions to take), consider arraying them along the Payoff Matrix, criteria dimensions including the ease of implementation and the impact of the solution.
- If you have dozens of options, consider using a whiteboard or large wall display. You may want to use Postits because participant input will change and cause you to move them around, making frequent adjustments to the relative position of some options (the Post-it notes).
- Be careful to fully explain and define the “high” and “low” of each criterion, and to the extent possible draw from your personal analogy.
- Start in the middle, one axis at a time (holding a small Post-it note), and ask, “On this dimension, is the option more, less, or somewhere in the middle?” Use the same question on the second dimension, but do not ask about two dimensions at once.
- As you move in the direction of an existing Post-it note, add the following question: “Is it more or less than _______?” Here the team provides you with their “perceptional” or “relational” logic for placing the note.
- Use active listening and frequently challenge to find out what type of evidence can be used to support participants’ beliefs and claims.
- The illustration in figure 7.4 is called a “Two-by-Two” although it can be modified by adding a third, moderate range, making it a “Nine-Block Diagram” (figure 7.5).
- When you have lots of options (Post-it notes) crammed in one area, put a large “dot” on the Post-it to indicate precisely the point being mapped.

Figure 7.4. Payoff Matrix

Figure 7.5. Customer Loyalty Matrix
NOTE: For the matrix in figure 7.5, consider substituting “probability of success” for “implementation,” resulting in four new categories: “Quick Wins,” “Tried and True,” “Wild and Crazy,” and “Hail Mary Passes” (clockwise).
PROCEDURE 2
You can facilitate any custom Perceptual Map by doing the following:
- Identify the primary criteria that affect the decision or situation.
- Typically, you would arrange from low to high, but be prepared to define what is meant by “low” or “high.” See PowerBalls (chapter 7) for economic definitions (for example, “pay any price”).
- If you need to use a third dimension, such as quantity, then consider varying the size, shape, or color of the symbol by modifying your Post-it notes. Allow the notes’ color, height, shape, or width to equate to a third criterion or additional criteria.
PROCEDURE 3
The illustrative example in figure 7.6 requires ranking each stakeholder’s power to influence other stakeholders or control resources (horizontal) with their interest (vertical) or how much they care, to determine the most and least important stakeholders.
Real-Win-Worth Tool
WHY?
Real-Win-Worth (R-W-W) isolates the absolute best candidate (for example, process or product) using a three-stage screening process:
- How real is the opportunity?
- To what extent can we win compared with competitive options?
- To what extent is the opportunity worth doing?
I have long been an advocate of decision matrices; this Tool benefits from an assist from George Day.9
“The R-W-W screen is a straightforward but powerful technique built on a series of questions about the innovation concept or product, its potential market, and the company’s capabilities and competition.”—George Day
The R-W-W Tool provides objective scores but also requires expert reviews at each stage. If the idea is “great,” for example, but we cannot win—then there is no need to go further. Even if we have the capacity to win, if the concept is not worth much—there is no need to go further. As a consensus-building Tool, Real-Win-Worth provides a disciplined method for exposing assumptions while also identifying knowledge gaps (or areas of superiority).
Successful screening depends upon the quality of the questions you use. To arrive at consensual understanding using R-W-W, develop a robust set of detailed questions. Neither I nor George Day can tell you how to modify the basic questions listed here, so first understand their intent and then determine what modifications you need to make an informed decision during each of the three phases.

Figure 7.6. Stakeholder Power-Interest Matrix
PHASE 1: TO WHAT EXTENT IS THE OPPORTUNITY REAL?
Consider two critical vectors.10 Assess the feasibility of the product, service, or solution and the extent to which it is attractive (for example, to internal or external customers). Assess these vectors by exploring the dimensions they represent. Eight representative questions (dimensions) are provided in the illustration in figure 7.7. Rarely should the questions be posed as close-ended. Rather, by exploring the extent to which they apply, you will assess actual values across each dimension. Your most attractive options score higher relative to others.
TO WHAT EXTENT CAN WE WIN COMPARED WITH COMPETITIVE OPTIONS?
After determining the extent to which your customer demand and solution are both real, next assess your ability to succeed against competitive options. According to Day,
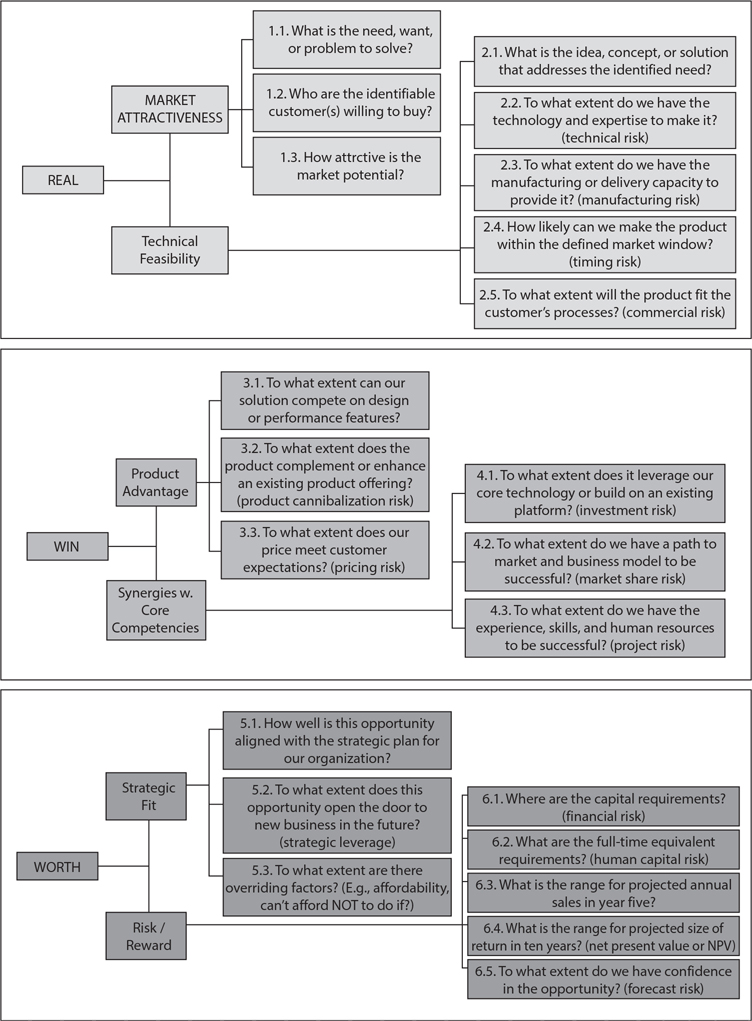
Figure 7.7. Real > Win > Worth Questions
Two of the top three reasons for new-product failures, as revealed by audits, would have been exposed by “Can we win?” Analysis: Either the new product didn’t achieve its market-share goals, or prices dropped much faster than expected. (The third reason is that the market was smaller, or grew more slowly, than expected.)11
Begin by reviewing a set of six new questions that explain the two vectors called synergies and advantages. Consider pulling in the results from any research efforts to help answer the questions. Focus on the open-ended nature of answers or projections.
TO WHAT EXTENT IS THE OPPORTUNITY WORTH DOING?
The final phase addresses predictive vectors including financial risk and reward and strategic fit. Financial projections can be general or refined, but apply a consistent level of rigor to all dimensions you assess. Keep in mind that the forecasts of financial returns from innovative solutions are notoriously unreliable. Day notes from his research:
“Given the susceptibility of financial forecasts to manipulation, over-confidence, and bias (heuristics), executives should depend on rigorous answers to the prior questions in the screen for their conclusions about profitability.”12
Build ranges and adapt them to your scale. Keep in mind that risk and reward factors, while specific, are nevertheless projections. There is no better time to use a large group for assessment since The Wisdom of Crowds suggests that nobody is smarter than everybody.13
MEETING FACILITATOR CONSIDERATIONS
Facilitate a session or sessions to build your questions (dimensions) as well as your assessment continuums. You may discover that by having individuals score the candidates privately and then aggregating results, you have a solid foundation to launch another decision-making session that will anchor the final assessment or decision. Keep in mind that the highest-scoring idea does not necessarily claim victory, but you will not waste time discussing suboptimal ideas, allowing the group to focus on the best candidates, those appealing to their most compelling reasons.
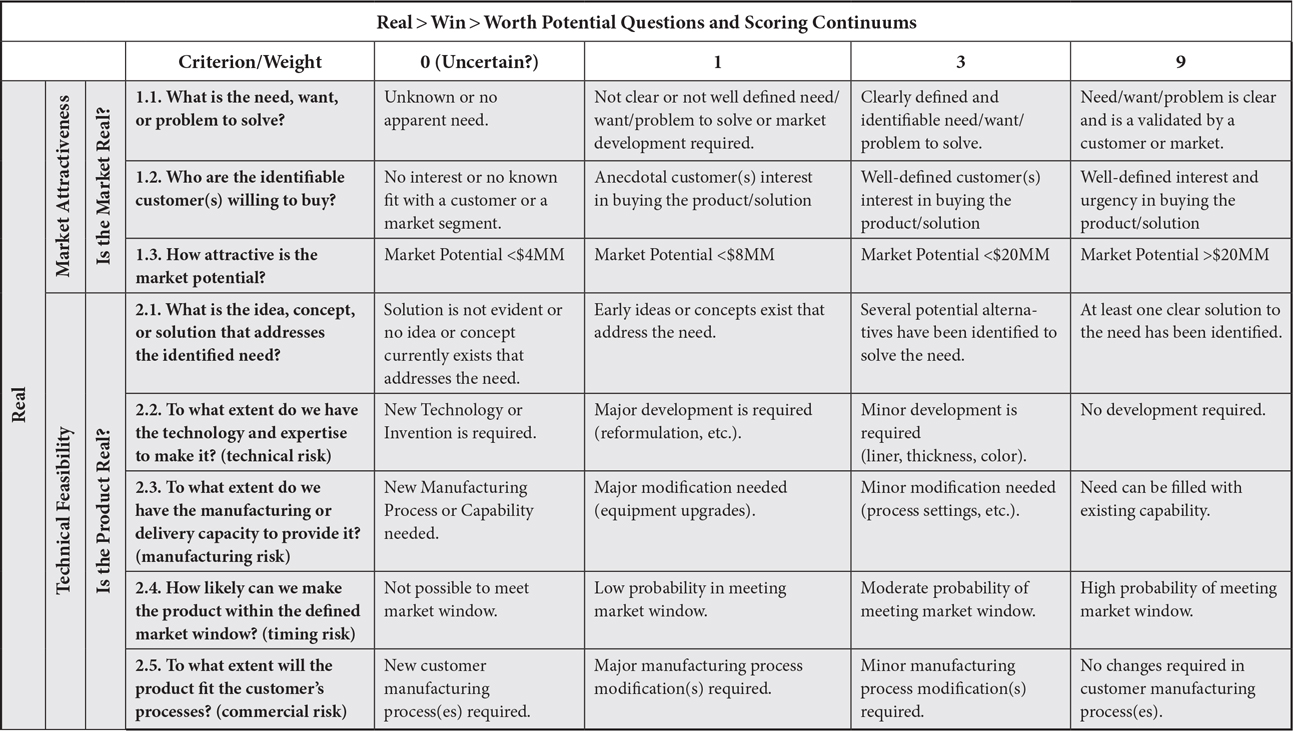
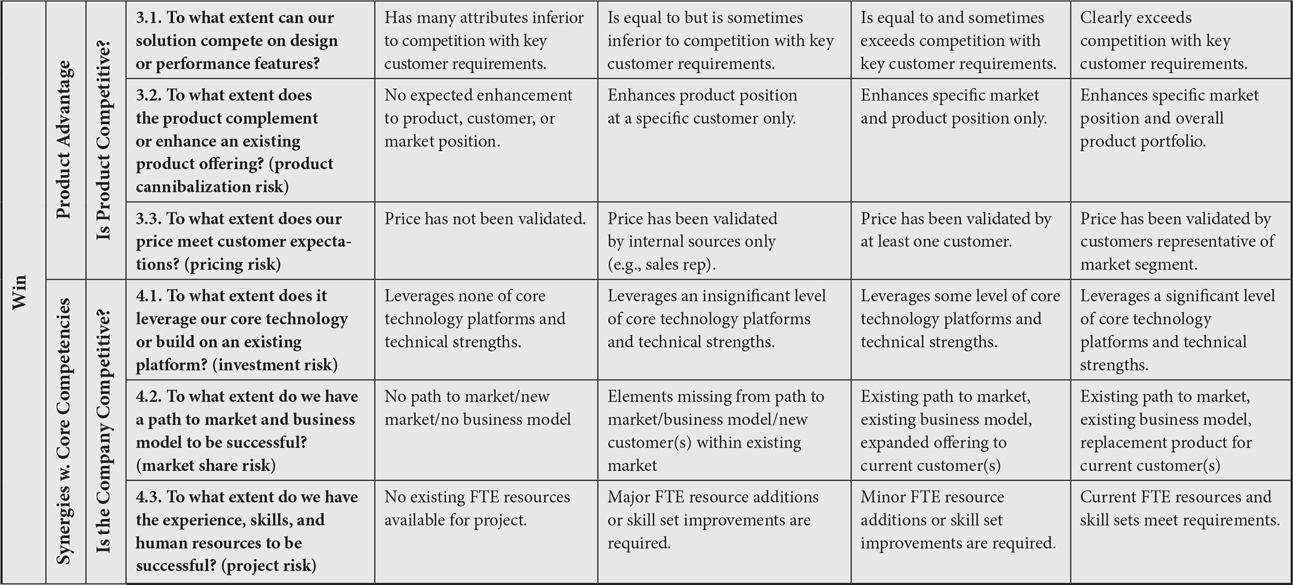

Figure 7.8. Real > Win > Worth Detailed
NOTE: Remember, the questions and illustrative answers and ranges presented in figure 7.8 are illustrative, directional, and should be liberally adapted to your situation.
6. Testing (Decision Quality)
What is the worst deliverable from any meeting? Inferior quality you say? Wrong deliverable perhaps? There is something worse. From the perspective of all participants, the worst deliverable from any meeting is another meeting.
DELIVERABLE
Therefore, my method encourages a procedure to test the deliverable for decision quality so that we can avoid needing to meet again. With material you have already built during this meeting, testing will be quick and comprehensive.
PROCEDURE
Take your decision and return to the original Purpose (chapter 7) expression created in the second Agenda Step. Parse the expression because it’s not possible to facilitate a group by asking participants to analyze “many to many.” Rather, take the entire solution, one that may include many parts or characteristics, and ensure that they all harmonize and support each discrete phrase or clause in your Purpose expression, one at a time.
If you experience further challenges or prefer leaving an exhaustive documentation trail for your decision, then consider using the more complex Decision Quality Spider Chart explained in the next section.
CLOSURE
To the extent that your final decision resonates solidly with the Purpose, the deliverable appears valid, and the meeting is complete. If there are gaps or uncertainties, focus group participants on either modifying their decision, better defining the Purpose, or discounting any “disconnects” as being too minor to consider any further.
Either way, you have helped your group build something glacial (very cool). You have structured an activity that ensures decision quality. Your participants have performed quality control on their deliverable. This is especially cool (super glacial) since decision-quality testing is missing from most meetings; most people are simply happy to get out. Arguably, most meetings never end—they simply stop.
Decision Quality Tool
WHY?
When making decisions, always test for decision quality (DQ) so that you can avoid having another meeting. Therefore, as explained in the previous section, a quick method involves testing your decision against the Purpose statement to gauge an amount of alignment and support. The DQ Spider Chart offers an even more robust method.14
Remember that my method defines consensus as a decision good enough that it “will be supported” (not thwarted in the hallway or uprooted in the boardroom) and not cause anyone to lose any sleep rather than being anyone’s favorite option or making anyone happy. Consensus does not mean that participants will all leave the meeting singing “Kumbaya.” Rather, consensus relies on the prowess of structured facilitation and detailed questions.
PROCEDURE
When testing for decision quality, score these six vectors, which have the greatest impact:
- Appropriate Context (Frame)
- How clear is the background, context, and impact of the decision?
- How well do stakeholders understand the problem?
- To what extent do stakeholders prioritize the problem?
- To what extent has the decision been quantified for its impact, typically in dollars or FTP?
- To what extent do you have an articulate problem to address?
- Options Development
- Are any potentially critical options missing?
- Should any inconsequential options be eliminated?
- What are the viable solutions (decisions)?
- With remaining options:
- – To what extent are they realistic (doable)?
- – If the option is selected, to what extent will we win?
- Meaningful and Reliable Information
- To what extent do we know what we need to know?
- To what extent do we not know what we need to know?
- How trustworthy are our sources of information?
- To what extent will this be a fact- or evidence-based decision?
- Clear Decision Criteria
- To what extent have we identified and clarified the most critical criteria?
- How well have the criteria been prioritized to reflect our internal value drivers?
- How comprehensive are the criteria to help measure success against the project or organizational goals and objectives?
- Logic and Reasoning
- How solid and thorough are our research, logic, and findings?
- How well can we explain our choice for and choices against our options?
- To what extent have we applied appropriate tools and rigors to evaluate our proposed solution?
- Action and Commitment
- How confident are we in projecting the outputs or outcome of this option?
- How ready are we to commit ownership and resources to this option?
- To what extent have we missed anything substantive that could impact the quality of this decision and its results?
HOW TO COMPLETE THE DECISION QUALITY SPIDER CHART
Consider this quick method for scoring by using a low score of 1 and a high score of 5.
Instruct each team member or stakeholder to generate an individual score for each of the six vectors just listed for any option or decision. Using a spreadsheet application, or simply drawing on a large-format Post-it paper or white-board, put a dot on the average value. Also place a dot on each outlier, the lowest and highest score, along each of the six vectors.
Analyze the outliers so that everyone can support the original average or move the average value either lower or higher based on the arguments and consensual understanding.
Facilitate understanding around the results, and consider the following questions:
- Do the values look defensible?
- To what extent do the differences represent real risk or simply differences of opinion?
- Which scores appear too high or low relative to the project or initiative they are supporting? (Adjust the score if needed)
You may want to force-rank the six vectors, if some are more important than others. Tell the group to consider the ranking during the assessment, and if necessary, change the values based on a calculation of the reduced or increased weight of each vector.
In my illustration in figure 7.9, stakeholders would favor Option 3 if ownership and commitment are more important than logic or reliable information.
Likewise, stakeholders would favor Option 1 if context and logic become more important than criteria and information.
7. Review and Wrap (Conclusion) Agenda Step
Follow the four-activity sequence for your Review and Wrap explained in chapter 5. None of the four activities should ever be skipped entirely, so expand and contract based on your situation and constraints.
ACTIVITIES
- 1 Review: Do not relive the meeting; simply review the outputs, decisions, assignments, and so on. Focus on the results and deliverable of each Agenda Step and not on how you got there. Participants do not need a transcript of the meeting; they need to be reminded about the takeaways and to be offered the opportunity to ask for additional information or clarification before the meeting ends.
- 2 Open issues and follow-up: There are various methods for dealing with open items and formal assignments, such as roles and responsibilities. Once post-meeting assignments are clear, the meeting is nearly complete.
- 3 Guardian of Change: Invest a few minutes to get the group to agree on what they are going to tell others when asked, “What happened in that meeting?” Use a T-Chart and build separate messages for superiors and peers (or other stakeholders).
- 4 Assessment: Get feedback on how you did. Set up or mark a whiteboard by the exit door and create two columns, typically Plus and Delta (the Greek letter 6, which stands for “change”). Have participants write down, on a small Post-it note, at least one thing they liked about the meeting [+] and one thing they would change [6]. Ask participants to mount each note in its respective column when departing the room.
QUALITY CONTROL
Effective leaders will not disband their meetings until participants have been offered a final opportunity to comment or question, actions have been assigned, messaging has been agreed to, and feedback for continuous improvement has been solicited.
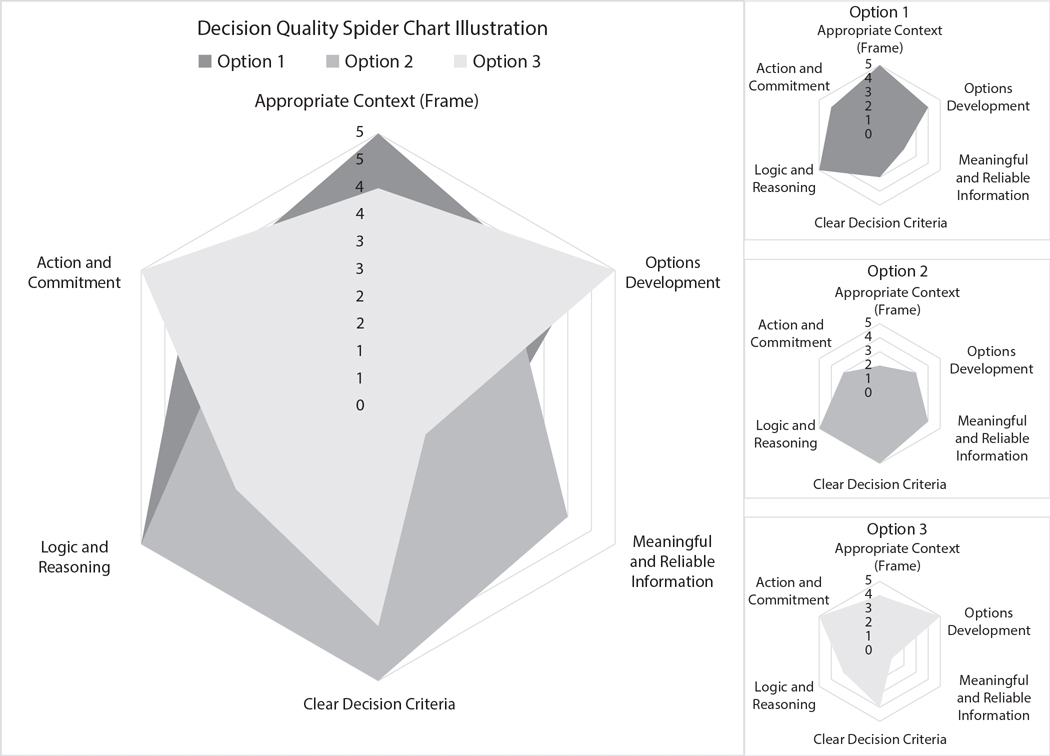
Figure 7.9. Six Vectors of Decision Quality Spider Chart
Quick Summary on Decision-Making
In practice, decision-making and prioritization are anything but linear. You will find yourself frequently going back and forth to fortify the purpose and add new ideas, new criteria, different criteria weights, and so on. When you know where you are going, it’s quite easy to jump around and yet maintain control.
Here are some practical reminders on decision-making:
- Do not allow arguments about the Purpose (chapter 7) statement. If my purpose is different from your purpose, the statement needs to reflect both purposes, as an aggregate. We’ll solve for it later.
- The statement itself is not technically part of the deliverable. It exists to support building consensus and quality control—to make sure that we don’t forget or miss something, such as some type of intended purpose without a corresponding feature in the selection.
- Be prepared to upgrade your Tool. If the PowerBalls Tool (chapter 7) proves insufficient, step it up to a Decision Matrix (chapter 7) or Perceptual Map (chapter 7) Tool. More is better with decision-making.
- The best use of Tools comes from deselecting, getting groups to agree on what not to consider. If we eliminate everything that causes personal objections, then we have consensus. We may not have a decision, but it is much easier to make decisions after we have consensus.
- Remember to test for decision quality. The Purpose statement is invaluable when you parse it. Take one clause or feature or benefit at a time and determine to what extent the decision supports each. When amply supported, you have consensus, a decision, and a successful test that suggests we will not need to have another meeting about this decision.
1 Eric Maskin and Amartya Sen, The Arrow Impossibility Theorem (2014).
2 I encourage a fourth activity, testing for decision quality, so that you can avoid another meeting.
3 Some styles call these “alternatives,” but strictly speaking, in the English language, an alternative is one of two. If there are more than two, they are called options.
4 A sparkline is a brief line including multivariable information. The term comes from Dr. Edward Tufte’s remarkable work, much focused on the graphical and qualitative display of quantitative information. See The Visual Display of Quantitative Information (2001) and his other wonderful works.
5 Terms that are grayed out are for your eyes only and not to be shown on the Basic Agenda you provide meeting participants.
6 The first person to normally violate this rule is the meeting facilitator making comments like “We already have that” or “What did you mean by that?” Look how often in a meeting the easel has two or three items after 20 minutes because the group is discussing each one. That is not Brainstorming and reflects an unstructured style not covered or encouraged by me or this book.
7 The term “requirement” is abused and misunderstood. To me, it represents who does what by when for what purpose (why) and how they do it.
8 These are also known as “Harvey Balls,” but some of our students requested that we change the term. When asked for a name they would prefer, students offered up “PowerBalls.”
9 See George Day, “Is It Real? Can We Win? Is It Worth Doing?” (2007).
10 A “vector” is the aggregate of multiple dimensions, with each dimension representing a range of potential values.
11 George Day, “Is It Real? Can We Win? Is It Worth Doing?” (2007), 12.
12 Day, “Is It Real? Can We Win? Is It Worth Doing?” (2007), 16.
13 See The Wisdom of Crowds: Why the Many Are Smarter than the Few and How Collective Wisdom Shapes Business, Economies, Societies, and Nations by James Surowiecki (2005), who also states: “With collective intelligence . . . you could say it’s as if we’ve been programmed to be collectively smart. . . . Any major decision should be taken by as large a group of managers as is logistically feasible.”
14 Microsoft Excel refers to this chart as a “radar” chart.