The capabilities of Cisco WAAS are commonly associated with the terms WAN optimization and application acceleration. On the surface, these two terms seem similar, but in fact they are fundamentally different. WAN optimization refers to a set of capabilities that operates in an application-agnostic manner, either at the transport or network layer, making the transfer of information over the WAN more efficient. In the case of Cisco WAAS, WAN optimization is implemented in the transport layer. Application acceleration, on the other hand, refers to a set of capabilities that operates in an application-specific manner, and interacts at the application protocol layer to improve performance. This chapter briefly revisits the WAN optimization capabilities of Cisco WAAS, and provides an in-depth examination of WAN optimization configuration and monitoring. Application acceleration capabilities of Cisco WAAS are examined in the next chapter.
Cisco WAAS provides transparent, network-integrated WAN optimization capabilities that improve efficiency and performance for almost any TCP-based application operating in a WAN environment. The Cisco WAAS WAN optimization components include Transport Flow Optimization (TFO), Data Redundancy Elimination (DRE), and Persistent LZ Compression (PLZ). All of these features are configurable from either the CLI or from the Central Manager (CM) GUI. As a refresher, this section provides a review of the WAN optimization components.
TFO is the foundational optimization layer of Cisco WAAS. TFO in itself provides optimizations to TCP to improve efficiency and mitigate performance limitations caused by latency and packet loss. Along with providing these optimizations, TFO acts as the data path for all the other optimizations for Cisco WAAS. That is, other optimizations that are being employed are called after being handled by TFO.
At its lowest layer, TFO provides a TCP proxy for connections that are being optimized by the WAE devices in the network. That is, connections from the source to the adjacent WAE are terminated locally by the WAE, new connections are managed over the WAN between WAEs, and new connections are generated on the remote LAN between the remote WAE and the destination. Connections between the source and the adjacent WAE, or between the destination and the adjacent WAE, are called original connections. Connections between the WAEs themselves are called optimized connections. It is important to note that the TCP proxy provided by Cisco WAAS is transparent, and that the original and optimized connections are dispersed physical segments of the same logical end-to-end TCP connection.
The WAE, and more specifically the TCP proxy, manages the exchange of information from an original connection to an optimized connection and visa versa. For example, assume a user has a connection that is being optimized by WAAS. This user is downloading an object via HTTP from a web server. As the server is sending data in response to the user’s HTTP GET request, the data is received by the WAE adjacent to the server as part of the original connection. The data is then buffered in the TCP receive buffer on the WAE optimized connection. Based on the configured policy, discussed later in the chapter, the WAE may pass this buffered data to other optimization services, such as DRE or PLZ, for encoding. TFO then manages the drainage of the optimized data from the optimization services to the optimized connection TCP transmit buffer, and the data is subsequently transmitted. The optimized data is then received by the WAE adjacent to the user (through network interception) and is placed in the TCP receive buffer for the optimized connection. TFO then passes the data to the appropriate optimization services for decoding. TFO then manages the drainage of the unoptimized data from the optimization services to the original connection TCP transmit buffer, and the data is subsequently transmitted to the recipient.
Figure 8-1 shows an example of how the TCP proxy interacts with data from optimized and original connections. The first example shows the HTTP GET request from the user going to the server.
The optimization capabilities that are enacted by TFO, listed as encoding and decoding in Figure 8-1, are determined by the policy applied to the connection. The policy that is applied to the connection, and how this is determined beyond a cursory examination of the configuration of the two WAEs, is discussed later in the chapter. TFO, on its own, provides a series of optimizations as well, which help improve performance for TCP-based applications:
Loss mitigation: With a TCP proxy, packet loss encountered in the WAN is managed by the sending WAE. Thus, the TCP stack for the original sender (for instance, the user or the server) never notices the packet loss, and therefore the TCP stack on the original sender is not impacted. In short, a TCP proxy shields the communicating nodes from packet loss encountered in the WAN. Furthermore, the WAEs employ selective acknowledgment (SACK) and extensions to minimize the amount of data that must be retransmitted when a segment has been lost in the WAN.
Latency mitigation: With a TCP proxy, impact from latency encountered in the WAN is minimized, as the adjacent WAEs manage TCP for each original connection. That is, the WAEs locally acknowledge TCP segments for the original senders, which provides the sender a LAN-like TCP experience. This allows the sending nodes to put more data on the network more quickly, as they do not have to wait from acknowledgments from nodes that are across the high-latency WAN.
Slow-start mitigation: TFO employs large initial windows (see RFC 3390), which doubles the original segment size for new connections. By increasing the original segment size, connections exit slow-start more quickly, allowing them to more rapidly enter congestion avoidance where bandwidth scalability techniques are employed that can improve throughput.
Bandwidth scalability: TFO uses window scaling, large buffers, and Binary Increase Congestion avoidance to allow certain applications to better utilize available bandwidth capacity. This is particularly important for high-bandwidth or high-delay networks, which are generally difficult for a sender to fully capitalize on with a legacy TCP implementation.
Fairness: The Binary Increase Congestion avoidance algorithm used by TFO ensures fairness across optimized and unoptimized connections. That is, optimized connections compete fairly with unoptimized connections for available WAN bandwidth regardless of the round-trip time of any connection. In this way, an optimized connection will not starve an unoptimized connection of available network bandwidth, thus ensuring performance consistency.
Data Redundancy Elimination (DRE) is another optimization component provided by Cisco WAAS. DRE leverages both disk and memory as a history from which data from an original connection can be compared to identify and remove redundancy from the transmission. If redundant data patterns are identified, DRE can replace the redundant pattern with a reference that the peer WAE understands, which is much smaller in size. This allows the WAE to provide potentially very high levels of compression, particularly when managing the transmission of content that has been transmitted previously in its entirety or partially.
DRE is effectively a database containing chunks of data from previous exchanges on optimized connections with an index designed for fast lookup and retrieval. The DRE index is stored on disk, which ensures persistence if the WAE is rebooted. The WAE memory is provisioned to allow the index to remain fully in memory, ensuring high performance and low latency during run-time operation. Additionally, WAE memory is optimized using an extended buffer cache to minimize the impact of flushing of DRE chunk data from main memory to disk. These system adjustments help minimize the amount of operational latency incurred when leveraging DRE against an optimized connection. By optimizing access to the DRE database index and data, encode and decode operations can be performed against optimized connections without adding substantial latency to the connection or the operations it carries.
DRE leverages a per-peer context architecture, meaning that entries in the DRE index and database are specific to a particular peer. This means that if a WAE peers with ten other WAEs that are identified during automatic discovery, the DRE database on that WAE will have entries specific to each of the ten peers. Although the use of a per-peer context architecture is less efficient in terms of storage utilization (a chunk of data may be stored once for each peer that it is transferred to), it provides tremendous advantages in terms of the following:
Operational latency: Connections can be quickly associated with the appropriate DRE database and index. Lookup operations are performed against a smaller, isolated database, and fewer I/O operations are required to extract data or write data to the database.
Compression scalability: By using a per-peer architecture with higher efficiency and lower latency, much more data can be processed by the system with less overhead. This allows the WAEs to reach higher levels of throughput. Compression scalability refers to the maximum application layer throughput that the system can sustain with heavily compressed content. A system with a high degree of compression scalability is one in which the compression itself does not impede the performance of the applications being compressed.
Latency mitigation: By potentially replacing a large amount of data with a few small references, the WAEs can minimize the number of packets that must be exchanged over the WAN to complete an operation. Thus, the amount of latency perceived by the application may be reduced.
Persistent LZ Compression (PLZ) is another WAN optimization component provided by WAAS. Similar to DRE, PLZ leverages a history of previously seen information to reduce redundancy. Whereas DRE provides a WAE-to-WAE compression history, PLZ provides a connection-oriented compression history; that is, PLZ leverages information found within a single connection to employ compression. PLZ is applied in memory only and thus provides high levels of throughput and minimal operational latency. PLZ is effective at compressing not only content that has never been seen by DRE before, but also DRE reference information. Unlike other compression technologies, PLZ implements a persistent connection history (hence the name persistent) that allocates a larger amount of memory than a standard LZ or DEFLATE algorithm would provide. With a larger history, PLZ is capable of generally providing higher levels of compression.
PLZ is also applied adaptively. In certain circumstances, PLZ might not be effective. The WAE analyzes connection data in real time using entropy calculations to determine if PLZ will have a positive effect on the data. If the WAE determines that the data is not compressible, PLZ is not employed for that portion of the data. Furthermore, if DRE compression achieves high compression ratios (above 90 percent), PLZ will not be employed for that portion of the data.
Cisco WAAS uses an automatic discovery mechanism to intelligently determine which two WAEs are closest to the two nodes involved in a connection. The automatic discovery process, which is a component of TFO, is commonly referred to as TFO automatic discovery, or TFO AD. TFO AD operates by adding a small 12-byte reference to the options field of TCP connection setup packets received by a WAE through interception when an optimization policy is configured for that connection or connection type. This 12-byte option, which is listed as TCP option 33 (or as hex 0x21 in packet capture applications), contains the following information:
A command that informs other WAEs that this particular WAE would like to optimize this connection.
A device identifier of the local WAE. WAEs use the MAC address of the primary interface as their device ID to ensure global uniqueness.
Optimization capabilities. Define which optimizations the WAE would like to apply to this connection.
The TFO AD option is applied only to TCP SYN (synchronize), SYN/ACK (synchronize and acknowledge), and ACK messages used for the connection setup, and is not applied to TCP data segments. As such, WAE devices must see the full three-way handshake of the TCP connection to discover one another. In situations where WAEs do not see the full three-way handshake, they cannot automatically discover one another, and cannot optimize that particular connection.
Upon receipt of an unmarked TCP SYN packet, the first WAE adds the TFO AD option to the packet, containing the information in the preceding list, and forwards the packet assuming a peer WAE will see the marked packet. If any additional WAEs along the path see the marked TCP SYN packet, they make a note of the device ID found in the marked TCP SYN packet. Once the marked TCP SYN packet reaches its intended destination, the first WAE in the path will have marked the TCP SYN packet, and each additional WAE in the path will have taken note of the device ID of the WAE that marked the packet.
When the destination node receives the TCP SYN packet, it generally responds with a TCP SYN/ACK packet to begin the second part of the three-way handshake (to establish the TCP connection). Similar to the manner in which WAEs react to the TCP SYN packet, the first WAE to see the SYN/ACK packet, which is generally at the other end of the network from the WAE that marked the SYN packet, applies the TFO AD option. At this point, the WAE marking the SYN/ACK packet knows information about the WAE that marked the SYN packet, including its device ID, intention to optimize, and desired policy. The marked SYN/ACK packet is then sent through the network toward the connection requestor. Any intermediary WAEs between the WAE that marked the SYN packet and the WAE that marked the SYN/ACK packet now know that they are not the outermost WAEs for this connection (that is, closest to the two endpoints of the TCP connection), and thus do not participate in optimization.
When the WAE closest to the connection requestor receives the marked TCP SYN/ACK packet, containing information about the WAE closest to the connection recipient, it examines the contents of the TFO AD option. The option, similar to the TFO AD option used on the TCP SYN packet, contains the device ID, intention to optimize, and optimization capabilities. An ACK packet containing a TFO AD option that acknowledges successful completion of automatic discovery is then generated by the WAE that marked the SYN packet, which notifies the WAE that marked the SYN/ACK packet that optimization can commence.
At this time, the connection is intercepted by the TCP proxy service (TFO) of both WAEs, and connection data is routed through the appropriate optimization components. Each WAE then generates and sends a TCP acknowledgment to the adjacent node participating in the connection, to complete the three-way handshake. The WAE that marked the TCP SYN packet acknowledges the node that created the TCP SYN packet, and the WAE that marked the TCP SYN/ACK packet acknowledges the node that created the TCP SYN/ACK packet. As discussed earlier in the chapter, the connection between the TCP endpoint and the WAE is considered an original connection, and the connection between the two WAEs is considered an optimized connection. Figure 8-2 illustrates the full automatic discovery process.
TFO AD natively supports hierarchical networks where multiple WAEs may exist in the path between two TCP endpoints. The operation of TFO AD automatically identifies the outermost WAEs for optimization—that is, the WAEs closest to the TCP endpoints. Any intermediary WAEs—that is, the WAEs in between the outermost WAEs—simply treat the connection as pass-through and allow the outermost WAEs to apply optimization. Pass-through connections on intermediary WAEs do not impact the number of connections that can be optimized by an intermediary WAE.
Note
When a WAE has reached its connection limit, or has gone into overload due to system load conditions, it does not participate in automatic discovery and, as such, cannot accept new connections to optimize. Connections encountered during this time are handled pass-through, which allows the communication to continue. If the network design, traffic flow, and placement of the WAEs permit, another pair of WAEs may be deployed in the network in such a way that allows them to optimize the connection, even if one of the WAEs is in an overload state or unavailable.
All of the WAN optimization features of the WAE can be enabled or disabled via the CLI or from the CM GUI. Because TFO acts as the data path for all optimization services of Cisco WAAS, it must be enabled for any other optimization capabilities to be employed. That is, you cannot leverage DRE or PLZ without using TFO. All WAN optimization features of the WAE are enabled by default. Generally, it is not necessary to disable any of these features unless you are operating in an environment where only TCP optimization is required. This is common in cases where bandwidth is not a performance-limiting factor, but latency or loss may be impacting application throughput. For instance, in an implementation where multiple gigabit links between data centers are in place, DRE and PLZ can be disabled, and Cisco WAAS will leverage TFO to help applications “fill-the-pipe”. In these scenarios, the WAEs help the applications better utilize available link capacity by overcoming latency and loss limitations.
Example 8-1 shows how to enable and disable each optimization service.
Example 8-1. Enabling and Disabling WAN Optimization Features in the WAE CLI
WAE# config
WAE(config)# no tfo optimize
! disables all optimization
WAE(config)# tfo optimize DRE yes compression none
! disables LZ only
WAE(config)# tfo optimize DRE no compression LZ
! disables DRE only
WAE(config)# tfo optimize full
! enables all optimization
WAE(config)# end
WAE# show tfo status
  Optimization Status:
     Configured: optimize full
     Current: optimize full
  This device's ID: 00:14:5e:41:eb:78
  TFO is up since Sat Sep 29 14:35:59 2007
  TFO is functioning normally.
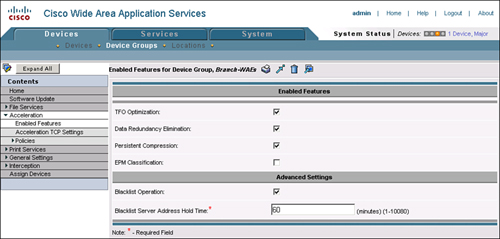
As shown in Figure 8-3, these same features can be enabled or disabled in the CM GUI. In most cases, these features are enabled or disabled on a device group containing multiple devices throughout the network that require only a specific set of services. As an example, WAE devices that need to perform only TCP optimization can be added to a device group, and the appropriate configuration can be applied against the device group. For reference, these features can be enabled or disabled from the CM GUI by visiting Devices > Device or Device Group > Acceleration > Enabled Features.
Note
EndPoint Mapper (EPM) Classification, one of the features listed in Figure 8-3, is discussed later in the chapter.
Automatic discovery is a core component of the Cisco WAAS architecture and cannot be enabled or disabled.
Another setting found in Figure 8-3 is Blacklist Operation and its associated Blacklist Server Address Hold Time field. As discussed earlier, TFO AD leverages TCP options during connection establishment to identify the outermost WAEs in the traffic path between two TCP endpoints. Once the WAEs have automatically discovered one another, they can begin optimizing the connection. In some situations, network components along the path may be configured to drop packets that contain unknown TCP options. TFO blacklist operation, upon receipt of a subsequent SYN from the TCP originator, will send the SYN packet to that destination without the TFO AD option. This allows the WAEs to automatically discover one another up to the point in the network where the device dropping marked packets is deployed.
As an example, assume that a WAE is deployed in a branch office with a user, and another WAE is deployed at the WAN boundary of the corporate campus network. Within the data center, which is well behind the WAN boundary of the corporate network, a firewall is deployed, which is dropping packets that contain unknown TCP options. When the user in the branch attempts to access a server in the data center behind this firewall, the TCP SYN packet containing TFO AD options is dropped by the firewall.
The WAEs deployed in the network detect the loss of the marked TCP SYN packet, and add the destination IP address to the TFO blacklist for a period of 60 seconds (or the value configured for the Blacklist Server Address Hold Time). Any connections going to that IP passing through the pair of WAEs going toward the destination server will not have the TFO AD options appended to them. However, if a SYN/ACK packet from the server, sent in response to an unmarked SYN (with no TFO AD options), is received, the WAE at the WAN boundary learns that the destination server cannot receive marked packets but can receive unmarked packets.
To notify the peer WAE that the connection can be optimized, the campus WAE appends the TFO AD options to the SYN/ACK packet, which was originally sent by the server. The branch WAE, when in receipt of the SYN/ACK packet with the TFO AD option set, then learns that the destination server cannot receive options but can be optimized. This allows the two WAEs to continue to discover one another and apply optimization to the connections going to that server (or any server behind that firewall).
Figure 8-4 shows an example of the TFO blacklist operation.
TFO blacklist operation is helpful in environments where a device that dropped marked packets is not deployed between WAE devices. In environments where firewalls are deployed between WAE devices, one of the following conditions must be met to ensure interoperability with Cisco WAAS:
Cisco firewalls: All Cisco firewall products, including the Cisco PIX/ASA (Adaptive Security Appliance), IOS Firewall, and Firewall Services Module (FWSM), have software versions and configurations that provide full transparent interoperability with Cisco WAAS. A host of whitepapers and configuration guides for Cisco firewalls, including references that outline software version requirements, is available on Cisco.com.
Non-Cisco firewalls: TCP option 33 (hex 0x21) must be permitted and stateful inspection of TCP packets needs to be disabled. WAE devices initially shift the sequence number of optimized connections by 2 GB to ensure that optimized packets are discarded if they are received by a TCP endpoint. WAE devices perform verification of sequence numbers for optimized connections to ensure that sequence numbers are within the expected range. This provides protection against attacks that use out-of-sequence segments and is similar to the sequence number protection provided by firewalls.
TCP provides connection-oriented, guaranteed delivery of information between two endpoints. To ensure guaranteed delivery, TCP employs end-to-end acknowledgments of delivered segments and timers to detect when segments may have become lost. When an acknowledgment is received from a peer, TCP understands that it no longer needs to retain a copy of that particular segment, and can free that portion of its memory to accept new data. When an acknowledgment is not received, it is up to TCP to retrieve a copy of that segment from memory and retransmit the segment. In short, TCP makes extensive use of memory to ensure guaranteed delivery.
Similarly, TCP uses memory to pipeline the transmission of data. By leveraging a sliding window protocol and memory, TCP can continue to “flush” data, that is, transmit data, while also receiving an equal amount of data from an application process that is attempting to transmit. In this way, TCP acts as an intermediary between the application and the network, acting as a traffic cop and making sure that there are no accidents.
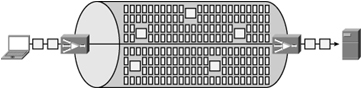
One of the most significant challenges associated with TCP is its inherent inability to fill a network link that is long in terms of distance (latency) and fat in terms of capacity (bandwidth). Hence, the term long fat network (LFN) came into existence. The challenge with filling LFNs is that the amount of memory allocated to TCP is less than the capacity of the network multiplied by the distance. In short, TCP cannot receive enough data from the application to adequately saturate the network with data.
Figure 8-5 shows an example of the performance challenges associated with having limited memory for TCP, especially when dealing with LFNs. In this example, notice the percentage of the cylinder representing the network that is occupied by the squares (which represent packets).
TFO, which uses an optimized implementation of TCP based on Binary Increase Congestion TCP (BIC-TCP), also uses memory for the purposes of guaranteed delivery and pipelining. TFO also leverages other TCP optimizations, including window scaling, selective acknowledgment, and large initial windows, to improve TCP performance. However, all the optimization in the world will not improve performance if buffer capacity is simply too small to fill the available network link. In such cases, the buffer capacity may need to be increased to accommodate the WAN link separating two or more locations.
Figure 8-6 shows how throughput can be improved for LFNs when allocating a larger amount of memory to TCP. In this example, notice that WAEs are deployed, which can be configured to provide extremely large buffers. Adjusting buffer sizes on the WAEs can provide immediate performance improvement without having to make configuration changes to workstations and servers.
The example in Figure 8-6 shows only the benefit of providing increased memory capacity and does not show the benefit of coupling the increased memory capacity with other optimizations, including compression. Increasing the memory allocated to TCP connections, which in the case of WAEs is called adjusting TFO buffers, allows more data to be in flight between two nodes at a given time. This is also referred to as “keeping the pipe full”, because it can allow communicating nodes to fully leverage the available bandwidth of the network. When coupling other optimizations, such as DRE or PLZ, the performance improvement can be exponentially higher as “keeping the pipe full” becomes “keeping the pipe full of compressed data”. Consider a scenario where a T3 link connects a campus to a remote data center over very long distance. Although an increase to TCP memory (adjusting TFO buffers) may allow for near line-speed utilization of this link, how much more throughput could be realized if the link was full of data that was compressed at a ratio of 5:1? With a 45-Mbps link carrying streams of 5:1 compressed data at line rate, that equates to application throughput of 225 Mbps.
An example of how combining these optimizations impacts throughput is shown in Figure 8-7.
Increasing the memory allocated to TCP generally is only necessary in situations where LFNs are encountered. By default, the WAEs are preconfigured with TFO buffer settings that allow the WAE to fill a link of capacity equal to the WAE rated capacity at a fair distance. The default TFO buffer settings are as follows:
NME-WAE models 302, 502, 522, and WAE-512 appliance: 32 KB send and receive for both original connection and optimized connection
WAE-612 appliance: 32 KB send and receive for original side connection and 512 KB for send and receive on the optimized connection
WAE-7326, 7341, 7371 appliances: 32 KB send and receive for original connection and 2048 KB for send and receive on the optimized connection
Although these values may be adequate for almost all deployments, they may require adjustment when deploying in environments with high bandwidth and high latency. WAE buffer settings should be configured based on the following guidelines:
Original connections should not be adjusted unless the LAN throughput has become a bottleneck for WAN throughput (which is rare). This is typically only common in scenarios where WAN bandwidth is in excess of 45 Mbps or the network latency is in excess of 200 ms.
Optimized connections should be set to four times the BDP of the network. The BDP of the network is equal to the bandwidth of the network (in bits) multiplied by the latency of the network (in seconds) and divided by eight (to end at a result in bytes).
For example, consider a network link that is an OC3 (155 Mbps) with 100 ms of latency. This equates to a BDP of ((155 Mbps × .1) / 8) = 1.94 MB. Given the preceding guidelines, the optimized side TFO buffers would need to be adjusted to at least 4 × 1.94 MB, or roughly 8192 KB.
Like other configuration aspects of the system, TFO buffer settings can be configured from either the CLI or the GUI. Changes made from the GUI are applied based on the LCM cycle, and it is recommended that these changes be applied against device groups rather than against devices directly. In any case, the configuration change would be required on both ends of the WAN link, so it makes sense to use a device group as opposed to making the configuration changes discretely on each device.
Example 8-2 shows how to configure TFO buffer settings from the CLI.
Example 8-2. Configuring TFO Buffer Settings
WAE# config term
! optimized connection receive buffer:
WAE(config)# tfo tcp optimized-receive-buffer 2048
! optimized connection send buffer:
WAE(config)# tfo tcp optimized-send-buffer 2048
! original connection receive buffer:
WAE(config)# tfo tcp original-receive-buffer 512
! original connection send buffer:
WAE(config)# tfo tcp original-send-buffer 512
You can also configure TFO buffer settings from the CM GUI by going to Devices > Device or Device Group > Acceleration > Acceleration TCP Settings, as shown in Figure 8-8. Changes to the buffer settings of a WAE take effect only for new connections that are established after the configuration change. Connections that were established prior to the configuration change are not impacted.
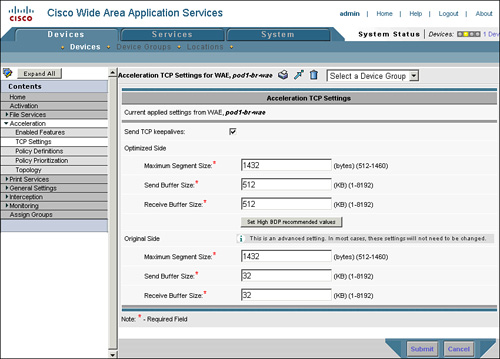
If a WAE encounters a situation where the system memory is oversubscribed based on the TFO buffer configuration and the number of connections to optimize, it will begin reassigning memory from existing connections to support new connections. In this way, the WAE can adapt to changes in load, even if it is configured to allocate large amounts of memory to connections.
Note
Additional TFO settings include TFO keepalives and MSS values. TFO keepalives, enabled by default, help the WAEs track connection status. If a keepalive fails after three attempts, the connection is automatically torn down. MSS settings are used to adjust the MSS used on the original and optimized connections. It may be necessary to shrink the MSS values on the optimized connection (optimized-mss) if encapsulation or Virtual Private Network (VPN) is present in the network between the WAEs to ensure that fragmentation is not encountered, which can significantly impact performance. Both of these settings can be configured from the CLI or CM GUI.
When a WAE receives a packet, it first examines the IP Protocol to identify if it should be sent to the optimization system. Any packets that are non-TCP, such as UDP, ICMP, or other packets, are not sent to the optimization subsystems. For WAE devices deployed in-path, any non-TCP packets are sent to the inlinegroup interface that is paired with the interface that the packet was initially received on. This is done to ensure that the packet is routed appropriately to its destination. Packets that are TCP are routed to the WAE Application Traffic Policy, or ATP, to determine how they should be handled.
The ATP is the lowest layer of the optimization system itself, and acts as the “traffic director” that defines the path through the optimization system that a flow will take. The ATP effectively determines whether a WAE will apply some optimization to a flow and, if so, what level of optimization is applied. The ATP is built from three key components:
While the ATP can be configured directly on the WAE CLI, it is recommended that the ATP be configured from the CM GUI. Using the CM GUI for ATP configuration ensures consistent configuration across all WAEs in the network, which can effectively eliminate policy configuration overlap or underlap as a component that requires troubleshooting when something is not working correctly.
Figure 8-9 illustrates the placement of the ATP in the WAE architecture.
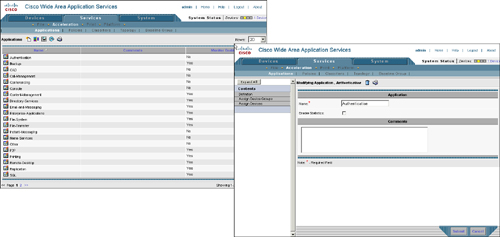
Application groups are containers for policies and traffic classifiers. Application groups are also used as a point of correlation for all statistics related to optimization that the WAE has applied to TCP connections. Applications can be defined on the WAE directly through the CLI, or configured through the CM GUI. The application group itself has only two parameters: a Comments field (for free text), and enable statistics check box. Comments can be supplied only via the CM GUI. The Enable Statistics check box in the CM GUI has no effect on the behavior of the WAE, as all statistics for all applications are recorded on the WAE. Rather, the Enable Statistics check box is used to indicate which application groups the CM requests from each of the managed WAEs.
Example 8-3 demonstrates how to configure an application group from the WAE CLI.
Example 8-3. Defining and Removing an Application Group from the WAE CLI
WAE# config
WAE(config)# policy-engine application name application_name
WAE(config)# no policy-engine application name application_name
! or:
WAE(config)# policy-engine application
WAE(config-pol-eng-app)# name application_name
WAE(config-pol-eng-app)# no name application_name
WAE(config-pol-eng-app)# end
WAE# show running-config
... portions removed ...
!
policy-engine application
  name application_name
Figure 8-10 shows how to configure an application group from the CM GUI. Application groups can be found by going to Services > Acceleration > Applications. Cisco WAAS provides over 20 application groups by default.
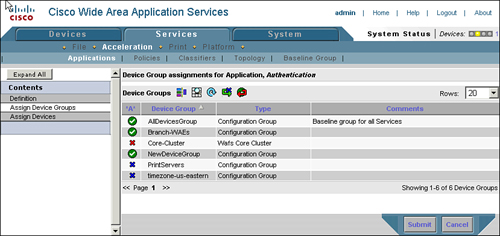
After you configure an application group in the CM GUI, you must then assign it to managed WAEs. From the Services > Acceleration > Applications > Edit page, you can choose a series of devices, a series of device groups, or a combination thereof. By selecting devices or device groups, the configuration on the respective devices is updated through the LCM cycle. Figure 8-11 shows the assignment status of an application group to a device group.
A traffic classifier is the component of the ATP that is responsible for defining the criteria that a flow is evaluated against to determine if it is a match for the policy. That is, the traffic classifier defines the flow characteristics that, when matched with a flow in question, would engage the configured optimization policy action.
Traffic classifiers can be configured from the CM GUI or from the WAE CLI. Much like other configuration items, it is recommended that the CM GUI be used for classifier configuration to ensure consistency throughout the network. Match conditions within traffic classifiers can be defined using any of the following parameters:
Source IP Address
Source IP Wildcard
Source TCP Port
Source TCP Port Range
Destination IP Address
Destination IP Wildcard
Destination TCP Port
Destination TCP Port Range
Example 8-4 shows how to configure a traffic classifier from within the WAE CLI.
Example 8-4. Defining, Viewing, and Removing a Traffic Classifier from the WAE CLI
WAE# config
WAE(config)# policy-engine application classifier classifier_name
!... or:
WAE(config)# policy-engine application
WAE(config-pol-eng-app)# classifier classifier_name
WAE(config-app-cls)# match (all | dst | src) (host | ip | port)
WAE(config-app-cls)# match src ip 10.10.10.0 0.0.0.255
WAE(config-app-cls)# match dst ip 10.10.9.2 0.0.0.0
WAE(config-app-cls)# match dst port eq 80
WAE(config-app-cls)# match dst port range 83 85
WAE(config-app-cls)# list
match src ip 10.10.10.0 0.0.0.255
match dst ip 10.10.9.2 0.0.0.0
match dst port eq 809
match dst port range 83 85
Note
Use of match all in the CM GUI or WAE CLI automatically disables all other options for that particular classifier, and all traffic will be matched.
When match all is not specified, all items defined within the classifier must be matched in order for the policy to be invoked against the flow.
Alternatively, all of the match conditions can be defined on a single line with the definition of the classifier, as shown in Example 8-5. Example 8-5 shows the same classifier definition as shown in Example 8-4, but using a single command.
Example 8-5. Single Command Defines Classifier and Match Conditions
WAE(config)# policy-engine application classifier classifier_name  match conditions
WAE(config)# policy-engine application classifier classifier_name match src ip
  10.10.10.0 0.0.0.255 dst ip 10.10.9.2 0.0.0.0 dst port eq 80 dst port range 83 85
WAE(config)# policy-engine application classifier classifier_name list
match src ip 10.10.10.0 0.0.0.255
match dst ip 10.10.9.2 0.0.0.0
match dst port eq 809
match dst port range 83 85
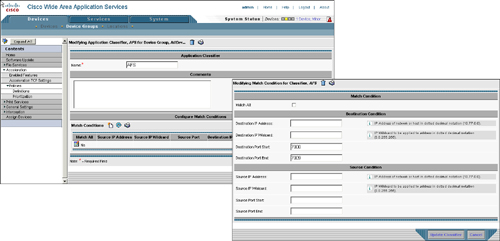
You configure traffic classifiers within the CM GUI under the policy definitions page at Devices > Device or Device Group > Acceleration > Policies > Definitions. Then, open the policy associated with the classifier to edit, and click Edit Classifier. You can then edit match conditions by clicking the New icon or the Edit icon. Figure 8-12 shows the application classifier definition page, along with the match conditions configuration page.
Policy maps are the final piece of the ATP and perform two critical tasks: associate classifiers with application groups, and assign actions to matched flows. The definition of a policy map contains the application name, classifier name, and action to be applied. Policies are listed in priority order in both the running-config file of the WAE CLI and the CM GUI. That is, when a WAE is making a determination on how to optimize a flow, it processes the policy list serially and leverages the first policy based on a match of the classifier. If there are overlapping policies, the policy that appears first in the WAE running-config file or is of higher priority in the CM GUI will be applied.
Note
You can configure policy prioritization in the CM GUI by going to Devices > Devices or Device Groups > Acceleration > Policies > Prioritization. Policy prioritization can also be configured from the CLI, as discussed later in this section.
The definition of a policy map includes the following parameters:
Type: Defines the type of policy map. Options include Basic, which is a normal optimization policy; WAFS Transport, which is used for CIFS acceleration and discussed in Chapter 9; and EPM, which is discussed in the next section.
Application: Defines the application group that the policy is associated with. Any statistics gathered against flows optimized by this policy are rolled into the application group statistics.
Application Classifier: Defines the traffic classifier that specifies match conditions that activate the policy against the flow.
Action: Specifies what type of action (optimization) to take on the flow. Actions include Passthrough, TFO Only, TFO with DRE, TFO with LZ, and Full Optimization (TFO with DRE and LZ).
Accelerate: Specifies which application accelerator the flow should be passed to, including either CIFS Accelerator (discussed in Chapter 9), MS Port Mapper (discussed in the next section), or Do Not Set, which indicates that no application accelerator should be used.
Position: Indicates the priority order of the policy. The priority can be set to First, Last, or a specific value. In situations where policies overlap, policies with higher priority are used.
Enabled: If this check box is checked, the policy is enacted on the WAE and added to the running-config file via the LCM cycle. If not enabled, the policy is enacted on the WAE and appears in the running-config file as a disabled policy.
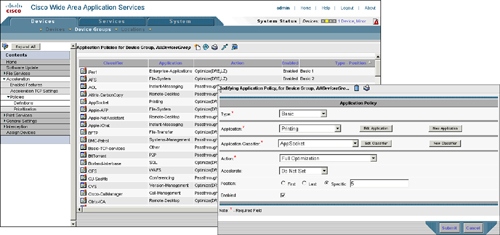
You configure policies in the CM GUI under Devices > Devices or Device Groups > Acceleration > Policies > Definition. Figure 8-13 shows the policy list page, and the policy definition page.
You can also define policies on the WAE CLI, as shown in Example 8-6.
Example 8-6. Configuring Policies from WAE CLI
WAE# config
WAE(config)# policy-engine application
WAE(config-pol-eng-app)# map basic name application-name classifier classifier-name
  action pass-through
WAE(config-pol-eng-app)# map basic name application-name classifier classifier-name
  action optimize DRE (no|yes) compression (LZ|none)
WAE(config-pol-eng-app)# map basic name application-name classifier classifier-name
  action optimize full
Additionally, you can combine the definition of the maps with the policy-engine application command to allow for definition of a policy map on a single line. Additional commands found under policy-engine application include:
map basic list: Displays the list of all policies and the optimization associated with the policy
map basic disable (#): Specifies a policy to disable
map basic insert (first|last|pos): Allows you to insert a policy at the beginning, end, or in a specific location within the policy list
map basic move from (#) to (#): Allows you to move a policy at a specific position to another position
Note
Policy engine commands are hierarchical and can be simplified by first using policy-engine application map basic. This takes you to a section of the CLI where you can enter commands such as list, disable, insert, and so on individually rather than having to enter the entire string of items such as policy-engine application map basic command.
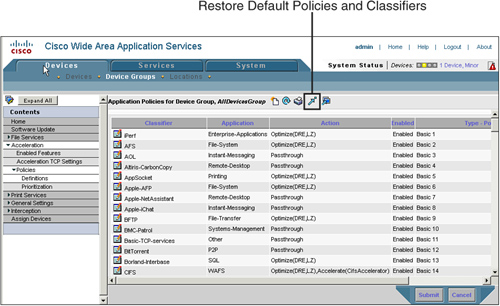
Each Cisco WAE ships with a default policy set enabled, which includes approximately 25 application groups, 150 policy maps, and the necessary classifiers to support them. If it becomes necessary to restore the original application traffic policy settings, you can click the Restore Default Policies and Classifiers icon found at Devices > Devices or Device Groups > Acceleration > Policies > Definitions. Figure 8-14 shows the button that allows the default policy set to be restored.
You can also restore the default policy set from the WAE CLI by using the command shown in Example 8-7. Note that this command does not ask for confirmation before executing, so use this command only when you are certain that you want to restore the default policy set.
Example 8-7. Restoring Default Policies from WAE CLI
WAE# config
WAE(config)# policy-engine application config restore-predefined
A special policy, called the other policy, is found at the bottom of the priority list. This is a required policy that acts as a catch-all and defines what the behavior of the WAE should be in situations where no configured policies are matched. In essence, if a flow cannot be classified, it is caught by the other policy, and the optimizations configured in this policy are applied to the flow. The other policy, like normal policies, can be configured from the CM GUI or the WAE CLI in an identical manner to that shown in the figures and examples presented in this chapter. Two primary schools of thought exist with regard to the other policy:
Optimize full (default): The default option is to optimize everything full if it cannot be classified. The benefit of this option is that all traffic will be optimized if it cannot be classified. The downside to this option is that traffic will fall into the “other” category in reports (reports are discussed later in this chapter) and the number of connections that can be optimized will be impacted when a connection is identified that cannot be classified, as it will be optimized.
Pass-through: Configuring the other policy with pass-through causes the WAE to not optimize traffic that it cannot classify. The benefit of this option is that traffic that cannot be classified will not consume system resources. The downside to this option is that traffic that cannot be classified will not be optimized.
Adapter policies are discussed later in this chapter, as well as in Chapter 9.
Although it is certainly possible that WAEs deployed in the same network may have disparate policy configurations, it is recommended that variations in policy configurations be minimized throughout the network to ensure consistency, ease of management, and simplified troubleshooting. Even in instances where a consistent policy is employed throughout the entire network, situations exist that may cause the configured policy to not be used. Policy configurations are enforced in a best-effort manner; that is, if the WAE has adequate resources to perform the configured optimization, it will attempt to do so.
This behavior is especially important when examining the TFO AD process. During this process, WAEs announce themselves in order to identify a peer, and advertise what optimization policy they would like to employ for the connection. In situations where the WAE is heavily loaded and has exhausted its optimized connection pool, it will stop participation in TFO AD altogether for new connections. Thus, these connections will go into pass-through, and this behavior will continue until the number of optimized connections falls to a number lower than the maximum capacity of the WAE.
Additionally, if optimization services are unable to perform the action advertised during TFO AD, in-band messages between WAEs will negotiate to a policy that both WAEs can accommodate. This allows the WAE to perform some level of optimization even if certain services are impaired. Naturally, the intent is to minimize such situations, and the WAE has numerous software watchdogs in place that can self-repair degraded services or even restart them when they cannot be repaired.
When the configured policies do not match, the least common denominator will be selected. For instance, if the configured policy on two WAEs is Full Optimization, yet one of them advertises TFO only, the applied policy between the two WAEs will be TFO only. Additionally, the optimization policies are consulted on each new connection encountered by a WAE, thus allowing policy changes to be implemented immediately for new connections. Changes made to policy configuration do not impact the level of optimization applied to connections that are already established and optimized.
EndPoint Mapper (EPM) is one of two types of accelerators available in WAAS as of this writing. The second is CIFS acceleration, which is discussed in detail in Chapter 9. The purpose of the EPM classification system is to allow WAAS to accurately classify MS-RPC traffic flows that use dynamic ports assigned by a port mapper, also known as a dispatcher, which is an application that provides a port number to use upon receipt of application-specific information.
In the case of EPM, the application-specific information that is shared from one node to another is a universally unique identifier (UUID). In essence, when a client connects to a server for a particular application, it establishes a TCP connection on the dispatcher port and provides the UUID. The server then examines the UUID and provides a response with the TCP port number that should be used for the message exchange for that application. The EPM classification system in WAAS provides classification support for common Microsoft applications including Active Directory (MS-AD) Replication, Remote-Procedure-Call applications (MS-RPC), Exchange (MS-Exchange), and File Replication Service (MS-FRS). For Microsoft applications, this service runs on TCP 135 on the server. Clients connecting to this port that supply a UUID are assigned a dynamic destination port to connect to for their particular application. The server, once this port is assigned, then opens the port locally, and associates the port with the upper-layer application.
Figure 8-15 shows the interaction between the client and server in an environment where port mappers are used.
WAAS relies on the EPM classification system to learn what dynamic ports are being used by a particular application. As a WAE is either physically or virtually inline to all communication entering or leaving an interception point, connections established to port mapper ports and exchanges of UUID information to receive a dynamic port assignment will also be intercepted. With the EPM service, WAAS can listen to this conversation and learn what application the user is trying to use, and what port the server instructs the user to connect on.
Figure 8-16 shows the same interaction between the client and the server in a WAAS environment, and how WAAS uses this information to understand what applications and ports are being used.
EPM classification can be enabled or disabled through the Enabled Features page, as shown earlier in Figure 8-3. Policies exist within the default policy set to account for applications that use EPM and can be found at the bottom of the policy list (see Figure 8-13 for the location of the policy list).
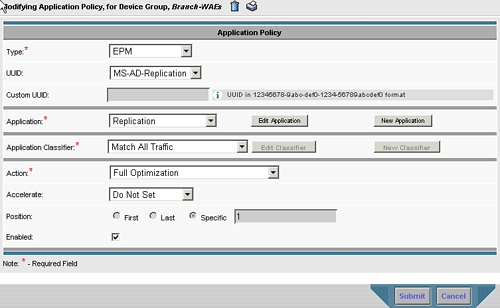
Figure 8-17 shows the construction of the EPM policy, which is very similar to basic policies. The primary difference is the presence of the UUID field, which includes a default set of UUIDs including MAPI (MS-Exchange), MS-SQL-RPC, MS-AD-Replication, MS-FRS, and Custom. Choosing Custom UUID allows you to specify UUIDs unique to your particular application. Also, note that for an EPM policy, the Application Classifier drop-down list box should be set to Match All Traffic because the EPM classifier will be used rather than the regular Layer 3 (IP) and Layer 4 (TCP) classification fields provided by the traffic classification system.
Example 8-8 shows how to enable or disable EPM classification on a WAE using the CLI.
Example 8-8. Enabling or Disabling EPM Classification from WAE CLI
WAE# config
WAE(config)# adapter epm enable
WAE(config)# no adapter epm enable
EPM classification can also be configured from the WAE CLI in a similar manner to how basic policies are configured. Example 8-9 shows the configuration of an EPM policy from the WAE CLI.
Example 8-9. Configuring an EPM Policy from WAE CLI
WAE# config
WAE(config)# policy-engine application
WAE(config-pol-eng-app)# map adaptor EPM (UUID)
! ... or:
WAE(config-pol-eng-app)# map adaptor EPM (ms-sql-rpc | mapi | ms-ad-replication | ms-frs)
WAE(config-app-adv)# name (application group name) all action (optimize | pass-through)
The previous sections in this chapter have focused on the deployment and configuration of WAN optimization capabilities and building application traffic policies. This section examines the reporting facilities provided by Cisco WAAS, both the CM GUI and the CLI, to provide visibility into system operational behavior, performance, and any issues that may have arisen. This section starts with an examination of automatic discovery statistics, and then looks at connection statistics and details, and finishes with a look at statistics for the WAN optimization capabilities relative to application performance and other metrics.
TFO AD statistics provide useful insight into how connections are being seen by WAEs in the network. The WAE CLI exposes a great deal of information about the TFO AD process, situations encountered, and how connections were handled. The show tfo auto-discovery command from the exec mode of the WAE CLI provides details about the following:
Automatic discovery success: How many connections have successfully completed automatic discovery
Automatic discovery failure: How many connections have failed automatic discovery, and what were the reasons for failure
Example 8-10 shows an annotated output of this command. An explanation is provided for each of the key output fields. Some text has been removed from the command output to eliminate less-commonly used information and to allow focus on the most important pieces of output data from this command.
Example 8-10. CLI Automatic Discovery Statistics
WAE# show tfo auto-discovery
Auto discovery structure:
       Allocation Failure:                            0
       Allocation Success:                            52
       Deallocations:                                 52
       Timed Out:                                     3

! Allocation failure and allocation success indicate whether or not a connection

! was successfully allocated space in the TFO AD table. Each closed connection that

! had successfully been allocated to the TFO AD table should have a deallocation

! as well. Allocation failures could be caused by timeout, network connectivity

! issues, or overload conditions on the WAE itself.
... portions removed ...
Auto discovery failure:
       No peer or asymmetric route:                   26
       Insufficient option space:                     0
       Invalid option content:                        0
       Invalid connection state:                      0
       Missing Ack conf:                              0
! The auto discovery failure section provides helpful guidance on why TFO AD may
! have encountered failure conditions. This includes scenarios where a peer WAE
! could not be identified, asymmetric routing was present, insufficient option
! space in the TCP options field (if other options were present), and corrupt
! option content. Option content should not be corrupt unless bits on the
! network were flipped, which is a condition commonly corrected by examination
! of packet header checksums and CRCs.
Auto discovery success TO:
       Internal server:                               8
       External server:                               44
! Internal servers include any process on the WAE that is explicitly listening
! for traffic, such as a management service or CIFS acceleration service.
! External servers are any nodes other than WAEs that other nodes are
! attempting to connect to, i.e. the recipient endpoint in the TCP connection.
Auto discovery success FOR:
       Internal client:                               0
       External client:                               29
! Internal clients include any process on the WAE that is explicitly generating
! connections to! another node on the network and can include management services
! or the CIFS acceleration service. External clients are any nodes other than WAEs
! that are attempting to connect to other nodes on the network, i.e. the sender
! endpoint in the TCP connection.
Auto discovery Miscellaneous:
       Intermediate device:                           12
       RST received:                                  0
       SYNs found with our device id:                 3
       SYN retransmit count resets:                   0
! The miscellaneous fields provide insight into additional conditions that
! may be encountered, such as when the WAE is an intermediate WAE and not an
! outermost WAE in the network path between two TCP endpoints. "SYNs found
! with our device ID" could represent routing loops in the network topology,
! that is, a SYN packet marked with a TFO AD option was re-routed after
! marking back through the WAE that added the TCP option.
Additional automatic discovery statistics can be gathered through the following commands:
show tfo auto-discovery blacklist entries: Displays a table containing a list of the TCP endpoints that have been added to the TFO AD blacklist due to options propagation failure.
show tfo auto-discovery list: Displays a table containing a list of the TCP connections that are presently in the automatic-discovery state, and what their status is. As connections are generally built quickly, execution of this command will provide an immediate point-in-time snapshot.
Along with providing visibility into the automatic discovery process, the WAE CLI provides details about the connections that are being optimized by the WAE. The CM GUI also provides these details in an easy-to-use connection table, which also allows you to zoom into a specific connection to watch its behavior in near real time.
Two ways exist to examine the list of optimized and pass-through connections on the WAE. The first is from the WAE CLI through the use of the show tfo connection summary command. This command provides a tabular list of all connections (optimized and pass-through) along with the four-tuple (source IP, destination IP, source port, destination port), internal connection ID, peer ID, and policy. The policy portion of the table is broken into four columns:
Local Configured Policy: Specifies what policy was defined in the local WAE application traffic policy.
Peer Configured Policy: Specifies what policy was defined in the peer WAE application traffic policy.
Negotiated Policy: Specifies the least common denominator between the policy configured locally and the policy configured on the peer WAE.
Applied Policy: Specifies the policy applied to the connection. This should generally be the same as the negotiated policy unless load conditions prevent one of the WAEs from applying a capability in the negotiated policy.
The policy portion of the table contains a single character for each of the four policy columns:
F (Full optimization): TFO, DRE, and LZ are applied to this connection.
D (TFO+DRE): Only TFO and DRE are applied to this connection.
L (TFO+LZ): Only TFO and LZ are applied to this connection.
T (TFO Only): Only TFO is applied to this connection.
Example 8-11 shows sample output from the show tfo connection summary command.
Example 8-11. Display Connections from WAE CLI
WAE# show tfo connection summary
Optimized Connection List
Policy summary order: Our's, Peer's, Negotiated, Applied
F: Full optimization, D: DRE only, L: LZ Compression, T: TCP Optimization
Local-IP:Port         Remote-IP:Port        ConId   PeerId            Policy
10.10.100.2:10386     10.10.10.240:4050     12      00:05:9a:3d:31:dd F,F,F,F
10.10.100.2:10387     10.10.10.240:4050     13      00:05:9a:3d:31:dd F,F,F,F
10.10.100.2:10388     10.10.10.240:4050     14      00:05:9a:3d:31:dd F,F,F,F
10.10.13.240:37849    10.10.10.240:4050     2       00:11:25:ac:3c:5c F,F,F,F
10.10.13.240:37850    10.10.10.240:4050     3       00:11:25:ac:3c:5c F,F,F,F
10.10.13.240:37851    10.10.10.240:4050     4       00:11:25:ac:3c:5c F,F,F,F
10.10.13.100:2847     10.10.10.100:80       5       00:11:25:ac:3c:5c F,F,F,F
10.10.10.100:48329    10.10.13.100:3389     99321   00:11:25:ac:3c:5c T,T,T,T
You can find this same information in the CM GUI by going to the device homepage at Devices > Device > Monitoring > Connection Statistics, as shown in Figure 8-18.
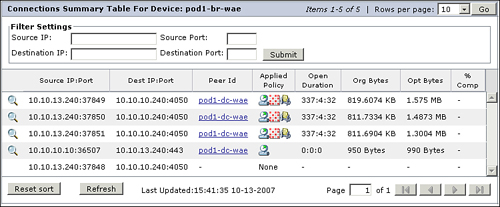
The magnifying glass icon next to each of the connection entries provides a simplified means of drilling into the details for a specific connection. By clicking this icon, a pop-up window appears, which is automatically refreshed every three seconds. This pop-up window provides the following details about the connection:
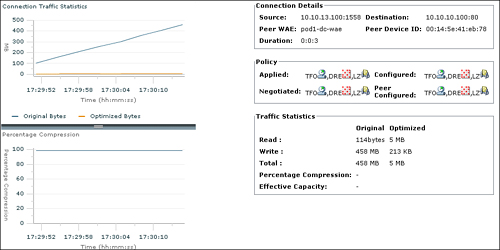
Connection Traffic Statistics: The amount of traffic found in the connection graphed over time
Percentage Compression: The amount of compression applied to the connection graphed over time
Connection Details: Including four-tuple, duration (length of the connection), and device ID of the peer WAE used to optimize the connection
Policy: Including the locally configured policy, configured policy on the peer, negotiated policy, and applied policy
Traffic Statistics: Original connection and optimized connection statistics, including bytes read, bytes written, total bytes, percentage compression, and effective capacity gain through optimization
The information found in the Connection Details pane continues to refresh throughout the life of the connection. Graphs and statistics are continually updated. This information is especially helpful to track the progress and performance of long-lived connections.
Figure 8-19 shows an example of the detailed connection statistics that are provided when opening the details of an optimized connection from the CM GUI.
The same level of detail about a connection can be gathered from the WAE CLI using a series of commands:
show tfo connection: Provides connection details, policy details, state, and processing latency for a particular connection.
show stat dre connection: Provides compression details for all optimized connections or a specific connection. Details include four-tuple, open and close timestamps, duration, encode statistics (bytes in vs. bytes out), decode statistics (bytes in vs. bytes out), processing latency caused by compression, and message size distribution.
Example 8-12 demonstrates sample output from the show statistics dre connection command, along with the same command applied to a single connection.
Example 8-12. Examining Compression Statistics from WAE CLI
WAE# show statistics dre connection
Conn  Peer       Client-ip:port       Server-ip:port   Encode-in/   Status
 Id    No                                              Decode-in    (A-Active)
                                                                    (C-Closed)
99674   1    10.10.13.100:1559    10.10.10.100:445     737B/ 1KB    C(6m46s)
99673   1    10.10.13.100:1560    10.10.10.100:139       0B/ 0B     C(6m57s)
99645   1    10.10.13.100:1558    10.10.10.100:80     487MB/ 0B     C(7m49s)
WAE# show statistics dre connection id 99645
Conn-ID: 99645 10.10.13.100:1558 -- 10.10.10.100:80  Peer No:  1 Status: Closed
------------------------------------------------------------------------------
Open at 10/20/2007 17:37:52, Close at 10/20/2007 17:38:32, Duration: 40 secs
Encode:
   Overall: msg:      15427, in:    487 MB, out:   5416 KB, ratio:  98.92%
       DRE: msg:      15427, in:    487 MB, out:   5691 KB, ratio:  98.86%
DRE Bypass: msg:          0, in:      0 B
        LZ: msg:       1562, in:    932 KB, out:    657 KB, ratio:  29.49%
 LZ Bypass: msg:      13865, in:   4759 KB
    Avg latency:      1.405 ms
  Message size distribution:
    0-1K=1%  1K-5K=4%  5K-15K=13%  15K-25K=16%  25K-40K=30%  >40K=33%
Decode:
   Overall: msg:          0, in:      0 B, out:      0 B, ratio:   0.00%
       DRE: msg:          0, in:      0 B, out:      0 B, ratio:   0.00%
DRE Bypass: msg:          0, in:      0 B
        LZ: msg:          0, in:      0 B, out:      0 B, ratio:   0.00%
 LZ Bypass: msg:          0, in:      0 B
    Avg latency:      0.000 ms
  Message size distribution:
    0-1K=0%  1K-5K=0%  5K-15K=0%  15K-25K=0%  25K-40K=0%  >40K=0%
Many of the optimization statistics commands that produce tabular output on the WAE CLI can be filtered by a variety of parameters, including client IP address, client TCP port, server IP address, server TCP port, peer ID, connection ID, or a combination of these parameters.
The commands and GUI locations found in the previous sections allow you to identify how WAEs are automatically discovering one another, issues encountered during TFO AD, identify the policies applied to connections, and examine connection statistics. This section focuses on the impact of these optimizations on the connections that are traversing the network.
Both the WAE CLI and the CM GUI provide powerful reporting tools that provide visibility into what the traffic distribution seen by the WAEs is, as well as what impact optimization services are having on the connections. One of the most important questions that demands an answer is, “How much bandwidth am I saving?” The WAE CLI includes a command that provides this information, show statistics tfo saving, which is shown in Example 8-13.
Example 8-13. Examining Bandwidth Savings from WAE CLI
WAE# sh statistics tfo saving
Application           Inbound                Outbound
--------------------- ---------------------- ----------------------
... portions removed ...
WAFS
    Bytes Savings                     118348               60877374
    Packets Savings                        0                  35815
    Compression Ratio                  1.1:1                 18.5:1
Web
    Bytes Savings                    4886829             1037171275
    Packets Savings                   154295                 693334
    Compression Ratio                  1.3:1                 39.0:1
WAE# sh statistics tfo saving Web
Application           Inbound                Outbound
--------------------- ---------------------- ----------------------
Web
    Bytes Savings                    4886829             1037171275
    Packets Savings                   154295                 693334
    Compression Ratio                  1.3:1                 39.0:1
As Example 8-13 demonstrates, this command can also be filtered to show the output from a single application group as well, by simply appending the name of the application group to the end of the command. It is important to note that the application group aggregates the bandwidth savings statistics. Thus, the amount of savings reported includes statistics from all traffic classifiers associated with that application group. Another important item to note is that the command displays the packet savings associated with use of optimization. In most cases, the number of packets that must be transmitted decreases as compression increases. This not only helps to save bandwidth, but also mitigates the impact of latency, as fewer round trips must be made across the WAN.
The CM GUI also provides a tremendous amount of useful information about the performance of the system and bandwidth savings. You can find the majority of these reports on the device homepage, or view them in aggregate form by visiting the device group homepage or system homepage. Using statistics from a single device as an example, a tabular view of application groups, the percentage of overall traffic consumed by each application group, effective capacity, and compression statistics can be found by going to Devices > Device > Monitoring > Optimization Statistics. Figure 8-20 shows the tabular view from this page.
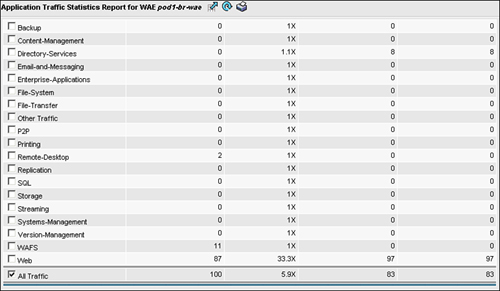
Along with providing per-application statistics, you can view additional reports that provide visibility and system performance information, including the following:
Application Traffic Mix: A pie chart that visualizes the breakdown of traffic identified by application group.
Application Traffic: A line graph that displays the amount of traffic from each application group over a period of time.
Pass-Through Traffic Mix: A pie chart that visualizes the breakdown of why traffic was handled in pass-through.
Pass-Through Traffic: A line graph that displays the amount of pass-through traffic that has been handled by the WAE over a period of time.
Optimized vs. Pass-Through Traffic: A line graph that displays the amount of optimized traffic and pass-through traffic together, which helps you understand how much of your network utilization is being optimized by WAAS.
Reduction: A line graph that displays the percentage reduction over a period of time. This graph can be shown including or excluding pass-through traffic, and is helpful in determining what level of compression has been applied to traffic.
All of the graphs can be configured with a specific time interval, including last hour, last day, last week, and last month. A custom date range can be supplied if you require that the report span a specific set of days. The line graphs produced by this page can also be filtered to include all traffic or specific application groups, and can include a specific direction of traffic flow or both directions of traffic flow. Figure 8-21 shows an example of one of the many reports. In this figure, compression ratios applied across four application groups and other traffic are displayed for a custom time period.

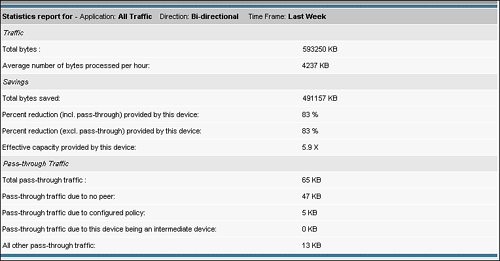
The CM GUI also provides a useful application traffic statistics detail report at Devices > Device > Monitoring > Optimization Statistics Details. This report, much like the reports mentioned before, can be filtered based on specific application groups or over time. The statistics detail report provides the following information:
Traffic: Total number of bytes processed and average number of bytes processed per hour.
Savings: Total number of bytes saved, percentage reduction including and excluding pass-through, and effective capacity provided.
Pass-Through Traffic: Total number of bytes handled pass-through, amount of traffic handled pass-through because no peer device was identified, amount of traffic handled pass-through due to configured policy, amount of pass-through traffic due to being an intermediate device, and all other pass-through traffic.
Figure 8-22 shows an example of this report.
Cisco WAAS provides powerful WAN optimization capabilities, including TFO, DRE, and PLZ, to minimize bandwidth consumption, minimize the impact of latency, and improve overall application performance. WAE devices automatically discover one another during the establishment of TCP connections, and advertise their availability and policy that they would like to employ. The ATP is the component of the WAE in which policies are configured (either through the CLI or CM GUI) that dictate what policy a WAE will attempt to apply to a specific type of connection. These policies are negotiated during the automatic discovery phase to the least common denominator of the two configured policies, unless load conditions prevent a specific policy from being used. Once a policy has been negotiated, WAE devices begin applying optimization to the connection based on the configured policy, and collecting statistics against the connection and the optimization used. These statistics are made available to the user both in the WAE CLI and in the CM GUI, which provide helpful insight into how the system is performing and what conditions are being encountered by the WAEs.