
Contour Profiler Overview
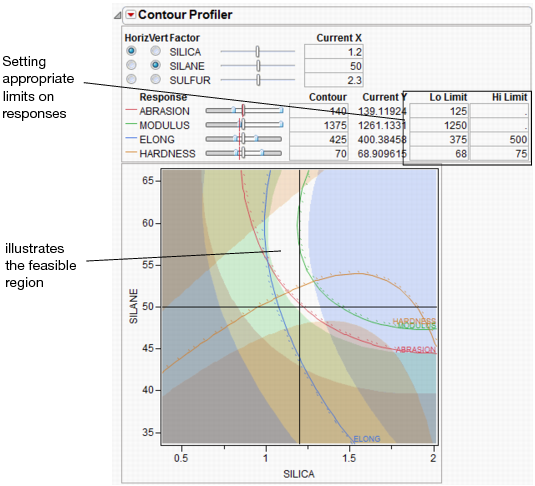
The Contour Profiler shows response contours for two factors at a time. The interactive contour profiling facility is useful for optimizing response surfaces graphically. Figure 4.2 shows an example of the Contour Profiler for the Tiretread sample data.
Figure 4.2 Contour Profiler
• There are slider controls and edit fields for both the X and Y variables.
• The Current X values generate the Current Y values. The Current X location is shown by the crosshair lines on the graph. The Current Y values are shown by the small red lines in the slider control.
• The other lines on the graph are the contours for the responses set by the Y slider controls or by entering values in the Contour column. There is a separately colored contour for each response (4 in this example).
• You can enter low and high limits to the responses, which results in a shaded region. To set the limits, you can click and drag from the side zones of the Y sliders or enter values in the Lo Limit or Hi Limit columns. If a response column’s Spec Limits column property has values for Lower Spec Limit or Upper Spec Limit, those values are used as the initial values for Lo Limit and Hi Limit.
• If you have more than two factors, use the radio buttons in the upper left of the report to switch the graph to other factors.
• Right-click the slider control and select Rescale Slider to change the scale of the slider (and the plot for an active X variable).
• For each contour, there is a dotted line in the direction of higher response values, so that you get a sense of direction.
• Right-click the color legend for a response (under Response) to change the color for that response.
Contour Profiler Platform Options
Grid Density
Sets the density of the mesh plots (Surface Plots).
Graph Updating
Gives you the options to update the Contour Profiler Per Mouse Move, which updates continuously, or Per Mouse Up, which waits for the mouse to be released to update. (The difference might not be noticeable on a fast machine.)
Surface Plot
Hides or shows mesh plots.
Contour Label
Hides or shows a label for the contour lines. The label colors match the contour colors.
Contour Grid
Draws contours on the Contour Profiler plot at intervals that you specify.
Factor Settings
Provides a submenu of commands that enables you to save and transfer the Contour Profiler’s settings to other parts of JMP. Details are in the section “Factor Settings”.
Simulator
Launches the Simulator. See the “Simulator” chapter.
Up Dots
Shows or hides dotted lines corresponding to each contour. The dotted lines show the direction of increasing response values, so that you get a sense of direction.
Set Contours to Current
Resets the contour lines to be where the current Y values are located. This means that they will all cross where the crosshairs are on the contour plot and the controls will agree in the Y sliders.
Arrange X Controls Left
Rearranges the X and Y controls horizontally with the X controls on the left or vertical with the X controls at the top.
Hide X Controls
Shows or hides the X controls (Factor section).
Hide Y Controls
Shows or hides the Y controls (Response section).
Locking Mixture Values
For mixture designs with more than three predictors, a Lock column appears in the Contour Profiler (Figure 4.3). This column enables you to lock settings for mixture values so that they are not changed when the mixture needs to be adjusted due to other mixture effects being changed. When locked columns exist, the shaded area for a mixture recognizes the newly restricted area.
Figure 4.3 Boxes to Lock Columns
Constraint Shading Settings
Specifying limits to the Y's shades the areas outside the limits as shown in Figure 4.4. The unshaded white area becomes the feasible region.
Figure 4.4 Settings for Contour Shading
If a response column’s Spec Limits column property has values for Lower Spec Limit or Upper Spec Limit, those values are used as the initial values for Lo Limit and Hi Limit.
..................Content has been hidden....................
You can't read the all page of ebook, please click here login for view all page.