Chapter 6. Developing a plan
This chapter covers
- Assessing what you’ve learned in the preliminary phases of the project
- Revising the goals of the project based on new information
- Realizing when you should redo prior work
- Communicating new information to the customer and getting feedback
- Developing a plan for the execution phase
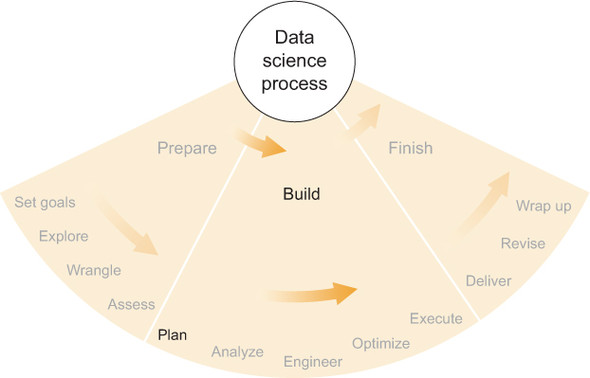
Figure 6.1 shows where we are in the data science process: beginning the build phase by formal planning. Throughout this book, I’ve stressed that uncertainty is one of the principle characteristics of data science work. If nothing were uncertain, a data scientist wouldn’t have to explore, hypothesize, assess, discover, or otherwise apply scientific methods to solve problems. Nor would a data scientist need to apply statistics—a field founded on uncertainty—in projects consisting only of absolute certainties. Because of this, every data science project comprises a series of open questions that are subsequently answered—partially or wholly—via a scientific process.
Figure 6.1. The first step of the build phase of the data science process: planning
It would be a mistake not to consider these new answers as they arrive. That would be comparable to continuing to drive along a specific road even after you’ve been informed that the road is closed ahead and the best detour requires you to turn. Within the past decade, internet-connected navigation devices, most often smartphones, have become ubiquitous. These devices are constantly being updated with new information, notably traffic and accident information, and they use this information to try to optimize the route suggested to the driver. This is also what a data scientist needs to do as uncertainties fade or disappear.
I like to stop periodically throughout a project, take stock of everything that I’ve learned, and consider it in the larger context of the major goals, similar to how I described the formulation of good questions and goals in chapter 2. But each time I do this, new information arises that can influence decisions. It may not be necessary to pause a project deliberately and formally consider all new information, but it’s often useful, because many people have a tendency to plow ahead with a prior plan that may no longer be the best plan. This relates to the concept of awareness, which I emphasize that every data scientist should maintain, and a formal periodic review of new knowledge can help share this awareness with a team if you’re working on one. Even when working by yourself, a somewhat formal review can be helpful for organization as well as for communicating progress to customers or other stakeholders of the project.
The types of progress assessment and planning described in this chapter can also be done continually or periodically instead of all at once, and this is preferred in some cases. But it should absolutely be performed sometime between the preliminary phases of the project, which I’ve covered in previous chapters, and what I call the execution phase, which I’ll discuss beginning in the next chapter, and which includes most of a typical project’s formal statistical modeling and software development time and effort. Because the execution phase is labor intensive, you want to make sure the plan is good and will address the major goals of the project. You don’t want to have to redo the execution phase.
6.1. What have you learned?
After asking some questions and setting some goals in chapter 2, you surveyed the world of data in chapter 3, wrangled some specific data in chapter 4, and got to know that data in chapter 5. In each step, you learned something, and now you may already be able to answer some of the questions that you posed at the beginning of the project.
For instance, while searching for data, did you find everything you needed, or is a critical chunk of data still missing? After assessing the data, did it contain everything you expected it to? Did the descriptive statistics you calculated turn out as expected, or were there any surprises?
6.1.1. Examples
Because the answers to each of these questions will depend greatly on the details of the project, it’s difficult for me to formalize the process of asking and answering them. Instead I’ll consider the examples I’ve already presented in this book and describe some of my experiences at this stage of those projects. Later in this chapter, I’ll return to these examples and discuss how I used the new information to make subsequent decisions about the projects.
Beer recommendation algorithm
In chapter 2, I briefly described a hypothetical project whose goal was to recommend beers to users of a beer website based on ratings that those users provided for other beers. Because it’s a hypothetical project that I’ve never undertaken (though lots of others have), I can take some liberties in answering “what have I learned?” from the preliminary stages of the project, but I think it’s illustrative nonetheless.
In particular, I mentioned that the data set we started with, a CSV file containing users’ beer ratings, didn’t contain the specific type of beer as one of the columns. This was a problem because the type or style of beer is usually informative in determining whether a person will like it or not. Knowing that the types are missing, my initial plan was either to find a data set containing the data types or infer the types from the name of the beer. If neither of these was possible, I would have to do the project without the types. There were, then, three different paths for analyzing and recommending beers, and determining the optimal path required some preliminary data science.
In surveying the world of data, as in chapter 2, I may have found a list of beers matched with their types. If I did, then that particular uncertainty would become a certainty (if I trusted it), and I would make use of the given beer types in my recommendation algorithm. If I didn’t find that list of beer types, then, as I was assessing my data as described in chapter 4, I may have written a script, hopefully quickly, designed to parse the name of each beer and determine which style it is. If it seemed to work well, I would have made a plan to tweak it to improve it as much as possible, and that particular path would have been realized.
If I couldn’t find a data set with beer types and I also couldn’t manage to write a script that successfully inferred the beer types, then only one possible path would be left: I’d have to go without. Without knowing the beer types, the statistical challenge would be significantly greater but not impossible, and so I’d have to develop a plan with that in mind.
In all three cases I’ve described, I’ve gained new knowledge from the process of searching for data, wrangling it, and then assessing it. This new knowledge influences the optimal plan for continuing along in the project.
Bioinformatics and gene expression
In chapter 3, I introduced a project I worked on as part of my PhD research, which involved analyzing the relationship between the expression of specific microRNAs and individual genes.
While searching for more data and information that could be useful in public bioinformatics data repositories and publications, I found a few databases containing algorithmic predictions of which microRNAs (miRs) are expected to regulate the expression of certain genes. I also found some other analytic tools that achieved some of the same goals that I pursued but in a different way from that which I intended.
For each data set of algorithmic predictions, which were based solely on RNA sequences, I would have to decide if they could be helpful to my project and also if that helpfulness justified the work required to take advantage of the data. Each new data set would require some amount of effort to access, parse, and transform the data into a useful form. In two cases, I decided to put in the work to take advantage of these predictions to inform my statistical models, which I had not yet built.
But while wrangling and assessing the data, I realized that the names of the miRs and the genes didn’t match exactly with the ones in my main data set, which was microarray expression data. Different scientific organizations have developed different naming schemes for genes based on particular needs, and they haven’t yet been unified, but name-conversion tools do exist. If I hoped to take advantage of these prediction data sets, I’d have to include in my plan something that would convert names from one scheme into another so I could match predictions with specific values in the microarray data that are, in some sense, realizations of the results that are predicted.
In addition to that new knowledge concerning naming schemes, in assessing the data I learned something about the distributions of the microarray expression data. Because I used replicate microarrays of most of the biological samples—I put the same biological RNA sample onto multiple microarrays—I could calculate what’s called a technical variance. A technical variance is the variance induced solely by the technology (a microarray) and that has nothing to do with biological processes. What I found was that in a majority of the 10,000 or so genes, the technical variance was greater than the biological variance. This meant that in those cases the measured expression level of the gene had more to do with the randomness of measuring a microscopic chemical compound than it did with biological effects. I had to decide whether I wanted to include those high-technical-variance (or low-biological-variance) genes in my analysis or to ignore them. Some statistical methods don’t handle variance well, and others do, so I would have to choose wisely.
Top performances in track and field
In chapter 4, I discussed how I once analyzed lists of best-ever performances in track and field to score and compare marks across events for both men and women. In particular, I wanted to compare the world records for all events and find out which one was the best.
One of the first choices I had to make in this project was whether I wanted to use the best available no-cost data set, at www.alltime-athletics.com, or pay for what is, supposedly, a more complete data set on another website. I’m a fan of open-access data, so I opted for the free data set, but if I had later realized that I didn’t have enough data to inform my statistical models, I would have had to reconsider my choice.
While examining my data set, I checked the lengths of each of the performance lists, finding that some events, such as the women’s one-mile run, contained only a couple hundred performances, whereas other events, such as the women’s steeplechase, were on the order of 10,000 entries in length. It wasn’t immediately clear whether this vast difference in performance list lengths would cause a problem, but it was definitely new information that I’d have to consider while planning.
Another bit of information that I hadn’t foreseen was that some events, such as high jump, pole vault, and the 100 m and 200 m dashes, produced performance values that were more discrete values than continuous ones. In the high jump and pole vault, the bar is raised progressively to higher heights, and the athletes either jump that high or they don’t, meaning that on each day many athletes have the same performance. On the list of best-ever high jump performances, more than 10 are tied at 2.40 m, more than 30 at 2.37 m, and at lower heights the numbers are larger. Looking at a distribution of performances, such as in a histogram or something comparable, a good argument can be made that a continuous distribution such as the log-normal distribution may not be the best choice. While planning, I’d have to decide whether and how I could compare these events to the others, such as the distance-running events, that produce marks that are obviously continuous because almost no one on the best all-time list is tied with anyone else.
Enron email analysis
In chapter 5, I talked about the set of Enron emails that have been made public and how I, along with my colleagues at the time, was using social network analysis techniques to try to detect suspicious behavior.
This was an open-ended project. We knew that some bad, criminal things happened at Enron, but we didn’t know how they would manifest themselves in the data, if they did at all. We did know that we wanted to treat the email data as a set of communications across a social network, and so the first step to any analysis would be to enable the construction of a social network from the data.
One of the first surprising and disappointing realizations was that, across the 100+ PST files containing the emails, the same email sender (or recipient) could be represented in many different ways. For instance, one of the most prolific emailers in the data set, Jeff Dasovich, might appear in the email’s Sender field as Jeff Dasovich, Jeffrey Dasovich, [email protected], or even DASOVICH, and those are only a few of the many possibilities. This may not seem like a big problem at first glance, but it was. Dasovich himself wasn’t tough to recognize, but there were multiple people named Davis, Thomas, and so on that weren’t so easy.
As part of the data-wrangling process, I ended up writing a script that would try to parse whatever name appeared and determine whether the name had already been encountered, with preference for nicely formatted names and email addresses, but the script was by no means perfect. In some cases, we had two or more different people in the constructed social network who were, in fact, the same person, but we had failed to combine them because the script hadn’t recognized the names as matching each other. We had checked the most prolific senders and recipients manually, but past the top 100 or 200 people, there were no guarantees that the script had matched names correctly. In planning, we had to take into account this uncertainty in the matching of emails with named senders and recipients.
Needless to say, at the beginning of the project we didn’t know that matching names to one another would be one of the biggest challenges that we faced. The task of writing a reasonably successful script consumed a larger portion of my effort than any other aspect of the project, if I recall correctly. The uncertainty of the task and awareness of the complexity of the problem were crucial to the assessment and planning for the execution phase of the project.
After we had a reasonable solution to the name-matching problem, we ran some descriptive statistics on the Enron data set. Surprising or not, we quickly realized that certain people, such as Jeff Dasovich, had sent several thousand emails over the course of a couple of years, whereas key executives such as Ken Lay had sent almost none. Clearly, personal behavior, at least as it relates to email, would have to be considered in our statistical models. We had made an implicit assumption that all significant employees at Enron wrote enough emails for us to model their behavior, but clearly this wasn’t true. Whatever analyses we did later would have to allow for vastly differing general behaviors while still detecting specific behaviors that were anomalous in some sort of criminal sense. This was no small problem and yet was another thing to consider during planning.
6.1.2. Evaluating what you’ve learned
I’ve provided examples but little concrete guidance regarding what you may have learned on your specific project. Concrete guidance would be hard to come by, because every project is different, and it also doesn’t seem possible to group projects into types that will generally produce the same types of lessons and new information. This evaluative phase embodies the uncertainty of data science projects and emphasizes how and why data scientists need to be—first and foremost—always aware, technology-enabled problem solvers. For the real problems in data science, there are no canned solutions. The only solutions are awareness and creativity while applying tools, off-the-shelf or custom, and intelligent interpretation of results. During the preliminary phases of any data science project, you learn some things, and you should take these as seriously as any other information, particularly because they precede and are in a position to inform the main execution phase of the project, and because they are the most project-specific information you have. Because of the possible significance of this new information, performing the evaluation phase described in this chapter can be helpful.
This evaluation phase is a retrospective phase of the project. If you’re someone who takes copious notes, remembering what you’ve done and what the results were won’t be a problem, but if you’re like me and you rarely take notes on your own work, the task of remembering might be more difficult. I’ve begun to tend toward technologies that automatically record my work. Git, in yet another use it wasn’t explicitly designed for, provides some functionality that can help me remember what has happened in the recent history of my project. If my commit messages are informative, sometimes I can reconstruct a project history from them, but this is clearly not ideal. An email trail can also be a memory aid. For that reason, I also now tend toward more wordy emails and Git commit messages; I never know when I’m going to need to remember something and which specific details will be helpful.
In any case, if you’re able to collect and summarize what you’ve learned since the beginning of the project, you’re in good shape. People often begin projects with unrealistic expectations and define their goals in accordance with these expectations, but then they wait too long to readjust their expectations based on new information that proves them unreasonable. That’s the point of this section: every data scientist should pause sometimes and consider whether any new information changes the fundamental expectations and assumptions that underlie the goals that had been formulated when far less project-specific information was available. Reconsidering goals and expectations in light of this new information is the topic of the next section.
6.2. Reconsidering expectations and goals
The summary of new information that we’ve collected according to the previous section could be substantial, insignificant, unsurprising, transformative, bad, good, or of any other description you might care to think up. But you won’t know how to describe the new information until you have it. Principally, however, the new information possesses some quality that colors how you think about the project, its progress, its usefulness, and so on, even if that quality is to confirm some things that you previously believed to be true. As I discussed in chapter 5, confirmation of assumptions is important, and the same is true here for the project’s expectations. It may feel like little progress has been made if you’ve done considerable work only to have your expectations unchanged, but in fact progress was made in the removal of uncertainty. Removal of uncertainty is a form of strengthening the foundation of the project, upon which other more deliberate progress is built.
On the other hand, if your expectations weren’t fulfilled by the project’s new information, then you’re in a different boat entirely. Some folks are emboldened by having their expectations confirmed, whereas others prefer the opposite—they enjoy having their expectations challenged, because it means they’re learning and discovering new things. In the case where the expectations for your project are challenged, or even disproved entirely, it’s an opportunity to put various data science skills to use at once.
6.2.1. Unexpected new information
Discovering something new during the preliminary stages of a data science project isn’t unusual, and you might be tempted to think, “Of course! Given new information, I obviously will take it in stride and make full use of it from then on.” But it’s often not that simple.
Sometimes people so desperately want something to be true that they continue believing it even after it has been proven false. I found that the field of bioinformatics had many such hopefuls (that’s not to say there’s anything wrong with the field as a whole). It must be something about the nexus of two different types of cutting-edge technologies—machines that can extract and measure molecular-biological activity on a cellular level, as well as some of the most sophisticated statistical methods in existence—that makes some people believe that one can save the other.
More than once in the course of my work, I have been presented with a data set produced by a laboratory experiment that took days or even weeks to prepare, and at some point during my analysis I came to the realization that the data was of low quality. This happens sometimes in bioinformatics; even the smallest contamination or slip of the hand can ruin a droplet of dissolved RNA that’s the entire basis for the experiment. Understandably, though, given the large amount of laboratory work involved in creating some data sets, biologists are reluctant to discard them. In one case, I found that the technical variance of a microarray data set was far larger than the biological variance, meaning that the measurements more closely resembled a random number generator than meaningful gene expression values. In another case, we used a time-intensive process that’s considered the gold standard in measuring the expression of individual genes, and the resulting data set was self-contradictory. In both of these cases, in my estimation, the data had been proven virtually worthless, and the experiments would need to be redone (this happens all the time in bioinformatics, which is why it’s important to check the data quality). But in both cases, someone involved with the project wasn’t able to admit that fact and spent a week or more trying to figure out how to salvage the data or how to analyze it in a clever way so that the shortcomings didn’t matter. This, to me, is irrational. It was the scientific equivalent of a sunk cost from financial accounting terminology: the experiment is done and it ended up being a bad investment. Instead of worrying about the money, time, and effort wasted, researchers should find a way to move forward that maximizes the chance of getting good results later. That isn’t to say there aren’t lessons to learn in failures—figuring out why it happened is usually helpful—but the main goal is to optimize the future, not justify the past.
In cases where new information runs contrary to expectations, though uncertainty is reduced, it isn’t reduced in the way expected, so it could feel like uncertainty is added, because those involved probably haven’t yet thought through all implications. Consider a close battle for an election in which a huge underdog has only recently made it into widespread attention. If the underdog wins, all the uncertainty is removed in the moment the result is announced. But because that result was not expected, it feels less certain than the case where the expected candidate wins, because most people would have been mentally prepared for the expected win of the heavy favorite and many of its implications.
This may not seem like data science, but this line of thinking has certainly played a role in my work. When I deal with expectations—and with them being proven right, wrong, or somewhere in between—feelings often get involved. Feelings are not data science, but if feelings affect how I react to new information, they become relevant. Although handling uncertainty is one of the principal skills of a data scientist, it’s human to react emotionally to uncertainty and to being right or wrong. Data scientists are, after all, only human.
The solution to all of this, if there is one, is to do everything to take all emotion out of the decision-making process. This is easier said than done, for me as well as almost everyone I’ve ever worked with. Everyone enjoys being right, and few data scientists or software engineers enjoy changing a plan midway through, in particular for large projects. Here are a few strategies for eliminating emotion from data science decision making:
- Formality— Make lists, create flow charts, or write logical if-then statements showing the new information directly affecting future results. The most important task is to write these down so that you have a permanent record of why you chose a certain new path based on this new information.
- Consult a colleague— A colleague who isn’t invested in the project might be best, but certainly consult others on the project as well. Talking the new information through often helps, but having an outsider who listens well think through your new information and your plans to handle it can be invaluable.
- Search the internet— This may not apply in some cases, but the world’s data scientists and statisticians have seen a lot of unexpected results. If you’re clever with a search engine and can whittle your result and pending decision into somewhat generic terms, the internet can be a big help.
Once you’ve reduced the problem to its core facts, including all the new information that you have and all the work you’ve done so far, making any new goals or adjusting any old goals based on the new information is a rational process that has no emotional penalties for ditching prior work that ended up being worthless.
6.2.2. Adjusting goals
Regardless of whether your expectations were met or whether you were completely surprised by preliminary results, it’s often worthwhile to evaluate and possibly adjust your project’s goals. Chapter 2 described a process for gathering initial information, asking good questions, and planning some ways to answer those questions that lead to fulfillment of the project’s goals. You want to revisit that same process here, in the presence of the new information you have as a result of the early exploratory stages of the project, to answer these questions again:
- What is possible?
- What is valuable?
- What is efficient?
The practical limit of “What is possible?” is the counterbalance of the business-oriented daydreamer’s question “What is valuable?” and both are extremes that frame the pragmatic inquiry “What is efficient?” which ends up possibly being an important amalgam of the prior two.
What is possible?
While asking yourself what is possible at this stage of the project, you should consider the same things you did at the beginning of the project: data, software, obstacles, and many others. But because you know more now than you did then, some things that seemed impossible earlier may seem possible now, and some things that you thought would be possible may now appear quite the opposite.
Usually at this point, it’s the data sets that make things seem less possible. There’s a tendency to be overly optimistic about the capability and content of data before you dig in and explore a little. By now you know a lot more and can draw far more informed conclusions about possibility.
What is valuable?
Most likely, the values of the goals of the project haven’t changed much, but it’s often worth considering them again for reference. On the other hand, in some fast-moving industries, the value estimates of various goals may indeed have changed. In those cases, it’s probably best to go through the list of goals with the customer to see what has changed and how.
What is efficient?
Data and software details in particular might have made some paths and goals seem easier or harder, more or less resource intensive, or otherwise different from before. Running the numbers again conceptually can help you reoptimize the plans to get the most benefit from the resources you have.
6.2.3. Consider more exploratory work
Sometimes during this evaluative stage, it becomes obvious that you haven’t learned as much as you would have liked from the earlier exploratory phase. But you may have more informed ideas about what specific exploration would have led to more and better knowledge.
For example, consider the beer recommendation algorithm project I’ve already discussed. Perhaps during the exploratory phase you wrote a script that tried to infer the beer type from the name of the beer, a possible tactic I discussed earlier in this chapter. The script seemed to work pretty well, but someone asks you, “How good is it?” and you realize you didn’t explicitly evaluate the script’s performance. In this case, it would be good to measure the performance in an objective way, so you can be reasonably sure it works well. A decent strategy for measuring performance is to spot-check a bunch of beer types that were inferred by the script. Randomly picking 20, 50, or even 100 beers and checking the inferred type against, say, the brewer’s web page would be a reliable way to get a statistic—probably the percentage of correctly inferred types—that tells you how well your script is doing. A good statistic can lend a lot of credibility to what you’ve done, and a bad one means you might have to improve the script.
Similarly, questions and concerns during this evaluative and planning stage can often indicate the usefulness of other exploratory work that you haven’t done yet. It’s OK—and sometimes good—to go back and do more exploring if it seems like it will be beneficial.
6.3. Planning
As in chapter 2, evaluating and setting goals immediately precedes creating a plan. Some folks might like to do them at the same time, but I like to separate them, at least conceptually, because planning involves a lot of details—specifics about time, resources, people, schedules, monetary costs, for example—that aren’t usually directly relevant to the setting of goals. Which team member will be working on which aspect of the project and when shouldn’t play a large role in setting the principal goals of the project. But that does have a role in planning.
As in the earlier planning phase, uncertainties and flexible paths should be in the forefront of your mind. You know more about your project now, so some of the uncertainties that were present before are no longer there, but certain new ones have popped up.
Think of your plan as a tentative route through a city with streets that are constantly under construction. You know where you’d like to go and a few ways to get there, but at every intersection there might be a road closed, bad traffic, or pavement that’s pocked and crumbling. You’ll have to make decisions as you arrive at these obstacles, but for now it’s enough to have a backup plan or two.
6.3.1. Examples
Earlier, I discussed four projects and some specific things that I learned or might have learned from them during their prior exploratory phases. I’d like to discuss them again now within the context of setting goals and planning. As with lessons learned, the processes of setting goals and planning are project specific and don’t lend themselves well to concrete if-then statements, so examples can be illustrative and invaluable.
Beer recommendation algorithm
The goal of a beer recommendation algorithm is possibly singular: make good beer recommendations. But you probably want to be more specific than that. Do you want to make a top-10 list of beers for each user, or do you want to have the user select a beer or a style before recommending something similar that the user would like? This is one case where the job of a data scientist wanders into the typical duties of a product designer. Think back to chapter 2’s discussion of listening to and understanding the customer: what will the customer be doing with the product of your project? Let’s assume that—after much deliberation and consulting both the project team and some prospective users—a goal should be to make a top-10 list of beers that each user should try.
Let’s go back to the goal-setting filter I proposed: possible, valuable, and efficient. Making such a top-10 list is possible; depending on the quality of the statistical methods employed, the list could range from good to bad, but regardless of that, making a list is certainly possible. The list is also valuable in some sense; the project is predicated on the fact that someone somewhere wants to discover some new beers that they would like, so let’s assume that it’s valuable; otherwise, the project itself is not valuable. The goal seems efficient; it seems 100% possible, and it’s difficult to think of a related goal that provides more value for less effort. In terms of possibility, value, and efficiency, this goal is straightforward: alternatives can be considered, but few arguments can be made against a top-10 list.
That’s the main goal, then: a list of beers that a user will probably like if they try them. What about a plan? I’ve talked about a plan as a set of contingencies intertwined with a set of uncertainties. The uncertainties of building a beer recommendation algorithm lie mainly in the statistical methods as well as in the data set’s ability to support those methods. Even the best statistical methods won’t give good results when the data set is too small or unreliable. Therefore, the largest uncertainty in the project is the quality of the output of the algorithm itself. You don’t know the probability that a user of the algorithm will like a beer that’s recommended.
A good plan would consider that the algorithm might not be as good as you hope it will be. If you have a perfect algorithm, all users will love the beers that are recommended, but if the algorithm gets some of them wrong, what should you do? As a statistician, I would first suggest that you diagnose some of the bad recommendations and modify the algorithm to account for these. A few iterations of this might solve the problem, or it might not.
Another alternative is to develop a product that is error friendly. Depending on how the users interact with the algorithm, they may be expecting perfect beer recommendations, or they may fully understand that mistakes can be made. A scoring system is a possible solution that comes more from a product design perspective than an analytic one. If the algorithm makes mistakes, but it gives a recommendation score that indicates how reliable the recommendation is (and this score is itself reliable), then the users would tolerate some erroneous recommendations in the interest of taking a risk for finding a good beer.
With those two alternatives, a good plan is forming. If the algorithm produces reliable results, then you can trust the top-10 lists, and you can feel assured in presenting the lists to users. But if the lists aren’t that reliable, you should either revise the statistical methods to make the lists more reliable or generate a recommendation reliability score that conveys to users that not every recommendation is guaranteed to be enjoyed. Therefore, in the future, there are two possible paths and a choice to make. But how will you make that choice? The process of making the choice should also be included in the plan, insofar as it is possible.
In this case, in the future, the choice between the two paths depends on the reliability of the recommendations generated by the algorithm, so you need a way to evaluate the reliability of recommendations, and you need to include this in the plan. I’ll discuss these statistical methods in more detail in later chapters, but a good way to check the accuracy of predictions from a statistical algorithm is to withhold some of the data set from the algorithm while it is training or learning and then test the algorithm by checking to see whether it predicts that data correctly. In this project, you would probably withhold a few beer recommendations for each user during training of the statistical methods and then check to see if the beers that were highly rated by a user but withheld during training were indeed recommended by the algorithm. Likewise, you can check to see if low-rated beers were kept off the recommendation lists. In any case, recommendations by the algorithm should corroborate the user ratings that were withheld; if they don’t, then the algorithm isn’t that good, and you’ll need to choose one of the remedial paths just mentioned.
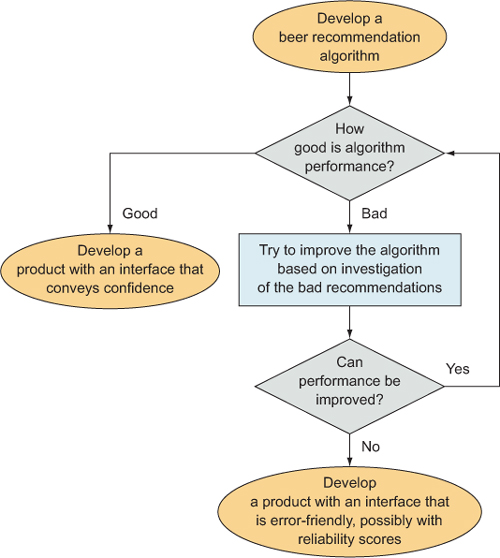
That, in aggregate, is a good if basic plan. Figure 6.2 shows the plan in the form of a flow chart. Notice that this plan consists of a set of steps that are to be followed, but also there is a major uncertainty regarding the algorithm performance. Depending on the outcome of the performance evaluation, different paths can be taken. Acknowledging beforehand that this uncertainty exists and that it plays a major role in determining what happens next is hugely informative during this planning phase, both for you as a data scientist as well as the customers who are depending on you. I discuss communicating revised goals and plans to your customers in the next section, after I’ve covered the rest of the examples.
Figure 6.2. A flowchart showing a possible plan for developing a beer recommendation application
Bioinformatics and gene expression
The purpose of this project, in general, was to figure out whether miRs affected the expression levels of genes, specifically within the context of stem cell development in mice. Possible goals included the following:
- Discovery of miR–gene pairs that are most likely to interact with each other
- Discovery of miRs that regulate stem cell development
- Discovery of pathways (sequences of causes and effects) among miRs and genes affecting stem cell development and regulation
Goal 1 included a statistical analysis of specific correlations between miRs and genes within the time-series data that I already had. There were no guarantees of how reliable the results would be, but the analysis was certainly possible. Likewise, goal 2 required a statistical analysis of the expression levels of miRs throughout the stages of stem cell development. Again, this was entirely possible, though it wasn’t certain that the results of the statistical methods would be correct in terms of functional biology. Goal 3 was a bit more complicated. Pathways involve more than two miRs or genes, and so discovering a single pathway required proving multiple correlations among the three-plus constituents, plus the added work of showing that the multiple correlations were connected by more than coincidence. A biological scientific journal would expect substantial evidence of the connections between the individual parts before it would publish my article on the discovery of pathways. Goal 3, though possible, was far more complicated and harder to justify than the other two possible goals. Also, the work required to analyze a pathway statistically is greater than a simple miR–gene interaction.
The value of each of these goals was somewhat uncertain. Definitely, discoveries of new miR–gene interactions, miRs that regulate stem cell development, or stem cell pathways are all valuable, but the value of each would depend on the genes involved and how strongly I could justify the results. If I discovered a novel interaction or pathway that could be related, convincingly, to a popular biological phenomenon such as genetic disease or sexual differentiation, then I would have a much better chance of publishing the research in a high-impact journal. But all three goals had approximately the same chance of giving such valuable results, so I considered the value of each to be equal.
While evaluating the efficiency of the goals, it was immediately obvious that goal 3, being more complicated, would require vastly more work than the others. Goals 1 and 2 demanded roughly the same amount of work and were also roughly equal in their chance of giving meaningful results. The only tiebreaker between those two goals was that determining specific miRs that interacted with specific genes seemed to be slightly more interesting to the scientific community than discovering stem cells that could only generally be associated with stem cell development.
So with goal 1 being slightly more valuable and efficient than goal 2, I chose goal 1 as my main goal, with goal 2 a close second and goal 3 a distant third, to be done only if I had plenty of extra time after achieving the first two.
Given these goals, the plan would necessarily include developing statistical methods that aimed to discover the miR–gene pairs of goal 1 while possibly taking into account the regulating miRs of goal 2. The correlations discovered in trying to achieve those two goals might then be assembled in such a way as to construct plausible pathways as in goal 3.
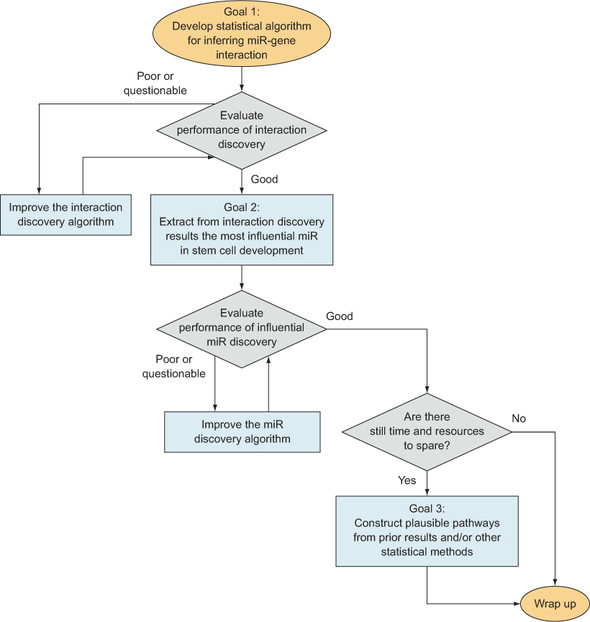
A flow chart describing my plan appears in figure 6.3. As you can see, this plan is fairly straightforward. Scientific research tends toward this structure: you work on improving methods and results until you have a result that the scientific community will appreciate, at which point you write an article about your research and then submit it for publication. This contrasts with typical business projects, in which stricter constraints on time usually, to some extent, require data scientists to compromise the quality of results in order to meet a deadline. On the other hand, although academic researchers don’t usually have a strong time constraint other than conference application deadlines, they’re usually held to a higher standard of statistical rigor and significance of discovery than in industry. An academic data scientist’s plan will probably look different from the plan of a data scientist in a comparable private industry, which is another factor in settling on a specific plan for your particular project.
Figure 6.3. A flowchart showing the basic plan for my gene interaction project
Top performances in track and field
In chapter 4, I discussed one of my projects in which I analyzed lists of best-ever performances in the various events of track and field. As I mentioned earlier in this chapter, two of the main uncertainties remaining in the project concerned the quality and completeness of the data as related to the power of the statistical methods I applied to them.
The first uncertainty could be stated: is there enough data? Because I had lists of the best performances by elite athletes and not complete lists of all performances ever, I would be looking only at data from the tail of the statistical distributions, which makes estimating parameters even more difficult. To determine whether there is enough data—something I’ll cover in more depth in later chapters—I check to see if the estimation variance of the estimated parameters is small enough, and I also check the estimation variance of predictions generated by the model to make sure that it’s not making predictions that vary wildly with only small changes of the inputs. Most important, I wouldn’t know if I had enough data until I wrote the code that applies the statistical model to the data and generates estimates. If I didn’t have enough data, I would have to consider purchasing more data from another website (though I’m not sure how much more data it would have, if any) or, possibly, making the model simpler so that it requires less data.
The second main uncertainty concerned the statistical distribution I would use. I wanted to use a log-normal distribution within the statistical model, but before writing the statistical code, I couldn’t know for sure whether the distribution was appropriate. During the exploratory phase described in chapter 5, I did generate some histograms of the data, and the histograms seemed to follow the tail of a bell curve like the normal curve, but it wasn’t until later that I wrote the code that estimated optimal parameters for such a curve and compared them to the data, so, for our purposes in this section, that uncertainty still exists.
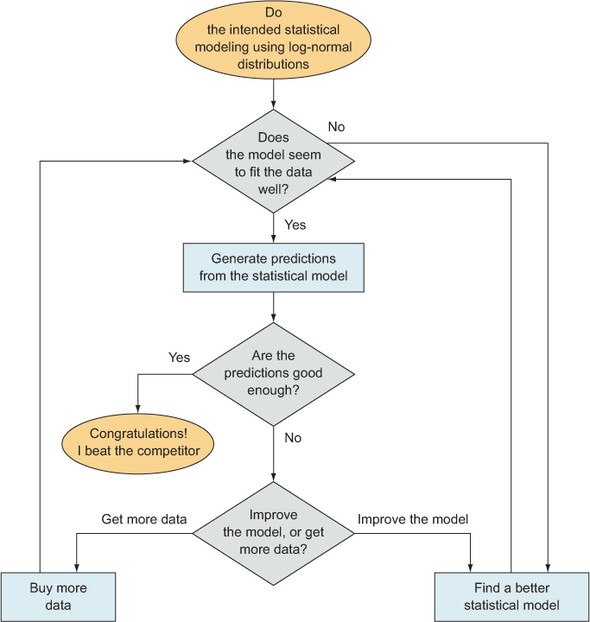
Finally, there’s the uncertainty that’s ever present in statistical challenges: will the results be good enough? There’s almost never a guarantee that you’ll get good results, and this project was no exception. For academic purposes—and this was an academic project I intended to publish in a scientific journal—”good enough” usually implies “better than the next guy.” By that I mean that I would have to demonstrate that the scoring system I developed was more reliable, in some sense, than other existing methods that were designed for the same purpose. My principal competitor was the set of IAAF Scoring Tables of Athletics. I chose to compare predictions that are implied by their scoring tables and my scoring tables to see which ones predicted better. If I fell short, then I pretty much had nothing I could publish. I would have to improve the model and the predictions or—keep in mind this is the shady, no-good, Evil Statistician way of doing it—I’d change the way I compare the two scoring systems to work in my favor. I mention the second, very, very bad way of improving results not because I would suggest it, but because people do that, and anyone who is reading a comparison of statistical methods should keep that in mind!
Given these three uncertainties, I made the plan that appears in figure 6.4. There are two checkpoints—data fitting the distribution and then the quality of the predictions—and if I didn’t get to the checkpoints without problems, I had one or two possible solutions for each. At the distribution checkpoint, if something looked wrong, I would find a better distribution, and at the quality of predictions checkpoint I could optionally get more data or improve the model, whichever seemed more reasonable to me at the time. If I had wanted to write an even more thorough plan, I could include specific criteria that would convince me to take the data route over the model quality route, or vice versa.
Figure 6.4. A flowchart showing the basic plan for my project involving the analysis of track and field performances
By now you’ve probably noticed that the primary sources of uncertainty are closely related to data and statistics. This is usually true, and it’s true for me because I’m more of a statistician than a software developer, and wherever there is a statistical model, uncertainty is guaranteed.
Enron email analysis
In chapter 5, I introduced a project that was intended to find and analyze criminal, suspicious, or negligent behavior within the public set of Enron emails and to apply concepts from the field of social network analysis to describe them. Nearly everything about the project was an uncertainty. Not only did we have the data challenges I mentioned near the beginning of this chapter, but we also did not know of any specific examples of criminal or suspicious behavior within the data set itself. We mostly assumed they were there somewhere—a lot of bad stuff went on at Enron—but with more than 100,000 emails, it would be hard to find them.
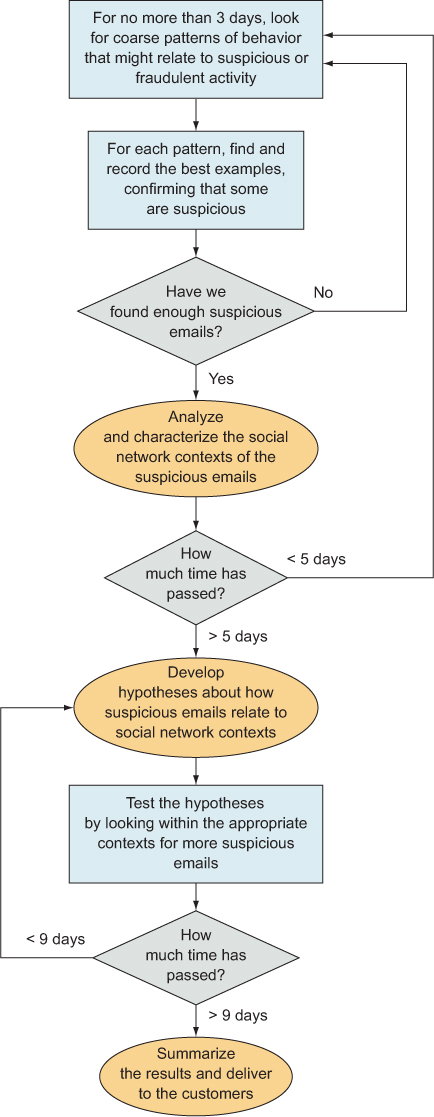
Because we had plenty of news stories and research about the Enron scandal, and we had on hand a few experts in the area of corporate fraud, we thought it might be a reasonable idea to develop a few coarse statistical analyses to filter the data, after which we could read through the top-scoring 100 emails or so, looking for good examples of suspicious behavior. If we did this a few times, it might be more efficient than trying to read all the emails until we found some that were suspicious.
Another suggestion was to build a full-fledged statistical model of social network behavior and try to use it to find suspicious behavior. This, to me, seemed like putting the cart before the horse. Or at the least it would leave us open to some serious confirmation bias in the event that we happened to find some interesting emails—did the methods work, or did we stumble into the results we were looking for?
Because almost nothing was concrete or guaranteed about this project, our plan would be more concerned with time and resource management than with a specific set of steps. Given that we had a deadline, even though it was a fuzzy one, we had to keep in mind that we needed to produce some results by the end of the project. We couldn’t use the academic strategy of working until there are good results and then submitting them, so we used a strategy that some people call time boxing. It’s not as exciting as it sounds—sorry. It’s placing a somewhat-arbitrary time limit on an open-ended task to remind yourself that you have to move on.
For a 10-day project time line, our loosely defined plan looked something like the flow chart that appears in figure 6.5. It’s definitely a fuzzy plan, but at least it’s something to start from, and it makes sure the whole team knows how you expect the time line to work out, even if it doesn’t work out exactly that way. Even the plan itself can change, given new information or other changes to the goals, priorities, or other aspects of the situation. The most notable characteristic of this example, when compared to the others, is that it shows how to create a schedule even in the face of near-absolute uncertainty, wide-open goals, and a deadline.
Figure 6.5. A flowchart showing the basic plan for the Enron project
6.4. Communicating new goals
Plans and goals can change at any moment, given new information or new constraints or for any other reason. You must communicate significant changes to everyone involved with the project, including the customer. The project’s customer obviously has a vested interest in what the final product of the project should be—otherwise the project wouldn’t exist—so the customer should be made aware of any changes to the goals. Because most customers like to be kept informed, it’s often advisable to inform them of your plans, new or old, for how you will achieve those goals. A customer might also be interested in a progress report including what preliminary results you have so far and how you got them, but these are of the lowest priority.
I mention priority in this context because what’s often interesting or important to a data scientist isn’t interesting or important to a customer who is not a data scientist. For example, I’ve been to many talks at biological conferences in which the presenter seems more interested in telling the story of how they got their results than in presenting the results themselves and their impact. For a data scientist, the story of the project—typically including every twist, turn, and obstacle—represents the intrigue of the work that has been done, the difficulty, and the ultimate victory. But non–data scientists are most interested in whether you got good results and whether they can trust that your good results weren’t a fluke. Explaining that data wrangling took a full week, for example, serves only to say, “My job can be tough at times,” and might justify a missed deadline but little else.
Focus on what the customer cares about: progress has been made, and the current expected, achievable goals are X, Y, and Z. They may have questions, which is great, and they may be interested in hearing about all aspects of your project, but in my experience most are not. My one and only must-have conclusion for a meeting with the customer at this stage is that I communicate clearly what the new goals are and that they approve them. Everything else is optional.
You may consider communicating your basic plan to the customer, particularly if you’re using any of their resources to complete the project. They may have suggestions, advice, or other domain knowledge that you haven’t experienced yet. If their resources are involved, such as databases, computers, other employees, then they will certainly be interested in hearing how and how much you’ll be making use of them.
Finally, as I mentioned, preliminary results and the story of how you got them are of the lowest priority. In my experience, sharing these can be helpful, but only for a few reasons, such as when doing so serves the following purposes:
- To bolster the customer’s confidence in the case of promising preliminary results
- To gain the customer’s trust by showing that your methods are sound
- To make the customer feel like a data scientist on the team in the case of a good story that the customer can understand
All of these can be desirable under various circumstances, but in communication with the customer it’s best to ensure that you don’t lose sight of the main intersection between your project role and theirs: the goals.
Exercises
Continuing with the Filthy Money Forecasting personal finance app scenario first described in chapter 2 and relating to previous chapters’ exercises, try these:
Suppose that your preliminary analyses and descriptive statistics from the previous chapter lead you to believe that you can probably generate some reliable forecasts for active users with financial accounts that have many transactions, but you don’t think you can do the same for users and accounts with relatively few transactions. Translate this finding into the “What is possible? What is valuable? What is efficient?” framework for adjusting goals.
Based on your answer to the previous question, describe a general plan for generating forecasts within the app.
Summary
- An explicit and formal evaluation phase such as I suggest here can help you organize your progress, your goals, your plan, and your knowledge of the project.
- Before proceeding, ask, “What have I learned?”
- Adjust expectations and goals based on preliminary findings.
- Make a plan based on any new information and new goals, while taking into account the inevitable uncertainties.
- Communicate to the customer the new goals, plans, and progress.