
Designing the Enterprise-Level Portfolio Management System
2.3 Doing the Financial Calculations
2.5 Dealing With Strategic Changes
Alice: What road shall I take?
Cheshire cat: Where are you going?
Alice: I don’t know
Cheshire cat: Then any road will do!
—From Alice in Wonderland, by Lewis Carroll
Now that the organization is ready to accept change, it’s time to decide what types of projects will be part of the portfolio and how to select and prioritize them. We need to determine this before we can design the system. To do it, we need continuous feedback from the decision makers so that we can select the right filters and prioritize the projects properly to support strategy just as they would do if these decision makers were perfectly rational and objective.
This is not quite as simple as it sounds for two reasons. The first reason is that many of the executives will not agree with each other on what is most important. People at this level are used to having their decisions carried out, and your EPMS will remove their ability to pick and choose their pet projects. There will be a lot of discussion about the “right” filters to use so that pet projects are approved as well as discussions about excluding projects from the system that don’t make the cut but are politically important.
We can accommodate this by developing an approach that handles different types of projects differently. We’ll look at the possible categories of projects and decide how much to fund each category.
The second reason is that the strategic goals will change over time and the portfolio has to continually adapt to the changes, so the EPMS must be designed to accommodate changes. It is very rare for decision makers to kill projects even if they no longer make sense. The reasons for keeping dead projects walking is purely emotional. The EPMS will remove the emotional buy-in and more quickly kill projects that are no longer needed and tie up resources that could be better used elsewhere. The second reason is more challenging, but its impacts can be mitigated by developing a flexible approach to the selection process.
Why should we worry about the requirements of the filters? Because the filtering criteria we will build into the EPMS reflect the values of the executive level. They want to select the projects that will provided the greatest value to the organization and reject the projects that provide little value.
But, value is relative. What is highly valued to one person may be a low-value item to another. The executives will have to determine what value means before you can create the filters. The following Table 2.11 shows the different types of value that are important to the executive level:
Table 2.1 Values important to executives
Value Type |
Benefit definition Financial |
Examples |
||
Financial |
Nonfinancial |
|||
Tangible |
Defined |
Value can be predicted with certainty. |
Cost reduction |
Less steps in the process |
Expected |
Value can be forecast based on historical data with high degree of confidence. |
Increase in sales |
Fulfilling the tasks more rapidly |
|
Anticipated |
Benefits are anticipated, but its value cannot be forecasted with certainty. |
Lower insurance premiums |
Higher customer satisfaction |
|
Intangible |
Can be anticipated but not substantiated. Proxy (indirect) measures can be used to verify their realization. |
Image enhancement. (evidence: higher number of positive comments in the press) |
||
We’ll talk about requirements in more detail in the next chapter, but we’ll discuss them here at a high level to get you started thinking about them.
There are two major cautions here:
First, DO NOT get too detailed. The EPMS should not cure cancer or bring about world peace. Keep it simple or you will get so stuck in trying to do everything that you will accomplish nothing. Because your company’s infrastructure, applications, and projects have become so intertwined, you do what seems natural: You try to untangle the mess at the root.
A lot of companies have tried the same kind of “detailed, bottom-up” approach to project and portfolio management. Very few are successful. As Gartner analysts explained:2
[many early customers] believed they must implement PPM* software automation at painful levels of detail (such as task- and assignment-level time reporting).... Unfortunately, many initial PPM software investments failed when this bottom-up approach to project portfolio management was chosen, due mainly to the high levels of complexity, low levels of adoption and extensive organization change management required to get the entire execution side of a project organization using the same system.
In other words, a “bottom-up” effort at PPM gets mired in the tactical details, where many hands touch projects and many infrastructure components collide, and where change is, therefore, difficult to enforce.
Second, do not include “exploration” projects in here. Exploration projects are those that lie somewhere between pure research and detailed development. This projects have a history of being high risk with a low probability of successful financial return. By contrast, the small percentage that are financially successful tend to be very successful, with large benefits from new product development and new markets. Any normal “filtering” process is much more likely to kill these projects than to approve them3.
Finally, there are also operational aspects that need to be included during the design effort. These are covered in Step 3.
2.1.1 You Need Requirements
Is it important to have the requirements before you start? Only if you want to be successful and give the organization something it will actually use. In the implementation of major software systems such as Enterprise Resource Planning (ERP) applications, there is an extremely high failure rate due to new business processes being put in place but nobody using it. (Recall our section on implementing changes in an organization). Kimberly–Clark ($14 billion, 64,000 employees worldwide) installed SAP. After one week, they had fewer than 30 problems reported worldwide. Their 24/7 customer support center for the project was cut back after only two days due to the low volume of problems. Why? Because their strong requirements traceability process ensured all requirements were captured and managed. The project manager understood what the need for the new system was and satisfied those needs.
We’re going to go into more detail in requirements in the next section.
Story
During one ERP audit at a US Government agency the author was leading, the audit team was asking questions about how the requirements for the new system were determined and managed. The different agencies involved each set up their own requirements teams to determine what their specific needs were and created cross-agency teams to determine common requirements such as security and access. The implementation team captured and tracked these requirements in the tool Rational Rose. They got good audit points for their disciplined approach
(Unfortunately, when we asked for a current copy of the requirements for our records, we were told that the entire requirements database was stored on one contractor’s hard drive and the hard drive had crashed two weeks before. All of the data was lost because there was no digital backup. The only data available was on the last printout.)
Requirements gathering is NOT documenting what the users want, because they often do not know. Requirements gathering IS helping the users determine what they need and want.
If you cannot identify what people expect, then you cannot deliver it. In this situation, the project should be shut down immediately, rather than wasting more time and effort. A significant cause of the high failure rate of technology projects is that they cannot deliver a final product that people will actually use.
Law of Project Management |
Users will start to change the requirements as soon as they understand what it is they originally asked for. |
As just stated, this is the process of gathering and analyzing the business requirements. We’re doing this for the business, not just to implement something new. So, our primary responsibility is to identify what those needs and expectations are and plan for how we can satisfy them.
Let’s start out by defining what a requirement is. For our purposes a requirement is a specific statement of a need, sufficiently detailed that there is no misunderstanding about what is being said. Business requirements are very high level and, from the viewpoint of an engineer or a programmer, are very vague and unspecific. These high-level requirements are then taken down into much greater levels of detail in a process called requirements decomposition to the point where the technical people can design solutions to satisfy them.
When most people think about requirements, they focus on what the end product is supposed to be or to do. Is it an e-commerce website? A new car or plane? A hospital? These requirements are called functional requirements. They are directly tied to the goal of the final product. But, there are many other types of requirements. In most projects, these nonfunctional requirements will be the majority of the requirements you have to identify and manage.
At the highest level, we have the business needs. We obtain these in a variety of methods that we’ll talk about shortly. The next level down is where we break out the functional requirements (what is it that this end product should do) and a variety of nonfunctional requirements:
“ilities”—Maintainability, reliability, upgradability, sustainability, and so on. For the EPMS, we really don’t care about these, except as they apply to any tools we might buy or build.
Performance—How well does this new system perform? If I send a request for information, how fast and how accurately does it respond to my request? Is the system available 24/7, or are there planned outages for maintenance? This is a really critical category for the users.
Privacy and security—How secure is the data? Are there levels of security so that different users have different levels of access? Are there built-in privacy protections?
Usability—This is the interface between the users and the system itself. While many developers consider this a low-priority requirement, the reality is that most complex systems (such as ERP systems) fail because the users won’t use the system once it is installed. It is actually a very high-priority requirement to make the system easy to use.
Health and safety—For the purposes of defining the EPMS requirements, we don’t have to worry about this category.
Environmental—Another category we won’t worry about for our EPMS. It will not have any environmental impact.
For the PMO itself, the requirements tree might look something like this:
These are the requirements that you must discover through the requirements gathering processes we will talk about later. Once you have a good handle on these, now you can start designing the system and assessing any commercial tools you will purchase. Having collected this level of requirements, now you can decompose them into more details and document the more detailed and more technical requirements:
• Specific business processes
• Detailed architecture and technical design requirements
• Integration and Test (I&T) needs
• Interface requirements (internal to the EPMS and between the EPMS and the organization)
• Implementation requirements showing how you’re going to put the system into operations
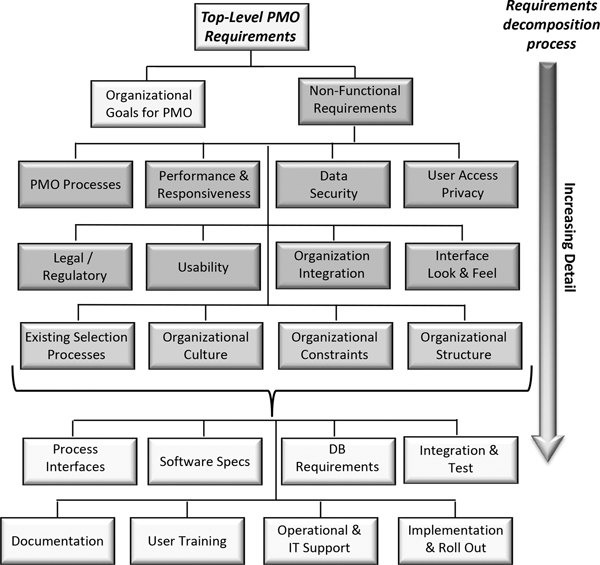
Figure 2.1-1 Requirements decomposition tree
And then finally, how are you going to document the system? How are people going to operate it? How are you going to train them in the system and in their new jobs?
Notice that there are requirements here in the form of constraints. When designing the new EPMS, you must take into account the existing processes for selecting and prioritizing projects. If the new EPMS gives radically different results than the existing system, it will be dismissed as useless. Organizational constraints, such as the communications culture or resource limitations, also need to be included in the design. The organizational structure is another area to consider. An EPMS designed for a fully projectized organization is very different than one in a purely functional organization.
Each EPMS must be designed with regard to the existing organization, its goals, its culture, and its constraints. This varies by industry and by the specific organization. Each is different. Let’s look at the large construction/engineering industry for example. The projects owners engage in are generally high value (therefore very risky organizationally) and long term (increasing the risks). What are the evaluation criteria and constraints they typically concern themselves with in selecting which projects to accept?4:
Financial
• Life cycle return on investment (ROI)
• Return on assets employed
• Net present value of cash flows (NPV)
• Payback period
• Total capital expenditures
• Product/project gross margins
Market
• Market share
• Market growth and duration
• Period of profitable production product flexibility
• Customer impacts
Strategic
• Flexibility
• Resiliency
• Contribution to overall portfolio performance
• Enablement of Strategic Business Objective (SBO) achievement
• Enablement of other portfolio projects
• Critical resource utilization
Sustainability or triple bottom-line-focused criteria
• Economic
Social
• Community impacts
• Capacity building
• New industry/business creation
• Workforce impacts
• Environmental, health and safety
• Airborne emissions
• Water consumption
• Discharge water quality
• Environmental degradation
• Worker health and safety
• Public health and safety
Risk
• Economic or market uncertainties
• Other event risks
• Financing uncertainties
• Cost uncertainties
• Schedule uncertainties
• Labor risks
• Stakeholder risks
• Sovereign and legislative risks
• Political risks
• Technology risks
• Intellectual property risks
• Business model risks
• Project execution risks
You can see why the BOGGSAT approach mentioned in the Preface would have severe limitations in selecting which projects to do when you take into account all of the constraints and our limited decision-making capabilities.
2.1.2 Requirement Priorities
Once you have gathered the needs of upper management, you take the answers you’re given and compile and analyze them. Did they give you needs that you can satisfy? Do any of the needs given by different managers contradict needs from other managers? Are there needs that are duplicated? Once you have removed the duplicates and resolved any conflicts, meet as a group with the managers again and present the list of requirements for their approval.
At this point, you will start prioritizing the requirements. They will want everything they told you, but almost never is there enough time and resources to do everything. So, the requirements need to be prioritized into:
Mandatory
A mandatory requirement is an essential feature of the EPMS. Failure to implement the requirement means the system will not meet management’s needs. All mandatory requirements must be implemented in the first planned release.
Highly Desirable
A highly desirable requirement describes a requirement that is important to the effectiveness and efficiency of the system. The missing features cannot easily be provided by software or processes.
Lack of inclusion of an important feature may affect management’s satisfaction with the EPMS, but the planned release will not be delayed due to lack of any highly desirable feature. Think about implementing these in the first upgrade if you can’t do them now.
Desirable
A desirable requirement describes a management need that, if implemented, will have a negligible impact on the functionality of the system.
Desirable requirements would be more likely than highly desirable requirements to be deferred or deleted if time or resources become scarce.
Optional
An optional requirement describes a requirement or features that will be used less frequently, or for which reasonably efficient workarounds can be achieved. The planned release will not be delayed due to lack of an optional priority feature. It’s a “nice to have” feature, rather than something that is absolutely needed.
Some consultants use the simple “MoSCoW” rule. The acronym stands for Must, Should, Could, and Would:
• M—Must complete this requirement to meet management’s needs
• S—Should do this requirement if possible, but project success does not rely on it
• C—Could do this requirement if it does not affect anything else on the project
• W—Would like to have this requirement later, but cannot be done now
Priorities must be determined through constant coordination with the top-level decision makers. It is their priorities that have to be built into the EPMS. But, they must be made to understand that there are compromises that will be necessary.
If management tells you that all their requirements are equally important, push back and ask them what could be cut out if there are schedule problems or cost over-runs? As a general guideline, no more than 25 percent of the requirements should be mandatory. These are the core requirements. These are the ones you concentrate your resources on implementing.
One common approach, when you have too many requirements to satisfy with the resources and schedule you have, is to develop the EPMS in multiple stages. This is a highly recommended approach. Satisfy the primary requirements first, then once the basis of the EPMS is implemented, develop a follow-on project to satisfy remaining requirements. This has the benefit of providing a more useful set of requirements during the follow-on project because people now can see what they got in the first rollout.
2.1.3 Requirements Documentation and Management
Law of Project Management |
Always document your requirements, a verbal requirement isn’t worth the paper it’s written on. |
Requirements must be documented. This is not negotiable. Never accept a verbal request for a requirement or a change to a requirement. If you do, in six months, what you remember will be different than what the requestor remembers. And, because they own the requirements, not you, you will have implemented the wrong requirement. If a stakeholder meets you in the hallway and asks you for a new requirement, always follow up the conversation with an e-mail documenting what you heard. Even better, ask them to fill out a requirements request sheet. That way it is in their own words.
Story
At one US Federal government organization the author led an audit team doing an independent review of an ERP package that was being installed. When interviewing the CIO the question was asked: “Do you accept verbal requirements?” The CIO emphatically said no, only written requirements were accepted by the project. The next day the author interviewed the project manager and asked the same question “Do you accept verbal requirements?” The project manager’s reply? “Sure, we get them all the time. No problem.”
There is one additional advantage to having stakeholders fill out a request sheet if they want to add or to change a requirement. Software history shows that as much as 50 percent of requirements requests go away if they have to fill out a document to request it!
It is best not to put all the requirements into one document. There should be a business requirements document that captures the pure business-level requirements (functional, performance, and maybe some other requirements). This document is best developed as a joint effort between the project manager (or project team members) and Business Analysts. This document is signed by upper management before any architecture or design work is done.
For each requirement, managing it requires the following information be captured and documented:
• Type of requirement—functional, performance, security, and so on
• Design implementations—in hardware, software, processes
• Priority of the requirement—mandatory, highly desirable, or desirable
• Source of the requirement—who gave you the requirement (in case you ever need clarification of it)
• What change requests have been opened against it
• Which test cases test it
• What is the current status—implemented, in process, not started
• Which phase it will be implemented in (for a multiphase implementation)
This can be done very simply in a requirements management tool, a small database, or even in a spreadsheet. Note that documenting and maintaining this will require some administrative resources. This tracking can be done in a Requirements Traceability Matrix that captures not only this information but in which the requirements are numbered in such a way it is easy to identify which requirements have been decomposed from higher-level requirements.
Requirements are critically important, because everything else in the project is based on capturing, managing, and understanding them. We’ll talk more about requirements for our EPM system in the next step.
Step 2.2 Design Considerations
In designing the EPMS, we will take into consideration all work in the organization, not just projects in specific areas such as information technology (IT). Why? Because there is work outside of projects that can significantly impact project success. Blichfeldt et al.5 have shown there is an impact due to projects that are outside the EPMS:
Although companies manage project portfolios concordantly with project portfolio theory, they may experience problems in the form of delayed projects, resource struggles, stress, and a lack of overview. Based on a research project compromised of 128 in-depth interviews in 30 companies, we propose that a key reason why companies do not do well in relation to project portfolio management (PPM) is that PPM often only covers a subset of on-going projects, while projects that are not subject to PPM tie up resources that initially were dedicated to PPM projects. We address and discuss the dilemma of wanting to include all projects in PPM, and aiming at keeping the resource and cognitive burden of doing PPM at a reasonable level.
There are going to be a lot of different considerations that you will take into account as you design the EPMS. One of the major design influences is the type, or types, of project that the new system will be dealing with. Once we understand the types of projects, we can decide on the filtering criteria to filter in all possible project types and the scoring system to select the most beneficial projects within the different types.
Obviously, not all projects are the same or even the same type. This is important because different types of projects will require different justifications and filters that we need to build into our system. In order to obtain the largest number of beneficial projects across multiple parts of the organization, part of what we need to do is to balance out the different asset classes, from short-term IT projects to expensive, strategic capital expenditure (CAPEX) projects.
In Section 2.2, we’re going to cover some of the core topics in the design of the EPMS—how to balance out the different classes, types of projects, criteria for filtering them, and finally, determining how to score them. We will go into the detailed design of the system in Chapter 3.
It is important to ensure that the portfolio is balanced among the different types of projects. According to Kendall and Rollins6,
Every organization has two constraints that limit how many projects can be active at any point in time. One is the amount of money the organization has or is willing to invest in change. The other is the organization’s strategic resources – the one most in demand across many projects or the most heavily loaded resource across most projects. This determines how many projects can be active at any point in time.

Figure 2.2-1 EPMS inputs
Each portfolio, whether at a business unit or at the top-level organization, should be reasonably well balanced to minimize risk. Some parts of the organization, such as the IT department, are going to have lower-level portfolios that are exclusively within one area. The larger organization should provide more overall balance to the portfolio.
By inputting the data required by the EPMS, you are expanding on the business case for each proposed project. One decision that must be made early in the selection effort is to determine whether the effort is worthwhile for every project. While this may sound strange because the whole purpose of the EPMS is to select projects, there may be circumstances where it may not be worthwhile.
If the project is below a certain dollar or effort amount, it may not be worthwhile to filter it through the EPMS. For projects under 100 hours, as an example, the overhead associated with the EPMS may not be worth the effort.
Other projects, such as those mandated by regulatory requirements, are guaranteed to be done regardless of the financial benefits. However, they should still be entered into the portfolio so that their risks and impacts to other projects can be identified.
Some projects are research-oriented projects that may, or may not, produce a marketable-able result. They take time and resources, but it is extremely challenging to schedule them or prioritize them. We will discuss these types of projects in more detail later. These are sometimes called innovation or exploration projects and can produce highly innovative new products. Despite their management challenges, they can be the most critically important for the organization’s future.
The categories of projects must be decided by management in the way that makes most sense for the organization. A software development company will select and prioritize projects that make the most sense from their business perspective. Other organizations will select different categories and priorities. The international mining company Anglo-American has created the following categories for their own projects as shown in the following table.
Table 2.2 Anglo-American project categories
Anglo definition |
Category |
Subcategory |
Description |
Major Project |
Expansion |
|
Material expansions or increase in production capacity |
Replacement |
|
Replacement of existing production capacity |
|
Stay in Business Project |
Replacement (of equipment) |
General replacement— simple |
Replacement of existing commodity equipment— single item as part of planned maintenance |
General replacement— complex |
Replacement of existing equipment/groups of commodity equipment across multiple sites as part of planned maintenance or potential failure |
||
General replacement— systems and plant |
Replacement of existing systems and plant that my involve multiple vendors and/or design and/or construction |
||
|
Safety risk |
Replacement of plant and equipment (including IT systems) that has failed or is proved to be about to fall and/or will materially impact safety |
|
Legal risk |
Replacement of plant and equipment (including IT systems) that is no longer legally complaint |
||
Business risk |
Replacement of plant and equipment (including IT systems) that has failed or is proved to be about to fail and will materially impact operations |
||
Business improvement |
Business improvement— plant and equipment |
New or replacement of plant and equipment with alternatives intended |
|
Business improvement— business processes |
Any nonoperational initiative intended |
||
IT projects |
IT system development |
IT system development |
Any IT initiative intended to improve business efficiency/effectiveness or achieve a strategic priority objective |
In order to minimize the influence of strong stakeholders who are primarily interested in advancing projects that benefit only their part of the organization, a questionnaire should be developed for each asset class that identifies and prioritize those projects that best support the overall organization. An example of such a questionnaire is shown in Appendix 2.2.
In business, assets are everything of value that is owned by an organization. The two major asset classes are tangible assets and intangible assets. Tangible assets are items such as financial assets and fixed assets. Financial assets include accounts receivable, bonds, stocks and cash, and other monetary items; fixed assets include such items as buildings and equipment.
Intangible assets are nonphysical resources and rights that have a value to the firm because they give the firm some kind of advantage in the marketplace. Examples of intangible assets are goodwill, copyrights, trademarks, and patents.
From a portfolio standpoint, we are interested in any project that needs to be funded and completed by the organization. Some of the projects are going to produce tangible assets such as new facilities or a new product for sale. Some of the projects are going to produce intangible assets such as a new IT infrastructure or business process improvements. All of them take time and resources.
Projects, regardless of what type of asset they produce, are part of the portfolio and must go through the project selection process. The only exceptions are mandatory projects that we will discuss later.
We are going to classify the universe of projects into four categories: infrastructure projects, operations-related projects, new product development (NPD) projects, and capital investment projects. There are other approaches to categorizing projects, and not all of these categories may apply to your particular organization. That’s alright. Select the categories that apply to you. Delete the others from the analysis, and add any new ones that are not covered by these. For example, the U.S. National Aeronautics and Space Administration’s (NASA) Jet Propulsion Laboratory (JPL) in California has five criteria for filtering projects7:
1. New capability
2. Maintaining existing capability
3. Innovation projects
4. Visionary projects
5. Compliance projects
The projects are reviewed on an annual basis and adjusted to meet organizational priorities. The distribution of JPL’s effort is shown here:
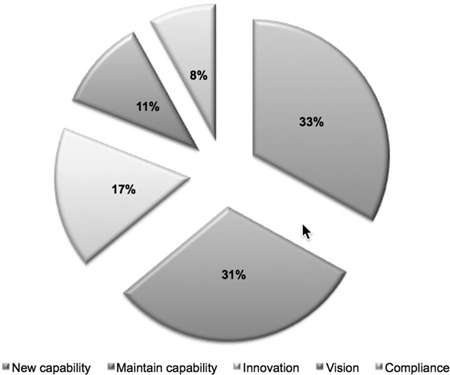
Figure 2.2-2 JPL’s project distribution
JPL is a government organization heavily devoted to research and engineering projects. For categories normal to private industry, let us look at four categories and draw them visually:

Figure 2.2-3 Business project categories
Infrastructure projects are crucial to the efficient running of the organization. This class includes both IT projects and non-IT projects, such as facility maintenance projects or equipment maintenance projects. For many organizations, the majority of infrastructure projects are IT projects. These are also the most likely to be challenged and to suffer scope creep, schedule slippage, and cost over-runs. We’ll talk more about all of these later.
Operational projects are projects for specific operational groups such as marketing, HR, or legal. Marketing projects can improve brand image and corporate visibility and have great potential benefits, but they tend to be high cost projects with “soft” benefits—benefits that are difficult to quantify. Human resource (HR) projects are lower cost and low risk, but may be mandated by regulation and will fall into the type of project we will later call “mandatory.”
Other classes of operational projects include business process improvement projects. These can be highly beneficial, but are also very risky due to impacts on how people work.
New product development (NPD) projects are those that produce a new product that the company can market. These are highly risky, with up to 90 percent of new products failing in the marketplace. But, they can also be highly rewarding, with the 10 percent of products that are commercially successful compensating for those that fail. This is an especially critical area for new technology-based firms (NTBFs)8, which tend to be entrepreneurial, do not have a long history of operational development, and tend to use project management techniques far more readily than old established organizations.
Projects for NPD follow the company’s NPD philosophy: first to market, fast follower, or low-cost leader. Companies that produce a brand-new product can obtain very high profits from it, but also face high development costs for a product that may not be successful. Companies that use a fast follower approach wait until a competitor comes out with a new product and waits to see if it is commercially successful, then comes out with a competitive product. Think of Apple’s iPod followed by Microsoft’s Zune.
Companies that utilize a low-cost leader approach wait until a product’s market matures, and then undercut everyone on price. This is low risk, but also highly competitive because many other companies will be doing the same thing. Companies that use this approach rarely add any new features, but are highly skilled at cost-cutting the manufacturing of products.
Capital investment (CAPEX) projects that those that cost a lot of money with no short-term payback. These are the projects that produce new manufacturing factories, new aluminum plants, or new oil refineries. They cannot be justified in the same way that an IT upgrade is justified. We’ll talk more about these later in this chapter.
2.2.2 Balancing Asset Classes and Capital Rationing
If every asset were equally important to the organization, the portfolio may be represented as shown in this figure:

Figure 2.2-4 Balanced portfolio
However, we know that no organization will ever have a completely balanced portfolio, except temporarily by accident. Upper management, when they are laying out the annual budgets, will emphasize those areas that support the organization’s strategic goals.
Removed from the following calculations are the money allocated for daily operations. In most organizations, the operations money will require the majority of the funds. These are funds that must be expended just to keep the organization going and are not available for projects. We’re going to take operational budgets out of any consideration and only concentrate on budgets allocated for project work.
All projects cost money and people, and there is a limited supply of both. Investments in projects are balanced out with investments in less risky financial instruments such as investing in certificates of deposit (CDs) or bonds. How the organization rations its capital is an activity that takes a lot of time and effort by the executives to ensure that the risks inherent in projects is balanced out by the more assured returns of safe investments. Part of capital rationing is also involved with just what types of projects the money should be spent on, the topic of much of this chapter.
The executives in the finance department are charged with spending the organization’s money in a way that provides the greatest benefit while balancing risk. If all financial decisions were left to the accountants, the money would be invested in savings accounts, Certificates of Deposit (CDs), and in safe financial investments. Rarely are these people comfortable in investing in projects whose outcome is uncertain and which have higher risks. Fortunately, the financial department is only one voice in how the organization allocates its financial resources. If it were left to the finance department, the organization would never create new products because there are safer places to put the money. Organizations that put too much of their money into “safe” investments eventually lose out to more innovative competitors.
The money needed for operations is highly dependent on the outside business environment and is, therefore, reactive to changes in that environment. In a growing economy, organizations put more money into growth and select more projects. In a downsizing economy, organizations pull money away from growth-related projects and use the money to improve internal efficiencies, to simply survive, or not spend money on projects at all. The COVID-19 crisis caused most organizations to stop spending money on anything except survival.
Graphic representations of the portfolio are more informative to management than simply stating “We’re putting 30 percent of our money into infrastructure projects.” They show quickly when the portfolio is not balanced in the way management thought.
2.2.2.1 Growth-Oriented Portfolio—Version A
An organization that is interested in future growth might take more of the project funds away from operational areas and safe investments and use the money to fund NPD or for increased capital expenditures. The pie chart looks like:

Figure 2.2-5 Growth-oriented portfolio Option A
In this allocation, money has been moved to new product development by reducing the funding for operational projects. Infrastructure and capital investment projects have been left at existing levels. Unfortunately, many organizations tend to be short-sighted when it comes to decreasing expenses and tend to reduce departments such as HR or corporate training. Good in the short term, not so good in the long term. Blindly removing money from operations to put it somewhere else just increases inefficiencies in those parts of the organization that have been cut back. If money is to be taken from operations, it should be done by increasing operational efficiencies and using the savings to fund other works.
2.2.2.2 Growth-Oriented Portfolio—Version B
A company that is growing rapidly because of high sales volumes on its existing product line just needs to expand its facilities. These are capital investment projects and are expensive. They can be high risk or low risk depending on whether the economy is moving up or down.
The allocations might look like this:
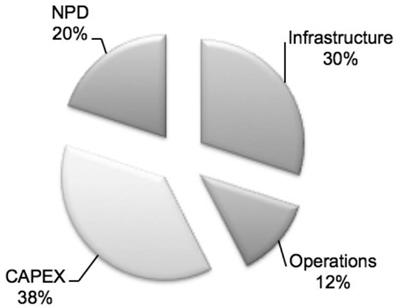
Figure 2.2-6 Growth-oriented portfolio Option B
2.2.2.3 Growth-Oriented Portfolio—Version C
In the allocation shown here, both operational projects and infrastructure projects have been reduced, with more emphasis being placed on NPD and capital investments.
This is a typical arrangement in a rapidly growing economy, where companies are going to heavily fund NPD and as well as new facilities.

Figure 2.2-7 Growth-oriented portfolio Option C
2.2.2.4 Cost-Savings-Oriented Portfolio
When the economic conditions are on a downward slope, organizations have shown a strong tendency to reduce funding for NPD and for new facilities and either cut out all projects totally or put money into projects that increase internal efficiencies and produce cost savings. Or, as mentioned before, simply cut all project work no matter how beneficial. While the short-term financial benefits of cutting all costs are easily quantifiable, the long-term damage to the organization is less quantifiable but no less real. Multiple studies have shown that organizations that emphasize cost-cutting during economic downturns do significantly worse than their competitors once the economy starts picking, up as it always does.
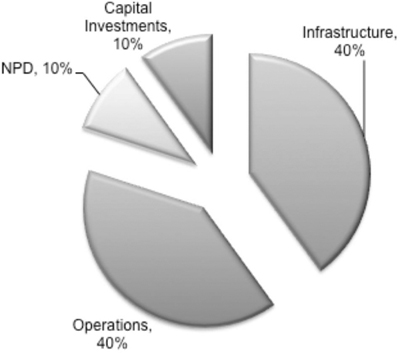
Figure 2.2-8 Cost-savings portfolio
Portfolio Alignments
The aforementioned allocations are generic and could be considered starting points for discussions with the decision makers. The exact allocations will be determined by the executive committee and will be dependent on both strategic goals and current economic conditions. As either one of these changes, the portfolio will be adjusted as needed.
2.2.3 Three Project Priorities
While there are a large number of projects that an organization can do within each asset class, we can divide them into just three basic types:
1. Regulatory-driven (“killer” projects)
2. Maintenance projects
3. Discretionary projects
Each asset category mentioned earlier can contain any one of these types of projects.
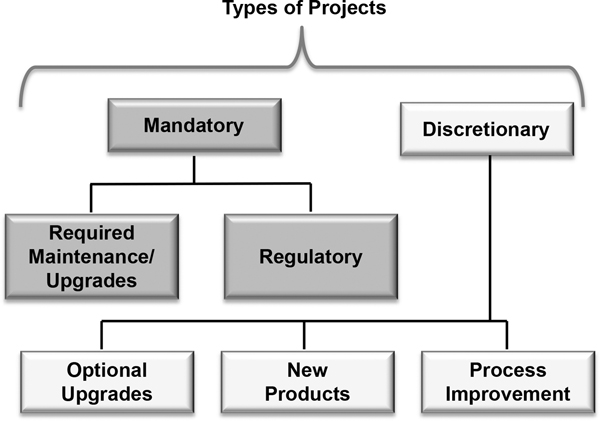
Figure 2.2-9 Project types
2.2.3.1 Regulatory-Driven Projects
Mandatory projects are “must-do” projects. We have no choice. They disrupt our carefully planned existing work. Regulatory-driven projects are driven by changes in laws and regulations and are mandatory if they apply to you. Consider the HIPAA (Health Insurance Portability and Accountability Act) legislation that was passed by the U.S. Congress in 1996. Part II of HIPAA required that a patient’s privacy be protected in several ways, one of which was their medical data. This mandated that all companies providing medical-related services, including insurance companies, had adequate security and privacy processes in their IT system to protect patient medical data. Implementing this new requirement disrupted the existing planned project work. With the passage of the Affordable Care Act (Obamacare), the industry faced many more mandatory projects as the full effects of the law are understood. Worse, as the act was being debated in the courts and with a proposed repeal by the subsequent administration, there is a great deal of uncertainty about whether companies should comply or not. The massive failure of the Enron company in 2001 led to mandatory changes in forcing executives to approve all of the financial statements, leading to significant process and IT changes in publicly owned organizations.
Regulatory changes can have unexpected consequences, so be prepared to make changes to the prioritized list of projects when those unexpected consequences are discovered. Because HIPAA made your medical data private, what is the impact of new technologies, such as wearable wristwatches, that monitor blood pressure, heartbeat, and other personal medical data and upload it to a cloud-based storage service? Does the storage service have to meet HIPAA requirements? Changes to long-term priorities can happen in cases like this, and those changes can be disruptive to our careful plans.
U.S. credit reporting companies such as Experian, Trans Union, and Equifax are subject to national-level legislation through federal legislation as well as dealing with separate legislation from each of the 50 states. Because these rules are coded into the software (leading to hundreds of business rules that must be checked for every credit report request), any change to any of the regulations leads to a considerable amount of work to find out where that existing rule is coded in the software and determine if the new change impacts any of the other hundreds of rules.
Companies that are subject to any regulatory-related controls must be aware of the possibilities of such interruptions and prepare accordingly. Regulatory-drive projects are sometimes referred to as killer projects because they basically kill any projects you already have in work or as “Orange Jumpsuit” projects because orange is the color of many jail uniforms—you don’t do the project, you go to jail, or at the least, pay heavy fines.
The right solution to the problem of disruption is for organizations that are subject to frequent changes in laws and regulations to compensate by not selecting so many projects that their personnel are allocated 100 percent of the time. They should leave some schedule room so that when a regulatory project comes in, they can start on it with minimal disruption to existing work. However, politically, this is often not palatable to upper management. They feel that people should be working on as many projects as possible and just deal with the schedule disruptions created by regulatory changes and the loss of morale caused by canceling a lot of projects when the regulations change.
2.2.3.2 Maintenance Projects
Maintenance projects fall between regulatory-driven projects and those that are completely discretionary. Some maintenance projects are mandatory. These include work such as commercial aircraft maintenance and refurbishments of processing lines in chemical plants. Both of these types of projects are required to ensure that the equipment remains safely operational for long periods of time. These types of projects are predictable and preplanned and therefore not disruptive to planned work.
Other maintenance projects fall into the category of discretionary. An IT department that plans on upgrading Windows or implementing the latest Oracle updates has a choice as to whether it does so and, if it chooses to upgrade, when the most appropriate time is. These types of maintenance projects can be preplanned and again are not disruptive to planned work. They should be included in the selection, prioritization, and planning processes that we will discuss next for discretionary projects. The cost justification for these projects must be done carefully so that only really needed projects get approved. Because these types of projects are not strictly mandatory, they are simply cost sinks and do not generate any new revenue. The best that can be said about them is that they may improve productivity, a thing that can be very hard to quantify. The maintenance projects that are discretionary should be treated as all other discretionary projects are and justified as to their benefits.
Emergency maintenance projects, such as equipment breakdowns, are those that are required to be done immediately to fix a problem. They are often highly disruptive to planned work but are unpredictable and so do not figure into our discussions here. However, in an environment where such breakdowns happen, such as a steel mill, a complex chemical processing plant, or even a complex IT network, the best approach again is not to overload people with planned work, so there is some overhead in the schedule to accommodate outages.
Story
The author spent some time helping develop project management processes at the Qatar Ammonia and Fertilizer Company (QAFCO) in Messaieed, Qatar. QAFCO is one of the world’s largest producers of urea and ammonia, both used in fertilizers. There were three major sets of processing lines, called trains, that took the locally abundant natural gas and processed it into the final products.
The processing required high temperatures and pressures of corrosive gases and liquids to produce the urea and ammonia. The job of the Systems Engineering department was to plan regular outages to replace major pieces of processing equipment before they wore out or broke to keep the trains processing as efficiently and as safely as possible. However, each train had a senior manager in charge who was bonused based on the train’s output. Their goal was to keep the trains running as hard and as long as possible. As you would expect, there were a significant number of arguments about when maintenance should be scheduled.
2.2.3.3 Discretionary Projects
Discretionary projects are mostly what this book is about. These are the projects that an organization has full choice as to whether it does them or not. Categories of discretionary projects include:
• Capital investment projects
• NPD projects
• Infrastructure projects
• Operational projects
• Discretionary maintenance projects
• Dedicated marketing, HR, and other department-specific projects
Capital investment projects include items like new facilities, property purchases, or major machinery and equipment purchases. These are high-cost purchases and are usually done during good economic times to increase capacity. New facility projects are also long-term investments that will tie up funds for several years. The cost of these is generally large enough that only top-level management can make these commitments. These tend to be low-risk projects that will provide substantial returns as long as economic conditions stay stable during a period long enough to justify their expenditures. If economic conditions change rapidly, these projects can lead to equally substantial losses.
Capital investment projects are sometimes referred to as CAPEX projects because of their high dollar value (hundreds of millions or billions of dollars) and long return on investment (often years). These projects are better managed using program management techniques rather than pure project management techniques. Industry terminology is confusing by often referring to these efforts as projects rather than their true descriptions as programs. Despite the confusion, we will follow industry practices and refer to them as projects. You should be able to tell from the context whether it is a simple project or a true program.
These kinds of projects consume large amounts of money and a lot of organizational resources. They are typically approved only at the very top levels of management, and the filtering criteria need to be design to approve them in stages. The first approval should be for the project overall as a strategic goal, and later approvals should be for each individual stage gate to decide whether or not the financial numbers look good enough to proceed compared to the risks.
This size/complexity of project is susceptible to being killed any time the numbers don’t look promising. In Fall 2013, Anglo-American Mining backed out of a joint venture to develop a gold/copper mine in Alaska at the end of Phase 3 because the risks of doing the project and the long timeframes for revenue did not look promising. They backed out of the project after spending $500 million in the early stages. That takes more courage than most executives have.
NPD, including research and development (R&D) projects and other exploratory projects, are highly risky and initial revenue from such projects may not happen for years if ever. History shows that the majority of new products do not become financially profitable. However, the small percentage that do can provide enough profit to more than make up for the losing projects. Some companies, such as Minnesota Mining and Manufacturing Company (3M), devote a large proportion of their financial assets to supporting NPD projects. Only a small percentage of them become profitable, but many of those become highly profitable (think of Sticky Notes). 3M typically spends about 5.5 percent of its operating expenses in R&D projects, but that is 5.5 percent of U.S. $3 billion in income from operations, a significant amount of money†. Google is another organization that allows people to work on their own pet projects, leading to many of the newer products that Google has released.
Of course, it’s not just how much money you spend, it’s how you spend it. Between 2004 and 2009, Apple Computer obtained a 72 percent growth in revenues from their $4.6 billion R&D investment‡. By comparison, Microsoft Corporation spent $31 billion during the same period and obtained only a 32 percent growth from R&D, Cisco spent $19 billion and got a 25 percent growth, while Intel Corporation spent $23 billion but received no revenue growth from their R&D investment.
How did Apple do so much better than these other companies? A strong NPD culture and processes allow them to filter among many possible projects to select the best ones. Google also has such a innovation-oriented culture. Most of its new product have come from individual research by employees who came up with an idea and were given the freedom to work on it. In 2019, their R&D spending had grown to $16.217 billion.
Best practice in the NPD arena is to use a stage-gate process. On a regular basis, during the early phases (called stages) of the project, a review is held to assess whether the project will satisfy strict profitability criteria. If not, the project is killed and the resources allocated to more promising projects. Each project must go through several of these gates in order to continue. It is not unusual for a company to kill 50 percent of their projects at the early gates. This winnows down the large number of projects to those that are most likely to be winners in the consumer market.
As Maniak3 points out, there are actually two benefits to these risky exploration projects. The first benefit, and the most obvious one, is that the final product that comes out of such a project is often highly innovative and can produce significant market advantage to the company. At least for a while, it is the only company producing such a product, and anyone who wants the product must buy it from them and only them. Examples include personal electronic devices such as the Sony Walkman or the much more recent Apple iPod.
Infrastructure projects can be reasonably divided into IT projects and non-IT projects. There has been a strong interest shown in portfolio management by many IT departments in the past few years because of the increasing amount of IT work being done as projects. According to research9 performed by PriceWaterhouseCoopers, IT-related productivity has been declining since the early 2000s even while the costs of IT have been increasing. More and more IT spending is going to maintain existing systems rather than benefiting the organization. This makes justifying IT projects much more difficult.
A strong emphasis on reducing costs has led to more projects to improve IT effectiveness but with no increase in the personnel to do the projects. More people are multitasking with concomitant reductions in productivity and an increase in the percentage of IT projects that are late and over budget. Portfolio management is a perfect solution to this type of an environment. Fewer, but more critical projects will be selected, waste and duplication will be reduced, costs will be reduced. Fewer mistakes will be made, quality will improve as will schedules and costs, and a higher percentage of projects will be completed successfully. No wonder, IT departments have been looking so strongly at EPM systems.
Non-IT infrastructure projects include anything required to keep the organizations facilities and equipment operating and usable. This category will include facilities upgrades and equipment repair/maintenance/ upgrade projects. It may also include equipment purchase and installation projects that are not sufficiently large to be considered a major capital expense.
Operational improvements form another category of discretionary projects. These are done to improve operations by increasing efficiencies or to support one particular department. The marketing department, for example, runs marketing and sales campaigns as a project—identifying the goals, planning out the work and the budget, assigning resources, and monitoring how successful the effort is.
Included in operational improvements are Business Process Improvement (BPI) projects. In the past 25+ years (since the reengineering trend in the early/mid-1990s), these have become increasingly important to companies. These are efforts to improve internal efficiencies in how we operate, especially since the economic downturn that began in 2008.
These are a peculiar type of project compared to more “normal” projects such as IT projects or NPD projects. These can be very complex, long-lasting projects and can be fraught with dangers. There are two reasons BPI projects have problems: the first is that business processes affect how people work, and any time you change people’s work, you will face resistance as we talked about earlier (remember the story about the utility in the last section?). The second is that all business processes link to other business processes. There is no such thing as an isolated business process. If you change one, you have to change the other processes that interact with it, and your project will very quickly grow out of control unless you put strict boundaries around which processes you are changing and which ones you are not. This is needed so that people will not assume you are changing processes that you are not. In the project charter, you should have a section on project exclusions specifically stating what process you are changing and whether or not you are changing the interfaces to other processes.
We see that there is a large variety of projects an organization can undertake, but they fall within just a few broad types. The type of project that lends itself best to being managed through portfolio management techniques is the discretionary project. The organization has a full choice whether to do this project or put its money somewhere else.
The following insert is about a fictional company, MegaNews International, whose motto is “We don’t just report the news, we create the news!” The Corporate chief information officer (CIO) has just returned from the annual strategic planning session held at corporate HQ in Australia and finds a list of projects on his desk. How does he select the “right” projects?
Table 2.3 MegaNews project options
MegaNews International |
As stated at the end of Step 1, the CIO of MegaNews has been given a list of proposed projects for her IT department to complete. She has called her senior staff together and lays out the following projects: |
A. New privacy laws that will take effect in 12 months in Europe require us to strengthen our website registration database. B. A new law in California requires us to change our website so that viewers must “opt-in” to receive our e-mail newsletters rather than “opt-out” from receiving it. This must be completed within three months. C. Corporate finance wants to install a data warehouse to manage all of the financial information. No given timeframe. D. We want to have a new website to compile news from other sources and allow viewers to buy it from us. E. We are opening new U.S. headquarters in Los Angeles and need to tie their LAN into the corporate network. The construction schedule says it will be ready for IT within four months. F. United Press International, a major news feed for us, is upgrading their news distribution network within the next six months, and we need to modify our IT infrastructure to tie into it. G. We need a new service to allow us to deliver user-customized financial news via iPhones, iPads, and PDAs with wireless connections. H. We are going to put news screens into each Starbucks Coffee Shop in the United States showing news headlines from around the world. This will be done over the next three years. I. Our website is currently written in English, we intend to internationalize it by creating versions in multiple languages. J. Half of our employees are using Macintosh computers, the rest are using Windows 8. The Windows component needs to be upgraded to Windows 10 once it has been tested for compatibility, a 12-month effort. This will improve productivity of the Windows side by 2 percent after the initial loss of productivity that follows any major upgrade. |
Using MegaNews as an example, let’s discuss what criteria should be used to select projects.
Now that we have a picture of the types of projects we might be dealing with, how do we score and prioritize them so that they most strongly align with organizational strategy? Everyone in management has their own interpretation of what the priorities are, a situation that usually leads to conflicting priorities, confusion, subversive stakeholders, and sometimes outright conflict. “Decibel decision making” may have worked in the past, but it always suboptimizes the organization’s effectiveness as well as reducing morale.
Simple or complex criteria?
How should we select and score the projects? It depends on what is important to our organization. There are several approaches that can be taken.
The United Kingdom’s Cabinet Office’s Office of Government Contracting has developed a Portfolio Management Guide. In it, they propose some very simple filtering criteria (Figures 6.3 and 6.4 from the Final Public Consultation Draft, 2009).
The proposed projects are then compared against each other after going through the filtering process. These are very simple criteria and apparently adequate for the process they were designed for.
For a more complex, and therefore more thorough, set of filters, we also have a number of choices. Cooper10 has proposed the following scorecard for NPD:
Factor 1: Strategic fit and importance
• Alignment of project with our business strategy
• Importance of project to the strategy
• Impact on the business
Factor 2: Product and competitive advantage
• Product delivers unique customer or user benefits
• Product offers customer/user excellent value for money (compelling value proposition)
• Differentiated product in eyes of customer/user
• Positive customer/user feedback on product concept (concept test results)
Contribution |
|||||||
|
Weight |
None |
Some |
High |
Score |
Total |
|
|
Prioritizing change criteria |
|
|
|
|
|
|
1 |
Supports at least one strategic objective |
20% |
0 |
5 |
10 |
10 |
2 |
2 |
Realizes significant benefits in a short time with low risk |
20% |
0 |
5 |
10 |
5 |
1 |
3 |
Contributes to external targets |
10% |
0 |
5 |
10 |
0 |
0 |
4 |
Complies with a legislative requirement |
25% |
0 |
5 |
10 |
10 |
2.5 |
5 |
Addresses an area of under-performance |
5% |
0 |
5 |
10 |
5 |
0.25 |
6 |
Improves efficiency |
5% |
0 |
5 |
10 |
5 |
0.25 |
7 |
Mitigates against corporate risk |
10% |
0 |
5 |
10 |
10 |
1 |
8 |
Honors an existing contractual obligation |
5% |
0 |
5 |
10 |
10 |
0.5 |
Change priority score |
7.5 |
||||||
Factor 3: Market attractiveness
• Market size
• Market growth and future potential
• Margins earned by players in this market
• Competitiveness—how tough and intense competition is (negative)
Factor 4: Core competencies leverage
• Project leverages our core competencies and strengths in:
• Technology
• Marketing
• Distribution/sales force
Factor 5: Technical feasibility
• Size of technology gap (straightforward to do)
• Technical complexity (few barriers, solution envisioned)
• Familiarity of technology to our business
• Technical track record on these types of projects
• Technical results to date (proof of concept)
Factor 6: Financial reward versus risk
• Size of financial opportunity
• Financial return (NPV, ECV, IRR)
• Productivity index (PI)
• Certainty of financial estimates
• Level of risk and ability to address risks
Part of your job in designing the EPMS is to identify which of these factors, or others, are most important to your upper management. They cannot all be equally important, they have to be prioritized (we will talk about how to do that later).
Not everything that is important can be measure financially. Our goal here is to create a set of objective filters that focuses on the organizational strategic goals while still giving some flexibility to management. That flexibility is important to allow growth in an area where we might not have a strong product presence, but rounds out our product line.
The majority of our filters will be oriented toward the project’s financial benefits and the project risk. However, nonfinancial benefits should also be taken into account when appropriate.
As shown in the scorecard just listed, many of these factors are not financially measurable. For example, the IT department of the Project Management Institute uses “benefit to members” as a major criterion for selecting projects. How can this be done if we’re not calculating the financial benefits? For projects where nonfinancial criteria are important, the steering or governance committee should pick the perceived benefits from a range of 1 to 5 (or 1 to 10 if that is more customary in your organization), where 5 is highly beneficial, 4 is mostly beneficial, 3 is neutral, 2 is somewhat detrimental to the organization, and 1 indicates the project may harm the organization if performed. All projects in this category go through the same ranking process.
So, other types of benefits are possible, but for most projects, the filtering criteria will be financial ones. Projects are paid for by money, and it is the responsibility of the executives to spend the organization’s money as wisely as possible. In the next chapter, we will discuss the details of various financial filters, such as ROI (ROI—an annualized rate of return expressed as a percentage), internal rate of return (IRR), payback period, and others. However, the purely financial approach has limitations, and some very worthwhile projects, such as R&D projects, will never pass a purely financial filter. This is one of the biggest limitations of most EPMS implementations and a major reason why the approach often fails after being tried.
Research done in the field of NPD3 shows that financial filters are only one of a series of criteria used, and are not the most important. As shown in the next figure from that article, strategic fit outweighs financial benefits:
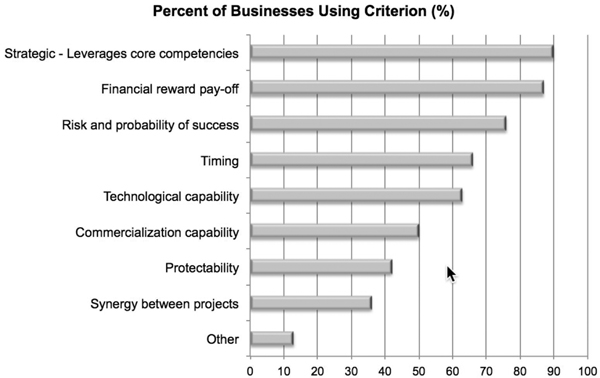
Figure 2.2-10 NPD filter criteria
For example, the major manufacturers of small digital cameras try to have a variety of products at different price points so they can compete directly with each other. They might approve a project to develop a new camera that fits a price point they do not already cover, knowing that they will never be the market leader at that price point.
According to the following figure from the same research, over 24 percent of companies engaged in NPD do not use financial methods at all. So, other, nonfinancial criteria need to be developed for them.

Figure 2.2-11 Financial metrics versus hurdle
2.2.5 Detailed Scoring
Now that we have a reasonable list of questions that will allow us to filter and score the proposed projects, just how do we score them?
If you are developing the software internally instead of purchasing commercial software, create a database for each of the questions. As each question is answered by clicking on the appropriate box, it is automatically scored.
Here we have designed-in the possibility that sections may have different weights. If annual revenues are much more important than the initial investment, you would put in an appropriate weighting factor. These weighting factors can be changed easily in response to the feedback obtained during the initial pilot project. If the list of projects presented to the steering committee for feedback doesn’t reflect how they would make decisions, this is the place to adjust the scores to more accurately reflect how decisions should be made.
The total scores are then presented, along with the project risk assessment, as a rank-ordered list to the steering committee. Because the numbers we present them are rough numbers, they should be allowed some flexibility in selecting projects that are close to one another. For instance, if two projects are within 50 points of each other and have similar risk profiles, they should be considered equivalent investments.
2.2.6 Weighting Criteria
Many authors such as Wood11 suggest weighting the criteria to avoid the limitations inherent in a purely financial approach. We might first identify the criteria themselves as follows:
• ROI
• Risk
• Confidence level of benefit delivery
• Impact to other projects
These do not have to be the same for every category of project, and in fact, should be different for every type of project. For capital expenditures on a new manufacturing facility, ROI would be a reasonable filter. For new product development, one filtering factor may be whether the new product differentiates us in the marketplace and gives us a sustainable advantage.
The next step is to weight each filter. For example, we might give the following weights to the criteria we listed above.
• ROI = 50 percent
• Risk = 20 percent
• Confidence level = 20 percent
• Impact to other projects = 10 percent
These are examples of types of criteria, there are others that might be used depending on what is important to the organization. For example, a professional organization might give a high weight to “benefits to members.” Or, a filter that might be used in new product development might be “increase in market share.”
Now we can go a step further and, for each project, give them a score between 1 and 10. A score of 10 shows the project will provide a lot of that criteria such as a strong ROI, and a score of 1 indicates it will not.
Except for risk and impact. These are negatives. Because the risk score identifies how risky the project is, the risk score should be done from 10 to 1, just the opposite of how the others are scored. A low risk project would get a score of 8, 9, or 10. A high-risk project would get a score of 1, 2, 3, or 4, and a medium risk project would get scores of 5, 6, or 7.
Similarly, a project that has a high impact to other projects in work would be scored in the range of 1 to 4, medium impact 4 to 7, and low impact 8 to 10. We multiply these scores by the weights, add them up, and this gives us an overall score for the project.
Table 2.5 Project weighting example
Project 1 |
Project 2 |
Project 3 |
Project 4 |
||||||
|
Weight |
Score |
Adj. Score |
Score |
Adj. Score |
Score |
Adj. Score |
Score |
Adj. Score |
ROI |
0.50 |
5 |
20.50 |
4 |
20.00 |
2 |
10.00 |
7 |
30.50 |
Risk |
0.20 |
3 |
00.60 |
5 |
10.00 |
9 |
10.80 |
4 |
00.80 |
Confidence level |
0.20 |
5 |
10.00 |
8 |
10.60 |
8 |
10.60 |
3 |
00.60 |
Impact |
0.10 |
9 |
00.90 |
8 |
00.80 |
4 |
00.40 |
4 |
00.40 |
Total |
10.00 |
|
50.00 |
|
50.40 |
|
40.80 |
|
50.30 |
Based on this approach, Project 2 would score the highest and has the best chance for approval. Its ROI score is only moderate, but we have a high degree of confidence we can do it. By comparison, Project 4 has a very good ROI score, but it is moderately risky, and we are not sure we can successfully accomplish it.
It is important to have consistency in decision making. Everyone who looks at a project should score it reasonably the same. Otherwise, one member of the steering committee might say the project has a very high risk, while another member says the same project has a very low risk. During the design period of the EPMS project, some definition of what the criteria are should be established and agreed-upon by the executives. For example:
Table 2.6 Sample weights
ROI Range |
0-5% |
5–10% |
10–20% |
20–25% |
25–30% |
30–40% |
40–50% |
50–100% |
100–150% |
>150% |
Score |
1 |
2 |
3 |
4 |
5 |
6 |
7 |
8 |
9 |
10 |
An ROI range above 50 percent may seem high to a financial person, but venture capitalists often demand ROIs above 100 percent to compensate for the high risk of their investments. Your own breakdown will be determined by what is normal for your company. These numbers should be adjusted to the different types of projects being considered. In the next chapter, we will talk more about ROI and about the hurdle rate.
Because no scoring system is perfect, the executives should be given the latitude to select two projects that have scores relatively close together. Projects 2 and 4 in our example score close to one another and either one could be selected.
2.2.7 Determining the Scores
So, how do we determine what those scores should be? The best way is to derive those scores from a series of questions that each proposed project must answer. These questions are then given a score based on the answers to the questions.
Many of these answers are a best guess right now. You haven’t done the newly proposed project, so we don’t have real numbers to analyze. In order to minimize the possibility of wildly inaccurate guesses, make the questions and possible answers as detailed as possible so that the person answering it has to think about it.
For example, instead of asking if the project will increase customer retention, phrase it as follows:
Does or will the project increase customer retention?
2. By 0–5 percent?
3. By 6–15 percent?
4. By 15–20 percent?
5. By more than 20 percent?
And, then weight the answers. Answer #5 would have a higher weight than Answer #1 because increasing customer retention is very important.
MegaNews International Projects
Now let’s return to MegaNews International. We left the corporate CIO facing a series of proposed projects, wondering which ones to approve. The first thing he noticed was that two of the projects were mandatory because they were in support of regulatory changes. These projects were:
New privacy laws that will take effect in 12 months in Europe require us to strengthen our website registration database (Project A).
A new law in California requires us to change our website so that viewers must “opt-in” to receive our e-mail newsletters rather than “opt-out” from receiving it. This must be completed within three months (Project B).
So, these two were moved immediately to the approved list. Project A is estimated to cost $1 million and requires 10 people for six months. Project B is estimated to cost $500,000 and requires 2 people for two months. The executives will approve these projects because they must be done. But, the CIO is worried about how many resources these projects will tie up that will not be available for other work.
Let us now look at Project F: United Press International, a major news feed for us, is upgrading their news distribution network within the next six months, and we need to modify our IT system to tie into it. While this is not a regulatory project, if MegaNews International wants to stay connected to a major source of news in the future, it must upgrade its own IT infrastructure, so this really falls into the category of a “must do” project. It is estimated to cost $3.5 million and requires three people for four months.
To make intelligent decisions on the remaining projects, the CIO will need more information. After sending e-mails to the people who proposed the projects and getting more details, the CIO now had the following information:
C. Corporate finance wants to install a data warehouse to manage all of the financial information. No given timeframe.
• Estimated cost: $2.5 million
• Estimated benefit: $50,000 per year in improved productivity by corporate finance
• Resources required: 10 people for six months.
D. We want to have a new website to compile news from other sources and allow viewers to buy it from us.
• Estimated cost: $4 million
• Estimated benefit: $1.5 million/year
• Resources required: 10 people for six months.
E. We are opening new U.S. headquarters in Los Angeles and need to tie their LAN into the corporate network. The construction schedule says it will be ready for IT within four months.
• Estimated cost: $0.5 million
• Estimated benefit: $100,000 per year
• Resources required: five people for three months.
G. We need a new service to allow us to deliver user-customized financial news via iPhones, iPads, and PDAs with wireless connections.
• Estimated cost: $5 million
• Estimated benefit: $2 million/year from advertising
• Resources required: 25 people for six months
H. We are going to put news screens into each Starbucks Coffee Shop in the United States showing news headlines from around the world. This will be done over the next three years.
• Estimated benefit: $10 million/year from advertising
• Resources required: six people for 36 months
I. Our website is currently written in English, we intend to internationalize it by creating versions in multiple languages.
• Estimated cost: $6 million
• Estimated benefit: $2 million/year from advertising
• Resources required: 25 people for six months
A. Half of our employees are using Macintosh computers, the rest are using Windows 8. The Windows component needs to be upgraded once it has been tested for compatibility, a 12-month effort. This will improve productivity of the Windows users by 5 percent.
• Estimated cost: $5 million
• Estimated benefit: unknown
• Resources required: 10 people for 12 months
The calculations for this last project, the Windows upgrade, has a lot of assumptions and soft numbers that are needed. How can you judge how much productivity will increase because of an operating system upgrade? How can you even judge whether it will increase or decrease? For the purposes of performing the calculations, let’s make the assumption that productivity will decrease by 10 percent for the first six months until people are familiar with the new software, then it will increase by 2 percent. After one year, we can reduce the Help Desk and IT headcount by 25 people.
2.2.8 Stakeholder Involvement
The scoring questions should cover enough areas to determine the development costs of the project, the future benefits from it, impacts to other projects, and its risks.
But, there is no one group in the typical company that can answer all of these different questions. So, how do we get them answered?
The answer is that we have to involve other parts of the organization. Each section of our questionnaire is answered by someone in the group that has the best information.
Once the EPMS accepts a request for a new project, there is a specific sequence of steps to process that request. We’ll look at it in more detail in the next chapter. At a high level, this can be shown in the following flowchart:

Figure 2.2-12 Organization components involved
The initial request comes from anyone in the company. The computerized form is filled out and routed to the EPMS.
The EPMS then routes the different parts of the form to different departments to fill out their portions of it depending on the specific project: finance, IT, engineering, facilities, procurement, marketing, a business analyst, and so on. Each person fills out the portion of the form that they can best estimate the data for. For example, a request for a new software product may route to the following groups:
Each has their own area to complete on the form.
• Finance: rough estimate of the overall cost of the project
• IT: the level of IT effort to develop the product
• Procurement: the costs of any purchases for the project
• Marketing: potential future financial benefits of the product
• Business analyst: impacts to the business
If the project will require resources that are currently scheduled on other projects, the form should be routed to the PMO for assessment of the impacts to the other projects if this project is approved.
Since most projects are approved or rejected based on financial data, the most important areas in the form are related to the costs of the project and to the possible future financial benefits.
Cost Data
If part of the project involves the mechanical engineering department, the head of mechanical engineering should appoint one of the engineers there to be the point of contact for determining project costs. Similarly electrical engineering, software engineering, IT, and any other groups involved in the project should include their own costs for the project. The financial department and procurement department may have to be involved in this part of it, as well as HR providing the salary bands for the expected staffing levels.
Benefits Data
The engineers are really good at identifying a range of costs for the project. Not so good at identifying the future revenues. For this information, we have to turn to another group, usually marketing. They are often involved in calculating the possible range of future revenues from new products.
If the future benefits of the project are primarily cost savings, as they would be in business process improvement projects, then some estimates of the reduced headcount or increased productivity need to be made to allow calculations of future cost savings.
Benefits are more difficult to quantify than costs are. There are a lot of assumptions and guessing in deciding how much revenue a new product will give us in two, five, seven years. Each assumption is uncertain and may or may not prove to be true depending on what the future really holds. If there is enough time, these calculations should be performed under different assumptions about the future.
Other departments may involve manufacturing, the PMO, IT, procurement, and any other department or division that may be affected by the new project.
Once the data are filled out, the results are summarized, a risk analysis is done on the proposed project, and the final score is sent to the steering committee for review and either approval or rejection of the project.
2.2.9 Designing the Human Interface
One crucial aspect of defining the requirements is to understand how people want to interact with it. It is very difficult to design a software interface that is both highly functional and flexible and yet is intuitive and easy to use. Those are two extremes of the design effort. High functionality and flexibility are the antithesis of an intuitive interface. Not many software programs achieve both, and the developers will be forced to make tradeoffs based on the requirements you capture.
This part of the requirements and design effort cannot be emphasized highly enough. The ease of use of the EPMS will make people either want to use it or turn people aware from it, rendering your entire effort useless. People who use software do not care what happens beyond the screen and the keyboard, but how they interact with the software is core to their acceptance of it.
The historical approach to developing software was borrowed from other more advanced project management fields such as construction and aerospace. You gather all of your requirements before you design and then build the project plan around satisfying those requirements. This doesn’t work in software, and it hasn’t worked since the 1960s when software development on mainframe systems began to accelerate.
Software users rarely know how to describe “how” they want to interact with the system in such detail that the developers can produce exactly the right interface. It’s not the fault of the developers, it’s because users can only think in terms of what they already know how to do.
This is why, a much better approach to developing software products has been accelerating since the early 2000s. A variety of “agile” approaches has been developed in which the developers work closely with the users, showing them what the interface looks like and making rapid changes based on the users’ feedback. This allows the users to effectively design the interfaces in a way that is easy for them to use.
One piece of advice: Never let the developers design the human interface. (For an interesting discussion of the difference between software engineers and normal users, see the book The Inmates are Running the Asylum by Alan Cooper.) Developers tend to be rational, linear thinkers who want to put in every possible combination of functions into the product and who enjoy complexity. A word processing program such as MS Word has millions of lines of complex code and includes functions that 95 percent of users will never use. Start the EPMS with basic functions and add more later on as people gain experience with it and request additional capabilities.
Input to the EPMS
Your stakeholders will primarily interface with the EPMS in two areas: the initial project request form and the outputs generated by the EPMS.
Employees who have an idea for a new project will fill out the online project request form (PRF). This should be designed so that it is easy to fill out and provide enough information to allow the EPMS to analyze the project.
The PRF should include at a minimum:
• The person requesting the new product: Name, organization, title, contact information
• The current problem the product will resolve or the new opportunity it will provide
• A description of the proposed solution
• The benefits it will provide
• Any known risks associated with doing the project
• The different divisions/departments/groups that will be involved
One possible format for a PRF is the first pages of the Toyota Selection Process, shown in Appendix 2.2. Executives should have an input into what they need in the PRF. Don’t underestimate the importance of a user-friendly request form. The easier it is to use, the more likely people are to use it. If the programmers make it too challenging, it reduces the desire to use it.
Outputs From the EPMS
The outputs generated by the EPMS will be of three primary types: the rank-ordered list of projects that the steering committee will use to select new projects, the dashboard used daily by the portfolio manager, and the regular status updates on the current state of the projects in the portfolio. Each one has different users and requires a different design.
For the steering committee, they want enough information to make an intelligent decision on which projects to approve. No numerical scoring is perfect, so the committee should be given some flexibility in which projects to approve while still knowing what the analysis shows.
When properly designed, it is possible to drill down into more details on any project just by clicking on the project or on one of the colored indicators. The dashboard is difficult to design and implement. This is one area where commercial products have an advantage over in-house development. But, repeating an earlier comment, tracking projects already in work is not necessarily part of a portfolio management system, it really belongs to a PMO.
The format for the reporting should be both detailed enough to provide management the information they need, but not so detailed that it overwhelms them with details. Sometimes, a simple spider (or radar) chart shown here is adequate for a single project.
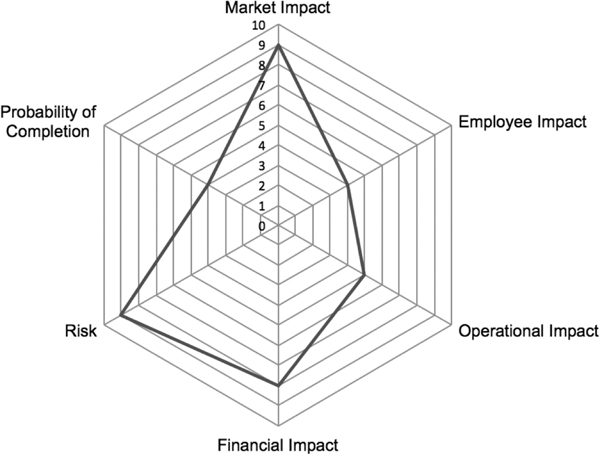
Figure 2.2-13 Reporting project priority to management
If there are multiple projects to be compared, a spreadsheet or a database will work better that allows showing the multiple projects under consideration. The information to be reported should include:
1. Project
1.1 Project name
1.2 Requester
1.3 Department
1.4 Departments impacted by the project
2. Mandatory (Yes/No)
3. Required upgrade (Yes/No)
4. Internal improvement
4.1 Employee productivity
4.2 Customer relations
4.3 Process improvement
5. Financial scores
5.1 Initial investment
5.2 Annual revenue
5.3 Annual expenses
7. Risk score
2.2.10 Design Considerations for Tracking Projects in Work
Once projects have started, they will be monitored during the execution phase. This means the developers must incorporated tracking software tied to the project’s schedule so that proper governance can be applied to the project. If the project is seriously behind schedule or over budget, this should be obvious in the EPMS reports to management so that they can make an intelligent decision to keep the project going or to kill it and free up resources for other projects.
Another consideration is that projects are approved based on their business case justification. If the scope of the project changes during execution (not an uncommon situation), at what point has the scope changed so much that the project no longer satisfies the business case? This needs to be flagged by the EPMS so that management can decide to kill the project. Unfortunately, this is much harder to do than tracking schedule/ cost issues. It is often a judgment call whether the business justification has been violated or not.
Step 2.3 Doing the Financial Calculations
Not everything that counts can be counted, and not everything that can be counted counts
—Albert Einstein
Companies that rely mostly on financial metrics obtain “unbalanced portfolios” that are not well matched to the strategy of the firm
—R. Foti12
We could get very sophisticated about the financial calculations that could be applied to the project selection process. We could hire economists and do a lot of detailed mathematical modeling. But let’s be honest—at this point, we really don’t know accurately how much the projects are going to cost or how much benefit they’re going to provide. We’re guessing about the future state of the environment, and even many stock market analysts, who earn a great deal of money predicting the future, have a fairly low success rate.
For products that we are going to sell, part of the goal of the marketing department is to identify future benefits from these products. Even though they do a lot of consumer surveys, product testing, and gather as much information as they can, their numbers are only rough guesses as to what the future profits will be. Productivity improvements due to changes in business processes are in the same category. These are “soft” numbers, educated guesses, often overly optimistic guesses, rather than the “hard” numbers that can be assigned to the costs of the project.
Hard numbers are those things you can measure and expect to be validated after the project is completed. For example, project costs and revenues. Soft numbers are benefits that are hard to accurately quantify, but you can make some estimate of: reduction in order backlogs and billing errors, decrease in future maintenance requirements, improvements in supply chain management, and so on.
So, rather than try and attain an accuracy of three decimal points, let’s set up the financial calculations so that we can quickly assess the costs and the risks within 25 percent or so. For complex engineering projects, we may not get closer than ±50 percent. (If the project is approved and a proper amount of planning is done, this number should be within 10 percent, but for now, 25 percent accuracy is about as good as we need to do.) The goal of the financial analysis is to give the decision makers enough information to allow an intelligent decision as to how this project compares against the others and whether this project is worth doing or not. If the project justification uses a lot of soft numbers, examine the assumptions very closely and do not select the project if there are too many assumptions being made. This is part of preparing a business case for the project.
Having said how rough and approximate the numbers are, upper management has more trust in any numbers, hard or soft, than they do with not having any numbers at all.
Economist Kenneth Arrow was a statistician during the Second World War. One of his jobs was analyzing weather forecasts made months into the future. The forecasts, he found, were pretty much useless. When he warned his commanders against taking them too seriously, he received a legendary response: “The Commanding General is well aware the forecasts are no good. However, he needs them for planning purposes.”
We quoted Albert Einstein earlier because we need to keep in mind when we’re filtering projects, that some of the most important projects may be difficult to assign hard numbers to. Anything that improves employee morale and productivity is a worthwhile project. But, how do you assign numbers to a small increase in morale? You really cannot, so it becomes a best guess. A soft number. But, we can still make our guesses reasonable.
Borrowing a thought from the Elihu Goldratt’s theory of constraints, to gain the greatest benefits, internal projects should concentrate on improving the constraints, the bottlenecks, in the organization, whether that constraint is poor business processes, poor technologies, poor product development processes, limited skilled resources, and so on. But, it is very difficult to quantify the financial benefits of doing these projects. If I improve business processes, how much of a productivity improvement, and thereby a financial benefit, can I expect? 2 percent, 5 percent, 10 percent? It’s hard to nail down these numbers.
Let’s now concentrate on how we assign numbers and do the financial calculations that will help management select the projects.
Along the effort to determine the financial benefits of doing a project, another concept besides the traditional ROI, NPV, or other typical calculations, consider using an Economic Value Added (EVA)13 analysis as an additional ROI-type approach: most simply, this refers to the amount earned that is in excess of the cost of doing the work. If the cost is $100,000 and you earned $110,000, the $10,000 difference between the cost and the amount earned is the EVA.
2.3.1 Building the Business Case for Proposed Projects
We talked about the business case extensively in the previous chapter and showed how to justify the EPMS project itself. The justification for the projects that will be added to the portfolio will be different depending on the type of project. Creating a reasonable business case for the project will be done by the project sponsor who wants this project approved or by someone on their staff. If it is a new product development, this will likely be done by someone in marketing. If it is an internal improvement project, the business case will be done by the sponsoring organization usually by a business analyst reporting to a particular division.
The emphasis on the business case for most projects is financial benefit. While many executives will claim that something they want is “a strategic investment,” that statement is insufficient to justify a project. By comparison, if we can say “We’re a $10B company with an accounts receivable average age of 75 days. This project is going to get it down to 60 days. Reducing the collection period by 15 days is going to free up $75M in working capital.” That type of detailed justification will get a project approved. That is what you want to capture in the business case. You don’t want some high and mighty strategic goal that can’t be measured against. Force the decision makers to put numbers on the success criteria.
For internal projects such as process improvements or IT projects, before writing the business case, the person who submits the project request should spend time meeting with management to identify exactly what is expected from the product. The outcome of the meeting(s) is a list of high-level business requirements that define the end result. What is requested in the business case should not be a high-end, gold-plated product. It should be what is required to solve the business problem but no more.
Because the IT department in many organizations is a large financial cost sink and IT projects historically have a high failure rate, upper management has become very leery of approving them. In the business case for an IT project, a best practice is to offer three versions of it, doing the financial calculations for all three:
• Bare-bones version, just enough functionality to solve the worst problem only and at lower cost
• Middle-of-the-road version, with the functionality to satisfy all of the business needs but at a higher cost
• Gold-plated version, to enhance functionality, benefits,
user-friendliness, and future growth, usually at a much higher cost
At this point, the costs are very rough guesses, so don’t spend a lot of time on them. Just come up with reasonable estimates, but make them as detailed as you can. It will help sell the project to management.
For example, an online company has large data centers that require very large amounts of electricity. Online companies typically run their facilities at maximum capacity around the clock, regardless of the actual demand. As a result, data centers can waste 90 percent or more of the electricity that is used to run them. The head of facilities for your company has done some analysis and shows the following benefits of improving the energy consumption of the 5,000 square-feet data center consuming 1,127 kW of power (numbers from a white paper by Emerson Network Power14:
Table 2.7 ROI calculations for energy project
Energy-saving action |
Energy logic savings with the cascade effect |
ROI |
|
Savings (KW) |
Savings (%) |
||
Low-power processors |
111 |
10% |
12–18 months |
High-efficiency power supplies |
124 |
115 |
5–7 months |
Power management features |
86 |
8% |
Immediate |
Blade servers |
7 |
1% |
TCO reduced 38% |
Server virtualization |
86 |
8% |
TCO reduced 63% |
Higher voltage AC power distribution |
20 |
2% |
2–3 months |
Cooling best practices |
15 |
1% |
4–6 months |
Variable capacity cooling |
49 |
4% |
4–10 months |
Supplemental cooling |
72 |
6% |
10–12 months |
Monitoring and optimization |
15 |
1% |
3–6 months |
While these numbers are under optimal conditions, they show the level of detail that you will need to provide management to make a decision on whether to approve the project or not.
If part of the project requires purchasing software, we will point out later why you should never use the financial numbers given you by vendors for the product’s benefits. As already mentioned, IT projects have a historically high failure rate so many company executives have learned to distrust the wonderful ROI numbers that are stated in the business case. For IT projects, you can increase the probability of having the project selected by doing your own financial calculations and perhaps include case studies from other companies that have implemented the same product.
Example: Let’s say our CIO wants to implement the Software Engineering Institute’s Capability Maturity Model (Integrated) (SEI CMMI) into the IT group. This is expensive and will take several years, but the benefits have been shown to be worthwhile in the long term.
Should he (or she) just verbalize the benefits of the CMMI processes? Will that convince the executives to put money into it? Probably not. But, if the CIO can show strong financial benefits, then the project stands a much better chance of being approved. For example, SEI Tech Report 2001: CMM ROI showed the following:
Table 2.8 ROI for software process improvements
Cost of S/W Process Improvement per engineer |
$1,375 |
Productivity gain/year |
35% |
Improvement in defects discovered prior to formal test |
22% |
Yearly reduction in time-to-market |
19% |
Reduction in postrelease defect reports |
39% |
Value returned for every dollar spent on SPI |
$5 |
In other words, the CIO can show a ROI, and ROI, of $5 for every $1 spent on the project. That is the kind of number, and justification, that will help the project get selected.
It is absolutely necessary to have a strong business case for the proposed projects? The research shows that industry leaders in the area of new product development do a lot of front-end work to ensure that they have good numbers that go into the financial analysis. The following chart15 shows the percent of businesses that do analysis prior to starting projects:
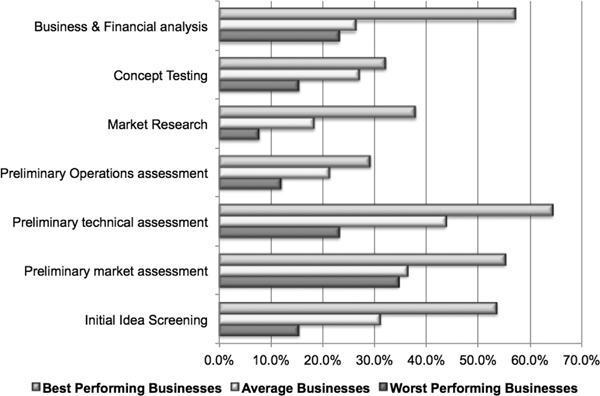
Figure 2.3-1 Analysis done prior to project approvals
It shows clearly that top performers do a lot of work getting the numbers right before proposing a project. The best performing businesses do market research and market assessments, financial analyses, preliminary technical assessments, and screen out ideas much more than even average companies.
In IT, there are problems other departments do not have. Too many CIOs made promises for years that the next investment will clear up all the current IT problems, without actually delivering on that grand promise. Top executives have recognized that they have been pouring a lot of money into IT and still not getting what they want. According to a study by the Panorama Consulting Company16 of 1,300 ERP implementations across the globe, 79 percent of them delivered less than half of the expected business benefits. Similarly, Information Week found that only 25 percent of IT projects will have delivered hard monetary benefits.
Another study by Information Week found that 65 percent of ERP projects go over budget, and 93 percent take longer than expected. Further, a significant portion of the participants in the study admitted going 50 percent or more over budget. These numbers have not improved since then. While these studies are on ERP implementations (which have a long history of troubled projects), similar results have been found for other complex IT implementations such as client relationship management (CRM) projects and supply chain management implementations.
2.3.2 The Business Case for Different Futures
If we had perfect information about the future the decision which projects to pick would be very simple. (The future being defined as the number of years that management has told us to do the calculations for.) However, we have limited information about the future. We can only guess at how well our new products will do or how much more productive our employees will become.
While we cannot know for certain the future, we can divide the future into futures we’re certain about, futures we’re somewhat certain about, and futures that are totally unknown. Military organizations have for many years (probably hundreds or years or longer) divided their future guesses into three categories:
Known–knowns: We know with a great deal of certainty what the future at some point will be, such as the known composition and deployment of enemy forces. We can make predictions and plans based on relatively certain knowledge in this scenario.
Known–unknowns: We know what the general state of the future will be, but we do now have any details, such as knowing the enemy is there, but now how big their forces are or how they’re deployed. In this case, we can develop reasonable estimates based on what we know.
Unknown–unknowns: We cannot even predict what the future will be because we have virtually no knowledge or information. We don’t even know that the enemy is out there, let alone how big they are or how deployed. We’re blind and deaf.
Hugh Courtney (Courtney)17 has provided a simple framework for thinking about the amount of uncertainty surrounding the future:
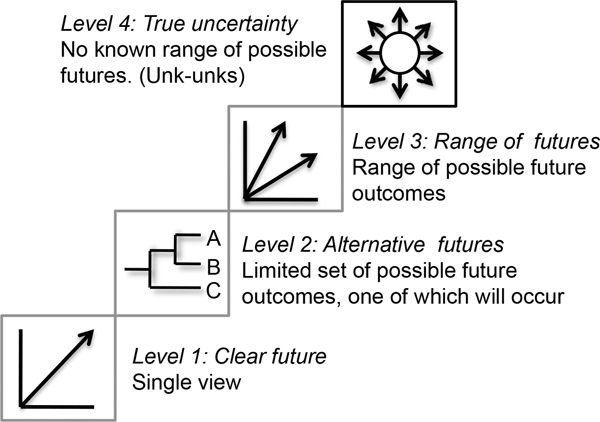
Figure 2.3-2 Possible future states
If the future is clear (Level 1), then our financial calculations are very straightforward and need only be done once for each proposed project. This is accurate out to a year or so. If there are well-defined possible futures (Level 2), then we should do our project calculations for different possible future environments. This would be the situation in a 1 to 3 year timeframe. Further out, say 3 to 5 years, there is a wide range of possible futures (Level 3) and all of our calculations become less certain. We should perform our financial calculations within well-crafted scenarios that describe our assumptions about the future. If we are working at a Level 4 state of uncertainty, more than five years in the future, then we are wasting time doing any calculations, and we’ll need management to provide us with the possible future states they want us to work within.
Because every calculation you do depends on your assumptions about the future, for Levels 2 and 3 of Courtney’s framework, the cost justification section of in the business case should be built three times using three different assumptions about the future:
• An optimistic financial future—the case that only occurs 10 percent of the time
• An expected financial future—the situation that will occur 80 percent of the time
• A pessimistic financial future—the case that will only occur 10 percent of the time
How can we do this? We use a decision tree with three possible scenarios. This allows us to deal with Courtney’s Level 2. Let’s say that in an optimistic future, this project will produce a net revenue of five million euros. We expect the future to be moderate, and the project will produce a new revenue of three million euros. If the market turns down and the future becomes pessimistic, it will produce a new revenue of only one million euros.
Now we build our decision tree to determine the value that we expect from this project. If a possible event has a 25 percent probability of occurring, and if it does occur, it will benefit me by $10,000, then the expected value of the event is: 0.25 × 10,000 = $2,500.
To take this one step further, a possible future event has a 10 percent chance of happening. If it happens, I will gain $10,000. If it does not happen, and there is a 90 percent probability it will not, I will lose $5,000. My expected value becomes:
0.10 × 10,000 + 0.90 × (–5,000) = 1,000 + (–4,500) = –$3,500
We can now use these calculations and develop possible future outcomes based on how likely we think the different scenarios are. If we think the most likely future has an 80 percent probability of occurring, and the pessimistic and optimistic futures each have a 10 percent probability of occurring, then the expected revenue in each one is:
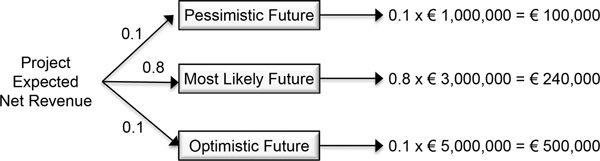
Figure 2.3-3 Decision tree analysis
Adding the three possible future outcomes and dividing by three gives us an expected value for the project of 280,000 euros. This then is the value we use when doing the later financial calculations. If you had the time to be really thorough in your calculations, for each of these three possible outcomes, you would perform the calculations for the three different versions of the product: bare-bones version, middle-of-the-road version, and gold-plated version, thereby doing nine separate calculations. A lot of work, but it will give you, and the decision makers, a much better view of possible outcomes.
As our EPMS does the cost calculations and compares the cost of the product with the expected revenues, it will subtract the cost of the project from each of the possible future revenues and calculate the net expected monetary value (NEMV) of the project. If this number is negative, that is, if the project costs more than any possible future revenue, the project should be rejected.
Let’s see how this works for the MegaNews International projects. The CIO, working with the Marketing Department, has determined projections for the following projects based on their assumptions of strong market response and weak market response:
How did we arrive at the net revenue or savings? Let’s take one example.
Project C: (0.8 × $250,000) + (0.2 × −$75,000) − $2,500,000 =$2,315,000.
So, we took the probable savings and subtracted the cost. The other calculations are similar. Using this approach, we see that the most beneficial project is H—putting news screens into Starbucks Coffee Shops and collecting the ad revenue.
Like every projection out into the future, there are a lot of assumptions that must be made, and a lot of these numbers are best guesses. How did we decide the probabilities of strong and weak response? It’s our best guess. How did we come up with the figures for the revenues? Again, it’s our best guess. These are subjective numbers, and you will find them heavily challenged when you present your analysis to the decision makers. In defense, you should have strong justification for where the numbers came from. The Marketing Department can help you here because they make these future guesses frequently.
Table 2.9 MegaNews project options
Project # |
Project |
Estimated cost |
Probability of strong response |
5-year revenue or savings if strong response |
Probability of weak response |
5-year revenue or savings if weak response |
Net revenue or savings, or (loss) |
C |
Corporate finance wants to install a data warehouse to manage all of the financial information. |
2,500,000 |
80% |
$250,000 |
20% |
-$75,000 |
($2,315,000.00) |
D |
We want to have a new website to compile news from other sources and allow viewers to buy it from us. |
4,000,000 |
75% |
7,500,000 |
25% |
1,250,000 |
$1,937,500.00 |
E |
We are opening new U.S. headquarters in Los Angeles and need to tie their LAN into the corporate network. |
500,000 |
95% |
$500,000 |
5% |
$125,000 |
($18,750.00) |
G |
We need a new service to allow us to deliver user-customized financial news via smartphones, tablets, and PDAs with wireless connections |
5,000,000 |
60% |
10,000,000 |
40% |
2,500,000 |
$2,000,000.00 |
H |
We are going to put news screens into each Starbucks Coffee Shop in the United States, showing news headlines from around the world. |
20,000,000 |
50% |
50,000,000 |
50% |
15,000,000 |
$12,500,000.00 |
I |
Our website is currently written in English; we intend to internationalize it by creating versions in multiple languages. |
6,000,000 |
65% |
10,000,000 |
35% |
2,500,000 |
$1,375,000.00 |
J |
Half of our employees are using Macintosh computers, the rest are using PCs running Windows 8. The Windows component needs to be upgraded to Windows 10. |
5,000,000 |
10% |
22,500,000 |
90% |
-5,000,000 |
($7,250,000.00) |
In the financial environment that began occurring around 2007 and got progressively worse during 2008 and 2009, the projects that you would have picked would fall into the pessimistic scenario. These are likely to include survival projects to just keep the organization going rather than to develop new products. As the financial environment deteriorated, the portfolio should have been re-examined under the new future and adjustments made to the projects in work. In Ram Charan’s book18 on how to manage in these difficult times, he says: “Projects that once were evaluated on the basis of their return on investment now must be judged in terms of how much cash they consume and can generate, and how soon they can bring in cash.” If the economy has improved since our original numbers, the most optimistic case is more likely and those numbers become more accurate.
2.3.3 The Project Manager’s Uses for the Business Case
While the business case is initially used to sell the project to the organization, it does not get put on a shelf and forgotten. It has uses later on during the execution phase of the project. It should be used to guide the project manager’s decision making to ensure that the original goals of the project are kept in focus.
When creating a business case, you should start with the end in mind—how does the end result benefit the organization? One way to approach this is to ask a related question—what does success look like? How will we know when we have delivered what the organization needed? Part of the business case should contain success criteria that are agreed-to by the major stakeholders.
Once success has been defined for the project, metrics are built around that definition of success. The metrics should be as detailed and as quantitative as necessary to ensure that we accurately measure how we’re doing against the goal of the end product. If the end product is going to eliminate production-line shortages or reduce cycle time, then the success criteria are built around those expectations.
As an example, let’s say that the project is going to build a data warehouse to replace a mix of older legacy data systems. How responsive should data queries be? (Recall our discussion of nonfunctional requirements earlier. Performance requirements like this are a key input to the design of a product.) If a request for data is sent and the answer comes back in two seconds, is that a successful response? How about 10 minutes for a complex query, or 24 hours? While most business people would not be happy with a 24-hour turnaround for information, it is up to the project manager to define exactly what the product’s detailed success criteria are and measure against those during the project. Being told “as fast as possible” is not an acceptable answer. You cannot measure against that.
Defining those detailed success criteria is done by the primary stakeholders, those who have the most to gain from the end product. These types of success criteria are not necessary in the business case to justify the project, but need to be added later as the project management planning process develops the details of the project.
Keep in mind that any project that assumes future income is subject to the future financial environment. If it changes, the product that was produced may not be considered successful through no fault of the project manager. When you perform the financial calculations, clearly state what assumptions you are making about the future.
2.3.4 Impact of Change Requests During the Project
One difficulty that exists in most projects involves change requests. All projects are subject to changes. The goal of a formal change management system is to minimize the impacts of any changes. The most devastating types of change requests involve adding requirements (leading to scope creep) and deleting functionality in order to meet the schedule.
Both of these types of changes will lead to the project no longer meeting its original business case. What should happen, but almost never does, is the project’s business case numbers should be recalculated to see if the project still satisfies the original request. If additional scope is added what is the impact on the project’s cost and schedule, and how does that impact the ROI? If scope is deleted to meet schedule, what is the impact to the end product, and how does that reduced functionality impact what was promised?
In some cases, the project, if it deviates from the business case, needs to be brought back into alignment with what the original goals were. In the situation where a change improves the business case, the business case should be adjusted with all major stakeholders approving the changes. The business case is not a static document. Make changes to it when it makes sense to do so (but always keep a copy of the original business case for comparison).
If a major change request is made, it makes sense to revisit the business case and check the impacts. Experienced project managers are pretty savvy about identifying and controlling major change requests. Yet, projects are much more likely to suffer from multiple small changes, and in this case, only rarely is the business case re-examined and recalculated. At what point has the project changed so much that it no longer makes sense? At that point, the project should be killed and a new project defined. We mentioned success criteria should be part of the business case. The document should also identify kill criteria—under what circumstances should the project be canceled.
In the construction industry, any changes that impact scope, cost, or schedule after construction begins will almost never cause the project to be canceled. Once the building starts, it will complete whatever the cost is with few exceptions (such as during a severe economic downturn). This is not true in IT. Just because the developers have already started coding does not mean that change requests for new functionality will stop, or that the architecture of the software will not change. People who would never dream of asking for a building redesign after construction starts have no problems with asking for additional functionality after coding starts. In the IT industry, it is particularly important to revisit the business case during the execution phase of the project.
There are methodologies in the IT world to attack this common problem. The Swiss government first attacked the problem of IT projects with the Hermes methodology in the 1970s. More recently, Projects in Controlled Environments (PRINCE) is a methodology that was funded by the British government, specifically for IT projects in the public sector. The PRINCE approach (now up to PRINCE II) requires that the project be constantly compared to the original justification to ensure that it still makes sense. This is a best practice.
Another approach that has evolved in IT is the use of agile development approaches. When IT began discovering the benefits of project management, they copied existing methodologies that developed in the areas of aerospace and construction, and quickly found these approaches don’t work. They don’t work because in aerospace and construction, the basic requirements don’t change very much, particularly after the development phase starts. But, IT never learned to define the requirements ahead of time and lock them down, so developers are constantly having to deal with changing requirements.
This led to the growth of agile development approaches that can adapt to changing requirements. Historically, agile-type approaches were first recommended for IT in a presentation back in 197019. The same presentation nicknamed the traditional approach as a waterfall approach, the first recorded instance of that name.
In IT, the problem of change requests is a common one and often poorly dealt with. Other industries have learned how to deal with it better. Both the Construction Industry Institute (CII) and Independent Project Analysis, Inc. (IPA) emphasize a methodology for large-scale engineering projects called front-end loading (FEL). This is a process by which a company develops detailed definition of a capital project to meet business objectives. “Benchmarking data in the oil and gas industry, …, shows conclusively that effort spent (up to a point) on front-end definition (so-called ‘Front-end Loading’ – FEL) correlates positively with project outcome performance”20.
Using an FEL approach, the requirements are defined and locked down months before any detailed planning is performed. This approach allowed Saudi Aramco to develop a U.S. $2 billion gas field project in the middle of the Saudi Arabian desert, and to complete it six months ahead of schedule and for 27 percent under budget. The total percentage of change requests 2 percent, and all of them safety-related. This project was awarded Project of the Year by PMI in 2004. There are similar examples from other oil and gas projects.
2.3.5 Some Basic Financial Terminology and Concepts
Before we can set up the financial filters, we need to understand some basic financial concepts. This is a very simplistic background, and when you develop the calculations for your own EPMS, you should get someone from the financial department to help you with the more sophisticated calculations.
The goal of financial analysis in a portfolio is to invest in projects where the value of the future returns is greater than the cost. If the future value is greater than cost, the extra value enhances company’s bottom line (and the stockholders’). We want to select projects with highest value of future returns and greatest probability of success.
There are multiple methods of calculating the expected financial benefits of different projects. Each has its own strength and weakness. No one method is perfect. Often financial officers use multiple methods of calculation for each project to find the “best” average answer.
What is more important than the specific method used is that the same financial methods be done for all projects of the same type and to the same number of years in the future. All IT projects should be compared by the same financial methods. All capital investment projects should be compared by the same financial methods. You cannot compare a construction project that has a cost–benefit justification with one that has a NPV justification. Be consistent and use the same approach for both.
Once the financial calculations have been carried out, the specific approval justification should also be dependent on the type of project. Compare a project with similar projects. A BPI project requires different approval gates than does a new manufacturing facility. Each type of project should have distinct and unique justification criteria.
It is important to remember that nothing in the future is certain. Both costs and future cash flows must be estimated. It is easier to estimate costs, so future revenues are generally more uncertain than development and manufacturing costs. Several methods can be used to compute the advantage in an investment when the cash flows are certain, but none can guarantee success. By doing the appropriate calculations, there are ways to understand the implications of risk, but there no ways to eliminate uncertainty. If there were, the stock markets would be much more predictable than they are, and we would all be living on yachts!
The time value of money is a concept used to understand the investment implications of a project, that is, the investment of money related to expected interest. This is based on the premise that money has the most value when it is invested and receiving interest or can produce more money in the future.
One of the people who sits on the organization’s executive committee is the Chief Financial Officer (CFO). This person’s responsibility is to ensure that the organization gets the greatest value for its money compared to the risk. Should the organization invest its cash in stock or buy CDs? Should the organization invest in projects that expand it or save its money? These are questions the CFO gets heavily involved in answering. A risk-averse CFO is more likely to recommend investing the money in CDs or bonds. A more risk-tolerant CFO is more comfortable with investing the money in risky projects.
Future value (FV) measures the future amount of money that a given amount of money is worth at some specified time in the future assuming a certain rate of return.
The opposite of Future Value is present value (PV), the PV of an amount that will be received in the future. It is also called discounted value. The calculation is just the reverse of FV. How much do I need to invest today to obtain $1.21 in two years? The answer is $1.
Other financial terms we need are:
Capital rationing: Selecting best group of projects without going over budget. Because all organizations have limited budgets for projects, how do they allocate the money across multiple projects? This is a topic we discussed heavily in the previous section.
Benefit/cost analysis: A formal discipline used to help assess the case for a proposed project by comparing its benefits to its expected costs.
Discount rate: The rate used to calculate the PV of payments
Discounted cash flow (DCF): Reducing cash flow to account for the time value of money. As an example, a $10 million lottery ticket paid over 20 years with a discount rate of 6 percent is worth about $5.73 million today. If you won the lottery and asked for all of your money up front, you would receive $5.73 million and not $10 million. If you invested that $5.73 million at the 6 percent interest rate assumed in the calculation and took out one-twentieth every year, at the end of 20 years, you would have collected $10 million.
Interest rate: The cost of borrowing funds. NOTE: For our Islamic students, the Quran prohibits making money on money, that is, it prohibits paying interest. However, the concept of compensating a lender for the risk of the investment is still valid. It is simply handled in a different way. The results are the same.
Internal Rate of Return (IRR): The interest rate at which the PV of project revenues and costs are equal. This is a completely artificial interest rate calculation and is only used for comparing different projects. The project with the highest IRR is usually the one selected.
Opportunity cost: The value of the next best alternative that has been given up as the result of making a decision. It implies the choice between desirable yet mutually exclusive results. For example, if I select project A instead of project B because the NPV is better and I cannot do both, the “opportunity cost” is the cost of not doing project B.
Net Present Value (NPV): The present value of the expected future benefits minus the present value of the cost.
Payback period: The period of time required for the return on an investment to “repay” the original investment. The payback period is considered a method of analysis with serious limitations. It does not properly account for the time value of money, risk, financing, or other important considerations such as the opportunity cost.
Return on Investment (ROI), also known as rate of return (ROR) or sometimes just return, is the ratio of money gained or lost on an investment relative to the amount of money invested.
Which ones are most commonly used? Payback period has a lot of limitations due to its simplicity. Benefit/cost analysis is most effective on projects where the benefits are not quantifiable, such as infrastructure or large engineering projects. The most common calculations are ROI and NPV (and its inverse, the IRR). For the majority of the projects in the portfolio, these are the calculations that are most useful. Now that we have learned these basic definitions, lets look at how we do the financial calculations to select the more financially beneficial projects.
2.3.6 Financial Filtering Methods
2.3.6.1 Payback Period
Payback is a very simple calculation that tells us how long it will take to recover our initial investment. A project costs $10,000,000 initially. You expect to receive $3,000,000 per year. What is the payback period?
So, how do we do this calculation? It is a very simple calculation (and therefore very limited in its usefulness). It is no more than estimated costs divided by expected annual benefits. For our MegaNews International projects, the calculations look like this:
A special note for project J: This type of calculation requires a lot of rough assumptions. Let us assume that 20,000 people are affected with an average salary of $80,000/year. A 10 percent reduction in productivity is like adding 2,000 people to the workforce, resulting in a six-month cost of $40 million.
A 2 percent increase in productivity over six months would result in a benefit of $8 million or an annual benefit of $16 million. Let us assume that the total annual savings is created by laying off 25 IT people, resulting in a saving of $2.5 million.
Running out the savings on a monthly basis, we see that we break even on the project around 27 months after we complete it.
From the standpoint of a payback calculation, the CIO can immediately see that corporate finance’s data warehouse is not going to give the corporation any benefit for 50 years, long after it has been replaced with newer technology. She can throw that one out immediately.
Project E, the Los Angeles offices, is marginal from a payback period. Most financial officers demand a payback period no longer than three years for an IT project. Let’s see how this project does in the other financial calculations.
Quick Notes
Don’t bother doing financial calculations beyond a cost estimate for mandatory projects unless directed to do so. Since you have no choice but to do these projects, the return is irrelevant.
Table 2.10 MegaNews project payback period calculations
Project |
Project |
Estimated cost |
Annual benefits |
Payback period |
C |
Corporate finance wants to install a data warehouse to manage all of the financial information. |
$2.5M |
$50,000 |
50 years |
D |
We want to have a new website to compile news from other sources and allow viewers to buy it from us. |
$4M |
$1,500,000 |
2.67 |
E |
We are opening new U.S. headquarters in Los Angeles and need to tie their LAN into the corporate network. |
$0.5M |
$100,000 |
5.00 |
G |
We need a new service to allow us to deliver usercustomized financial news via PDAs with wireless connections. The revenue will come from ads. |
$5M |
$2,000,000 |
2.50 |
H |
We are going to put news screens into each Starbucks Coffee Shop in the United States, showing news headlines from around the world. The revenue will come from ads. |
$20M |
$10,000,000 |
2.00 |
I |
Our website is currently written in English; we intend to internationalize it by creating versions in multiple languages. The revenue will come from ads. |
$6M |
$2,000,000 |
3.00 |
J |
Half of our employees are using Macintosh computers, the rest are using PCs running Windows 8. The Windows component needs to be upgraded to Windows 10. |
$5M |
|
27 months |
All financial projections need to be carried out to the same number of years in the future, called the planning horizon. You cannot compare two projects if one is calculated out for three years and the other for five years.
When accounting for costs in internal projects such as BPI or IT upgrade costs—two major costs that are often left out of these projects are the cost of training for the employees and the costs associated with OCM, the organizational change management activities we discussed earlier. These are necessary costs of delivering a successful project that will be used by the people affected by it.
An additional quick note is to determine whether the “costs” of the project are only the design and development costs, or will they include the lifecycle costs (Total Costs of Ownership—TCO). For many projects, this will make a significant difference in the resulting analysis. Whichever way you calculate costs, project-only or lifecycle, all projects of the same type must be calculated the same way so that they may be compared in a consistent manner.
A final quick note is to include any significant contingency funds identified during risk analysis into the financial calculations. A high-risk project may very likely require a lot of money to reduce the risks to an acceptable level, and these funds should be included in any ROI, NPV, or other financial analysis.
2.3.6.2 Return on Investment (ROI)
How much money am I going to get back for the money I’m expending on this project? ROI includes predicted future financial benefits.
What is the “best” ROI? There’s no answer to this, and different types of projects should be judged against different ROIs. As we have said before, developing a new manufacturing facility has a completely different ROI than does a BPI project, yet they may both be worthwhile projects. Upper management must choose a reasonable ROI as a bottom filter that projects must overcome to even be considered. Once that minimum ROI is met, the projects that provide the highest ROI should be chosen after assessing for risk. These bottom filters will be different for each different type of project. Note that some projects, such as mandatory “must do” projects will have a negative ROI. This is acceptable for those projects, and the other weighting factors will have to overcome a negative ROI.
In the world of financial portfolio management, there is a concept call a “hurdle rate.” This is the minimum ROI a company requires for investments. It is more common in some industries, like manufacturing, than in industries like consulting. In setting the hurdle rate for a financial portfolio, there is some account taken of risk, at least in theory. Higher-risk projects, as many IT and NPD projects are, are given a higher hurdle rate. In practice, these hurdle rates are set by management’s “best guess” at how much return they expect for their invested project dollars.
One additional comment about performing ROI calculations for IT projects: never use the ROI numbers given you by the vendors, as we’ve said before. These are highly inflated values for an “ideal” situation and are designed to sell a product, not to improve your business. Spend some time and do your own ROI calculations.
Returning to our MegaNews projects, the ROI calculations are as follows (note, we have left off the mandatory projects):
Assuming management tells us to use a five-year planning horizon. We multiply the annual benefits by five, subtract the cost to get the profits, and then divide by the cost. So for project D, we have ROI = (5 × $1.5M – $4M) ÷ $4M = 0.875.
The calculation for project J is somewhat tricky, and we have to identify carefully the assumptions used. Remember what we said before about it:
We assume that 20,000 people are affected with an average salary of $80,000/year. We expect a 10 percent reduction in productivity as people get used to working with the new software. This 10 percent reduction in productivity is like adding 2,000 people to the workforce, resulting in a six-month cost of $40 million.
After six months, we expect productivity to increase by 2 percent. A 2 percent increase in productivity over the next six months would result in a benefit of $8 million or an annualized benefit of $16 million. Let’s assume that the total annual savings is created by laying off 25 IT people, resulting in a saving of $2.5 million.
We take the benefits that we have calculated for J, divide by the cost, and come up with an ROI of $6.4 million over our five-year planning horizon. So far, this is our most favorable project from an ROI calculation. But, we had to make a lot of assumptions to do the calculation.