
In this recipe we will take a look at the main Eclipse debugging component—Eclipse Debug Perspective. By exploring Eclipse Debug Perspective you will be able to understand the main tools used in the debugging process.
To open Eclipse Debug Perspective go to Window | Open Perspective | Debug (if Debug is not shown in Open Perspective, go to Other… and you will find it there). Eclipse Debug Perspective looks like the following screenshot:
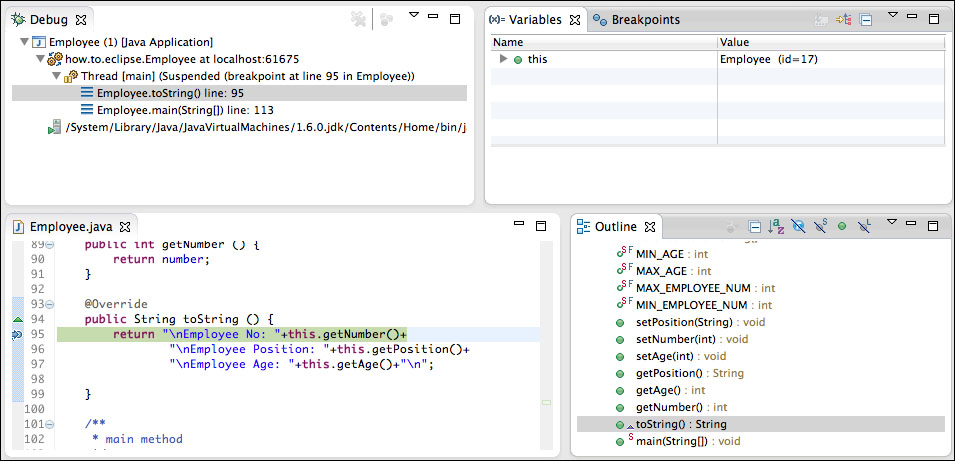
Let's explore the Debug Perspective views one by one.
- To show your current position in the debug process, use the Debug view.
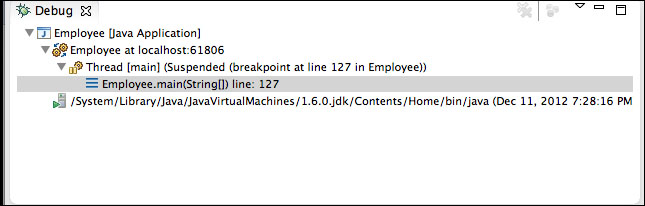
In the Debug view, the information is presented as a stack, which starts from the suspended thread and goes down in the format Class.method(params) line: line number, where every upper entry is the more recent position. By double-clicking on the entries, you can navigate back and forth through the debugging steps. Also, if a debugger is terminated, you will see the terminated message in the Debug view right away.
- To avoid printing out variable values every time, Eclipse Debug Perspective gives us a wonderful tool called the Variables view.
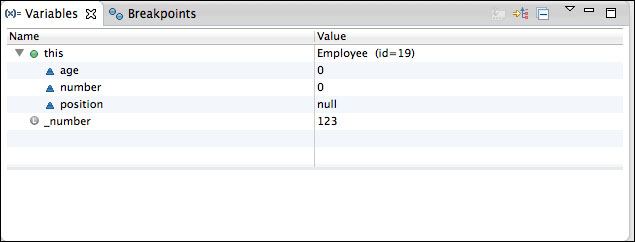
With the Variables view you can actually follow local and global variables in real time. Moreover, you can change how these values are presented. We will look closer at the Variables view further in the book.
- To see a list of all your breakpoints use the Breakpoints view.
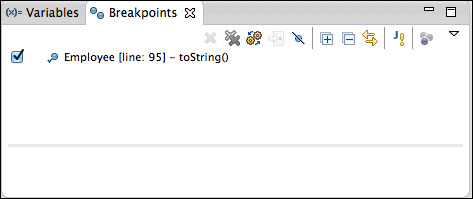
The Breakpoint view lists all your breakpoints in the format class [line: line number] – method(types). It also allows you to set up the breakpoint properties, choose which breakpoints should be skipped, remove breakpoints, import/export breakpoints, and navigate directly to the breakpoint in the code. In the next recipes, we will cover how to set up breakpoints with different properties. So if you haven't used breakpoints before, don't worry as we will cover how to use them in detail.
- The main area of interaction between your code and the debugger is located inside the class view.
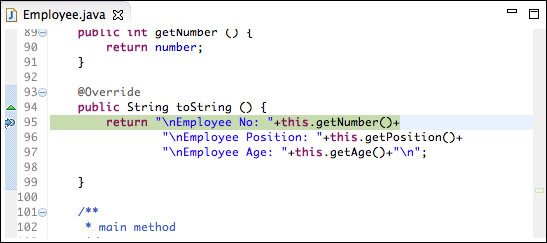
The class view shows the breakpoints and highlights the line you are about to execute. Also, it automatically switches between files when you want to Step Into/Step Over to the other classes.
- To see the structure of the class that is currently under inspection of the debugger, take a look at the Outline view.
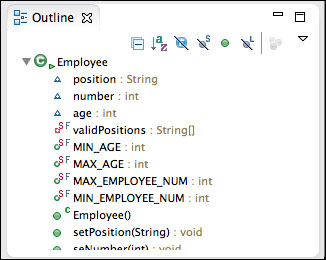
In the Outline view for Java, you are presented with a tree of variable and method names. The menu above this tree allows you to sort the tree and hide/show different parts of it. Also, by clicking on the variable or method name in the Outline view, you are navigated directly to the definition of this variable or method.
- To see the output of your application, use the Console view.
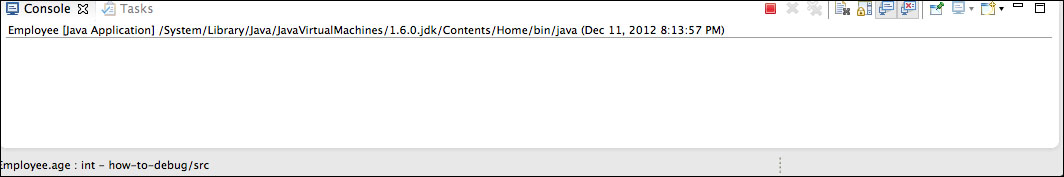
If you look at the top right-hand side of the Console view, you will see a small menu, which gives some extra functionality to the console. The red square button is an option to terminate the thread. For example, it helps when you get into an infinite loop. Some other options in the top menu allow you to clear the console, put a scroll lock, change when to show the console, and open the special Console view (for example, the Maven console or CVS console).
The top toolbar menu of Eclipse Debug Perspective also has some buttons that will help you to control the Debug Perspective's activity.
The first four buttons control the thread. They allow you to resume a thread, suspend a thread, terminate a thread, or disconnect from a remote thread. The other buttons will help you to navigate through the code while debugging. They allow you to Step Into/Step Over to the method, return to the previous step, drop a frame, use step filters, and skip all the breakpoints. We will use each of these options very often throughout the book. Hence, I won't spend much time explaining their functionality at this point.