
In this recipe we will learn why breakpoints are important, how to set them up, and how to navigate through the code using the Step Into, Step Over, and Step Return breakpoint manipulation options.
Let's practice setting up a breakpoint on our sample program.
I am sure you are aware that in Java, the first method that is executed is the main() method. Our Employee class has its own main() method, so let's set up a breakpoint in it.
Tip
If your project has more than one class, and the main() method is located in a different class from the one you are about to debug, go to the ![]() icon and select Debug | Debug Configurations…. Select the class you are about to debug in the left menu and set the Main class option to the class that has the
icon and select Debug | Debug Configurations…. Select the class you are about to debug in the left menu and set the Main class option to the class that has the main() method.
To set up a breakpoint
- Go to the
main()method of theEmployeeclass. - Find
andrew.setNumber(123)(on line 110). - Right-click on the line number (if you don't see the line number, click on the left margin of the Employee tab and choose Show Line Numbers as shown in the following screenshot).
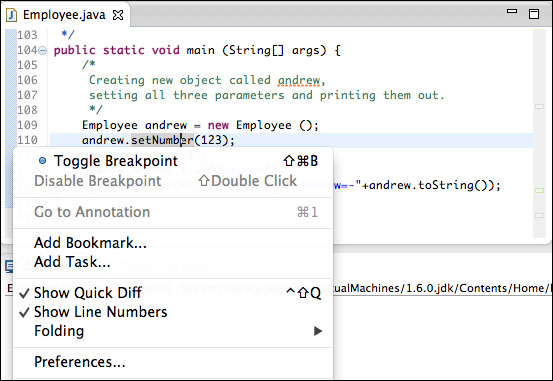
- Got to line 110, right-click on the margin again, and click on Toggle Breakpoint.
-
If your breakpoint is successfully set up, you will see the
 icon right near the line number of the method you wanted to set the breakpoint to. (In our case right near line number 110.)
-
Now let's run the debugger by clicking on the
 icon.
icon.
- If you are asked to switch to Debug Perspective, click Yes.
After running the debugger you should see that your program has highlighted the line with the breakpoint, as shown in the following screenshot:
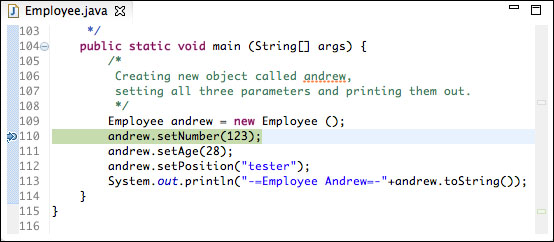
This means that the program has stopped executing before line 110 and is waiting for your actions.
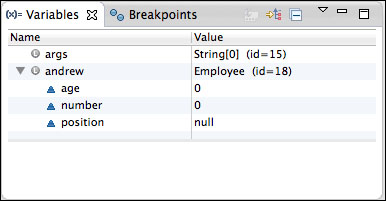
Before we proceed with exploring how Step Into/ Step Over works, let's take a look at the Variables view. Right now there are two lines: args that represents arguments passed to the main() method and andrew. Expand andrew and you will see the current state of all the class variables as shown in the following screenshot:
We will keep on watching this view as it will change when we go through our class.
Let's learn how to navigate through the debugger.
We navigate with the help of the Step Into/Step Over buttons. Let's see how it works.
At this point we are standing at line 110 and there are four options that we can choose. We can Step Into, Step Over, Go to Next breakpoint, or Go Back.
Step Into means that we go inside the method and explore its functionality. Let's try it right now. In the top menu there are two buttons: ![]() . The first button is responsible for Step Into (F5) and the second one for Step Over (F6).
. The first button is responsible for Step Into (F5) and the second one for Step Over (F6).
- Click on the Step Into (F5) icon.
Now you are taken to the
setNumber()method. If you take a look at the Variables view, there are two lines now:this, which relates to the class variables, and_number, which is a variable of the local method.Your position is at the
ifstatement evaluating if the number is between certain limits (at line 46). - Click on the Step Into (F5) icon again.
As there is no method to Step Into, the pointer moves one line down; now it's on
number = _number.This line assigns local variables to the class variable.
- Click on the Step Into (F5) icon again.
Right now the pointer should be at line 49.
Now let's look at the Variables view again. If you expand this, you will see that the number is highlighted in yellow. This is because the variables have changed their values. See the following screenshot:
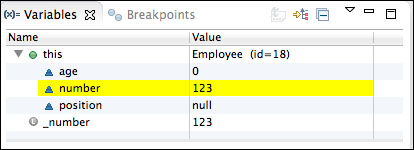
This highlighting is very useful, as it allows you to see what variables have changed their values right after it has happened.
Before we use Step Into one last time in this exercise, let's also take a look at the Debug view. Sometimes, when the project is big, it is very hard to determine what is the hierarchical structure of the classes and methods, which you are in at the moment. In our case the Debug view shows that we are in the
setNumber(int)method on line 49, and if we look below this line, we see that we came here from themain()method on line 110. See the following screenshot: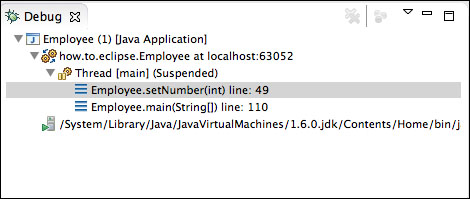
- Click on the Step Into (F5) icon.
As we have reached the end of the
setNumber()method, Step Into makes it return back to themain()method, and the pointer points to the next line (line 111 in our case). Also, the Debug view no longer showssetNumber()in its hierarchy.
Now, let's consider the situation when you don't want to step into the method but you want to go directly to the next method. In this situation we use Step Over (F6). Note that when you use Step Over, the method is still called but the debugger does not walk you through it.
Let's step over the setAge() method.
Clicking on Step Over (F6), you might see that you were not prompted inside the setAge() method, but directly to line 112. Take a look at the Variables view. You will see that age is set to 28 (that is what the setAge() method does), despite you not walking through this method.
The last two controls that I want to mention in this recipe are Resume (F8) ![]() , which allows you to continue running your application until it next faces the breakpoint or the end of the program, and
, which allows you to continue running your application until it next faces the breakpoint or the end of the program, and ![]() Terminate (Ctrl + F2), which stops the debugging process.
Terminate (Ctrl + F2), which stops the debugging process.