
Oracle Enterprise Manager Fusion Middleware Control 12c also provides further drilldown into a context-specific administration panel to manage and administer individual composites and their instances within the infrastructure. You can navigate directly to administration tasks for a specific composite by clicking on the Deployed Composites tab. The following screenshot shows the dashboard view of OrderBookingComposite:

Figure 7.7: Composite dashboard view
As shown in the preceding screenshot we can observe that:
- The Retire and Shut Down buttons on the dashboard allow the composite to switch the mode and the state of the composite.
- Clicking on the Test button provides a list of all service bindings that are exposed from the composite. This enables manual initiation of an instance of this composite through the Test Web Service page.
- The Settings menu can be expanded to turn off or on composite payload validations, enable or disable sensors, and change the audit levels.
- A new feature of Oracle SOA Suite 12c is the ability to see the composite assembly from the composite dashboard at runtime. This can be viewed from the Composite Definition tab.
- The Unit Tests option allows you to run test cases that simulate interaction between the composite and its references before deployment to a production environment.
- The Oracle Web Service Manager (OWSM) based policies for authentication, authorization, message integrity, identity propagation, and so on, can be attached or detached at runtime from the policies link to services, references, or components in a composite.
Additionally, many of the administration activities specific to the current composite are available from the SOA Composite menu, which appears below the selected composite. Some of the common and important ones are described here, as also shown in Figure 7.8:
- The SOA Deployment menu allows you to undeploy the composite from the partition or replace it with a newer version through the Redeploy action.
- Deployed Composites can also be exported as compressed archives through the Export facility. Composites can be exported to include all runtime changes, only the runtime changes, or just the originally deployed package. The exported archive can be used to promote the composite to other environments through a corresponding Import mechanism.
- A composite typically comprises of exposed services and external references that are bound to change at runtime after the composite is deployed to the infrastructure. Runtime properties of binding components can be updated by expanding the Service/Reference Properties section.
Let's have a look at the following screenshot:

Figure 7.8: Administration tasks for a SOA composite
The composites and service engine dashboard also includes a Related Links menu that provides relevant additional links depending on the current context. Figure 7.9 shows the Related Links menu on the BPEL Service Engine page, from where you can navigate directly to the SOA Infrastructure home page, the BPEL Properties page (to configure engine properties), the Oracle WebLogic Server Administration Console, or the page for viewing BPEL Engine log files.
All service engines, SOA Infrastructure Common Properties, and business event dashboards provide access to the WebLogic Server Console under the Related Links list. Clicking on the ![]() icon will take you to the a SOA composite in a new tab or browser window:
icon will take you to the a SOA composite in a new tab or browser window:

Figure 7.9: The Related Links menu
To make sure you have a better grasp of learning to manage and administer the lifecycle of an Oracle SOA Suite 12c environment in production, we introduce in this chapter a brief case study of a composite (having multiple services, references, and components) that is deployed to the infrastructure. You, as the SOA administrator, are responsible for its management. The composite can be invoked over a standard web service protocol or over Remote Method Invocation (RMI). A provision is also made such that it can read batches of orders stored in some file-based directory. Once the composite receives an order or an order collection in any of the ways just described, the composite execution is initiated. It requests additional details for the order from backend systems, runs a set of fulfillment and approval rules, publishes status updates, and eventually sends out an email notification. The approval rules determine whether a particular order should be processed automatically or needs manual approval, in which case human intervention is sought.
Now imagine that you are relied upon to manage this critical business process of your organization and need to ensure that you have a good handle on configuring and administering various engines that instances of this composite run on. It may also be required of you to manage or bulk manage live/completed instances, handle faulted messages (setting up manual and automatic retries), set up notification channels, ensure that the external references are not timing out or unavailable, allow for business rules to change dynamically at runtime, and so on and so forth. Don't feel lost! This chapter will address this in detail, step by step, and arm you with sufficient knowledge to handle all these tasks with ease and effectiveness. The following figure shows a typical composite developed to automate the processing of sales orders:

Figure 7-10. A typical sales order composite application [case study]
A major enhancement in Oracle SOA Suite 12c instance administration is the improvement to the instance tracking experience. Not merely providing better usability, the instance tracking feature has undergone an underlying architectural improvement to deliver better performance, visibility, and traceability of composite transactions. It is integrated with the composite dashboards. The following section will help familiarize administrators with navigating around instance tracking and its various features. The example used here will again be the OrderBookingComposite depicted in Figure 7.10 earlier:
- Log in to Fusion Middleware Control and navigate to the composite dashboard (for example,
OrderBookingComposite). - Click on the Flow Instances tab from the tabbed menu. This will pop up a Search section on the left. Also notice that no instances are displayed under Search Results. This is significantly different from the behavior observed in 11g. Instead of loading instances upon navigating to the Flow Instances tab, administrators in 12c will need to provide specific search criteria and search before instance information is available.
- Click on the Search Instances button in the Search section to execute the default search query.
Observe Figure 7.11. The default query duration parameter defined in the common MBean properties for instance search is 24 hours. If there are no search results on the Flow Instances page, this could be because no flow instances were created in the last 24 hours.
The Search Options palette provides the ability to define a number of search parameters to control the flow instances to be displayed, including:
- Access to some very common quick searches (Recent Instance, Instances with Fault, Recoverable Instances) and any saved searches.
- The ability to reset the search fields, save a customized search, and create a bookmarkable link of the customized search to share with others.
- The ability to add State-, Fault-, Composite-, and Time-based search parameters.
- The ability to add up to six Sensor-based fields to filter instances based on sensor values defined in the composites.
Let's have a look at the following screenshot:

Figure 7.11: Instance Tracking dashboard
Additional information about the instance can be viewed by clicking on the instance in a couple of different ways (see Figure 7.12):
- Click on the small space in the row header before the Flow ID. This populates summarized information about the composite instance. The Faults tab displays faults in the message, if any. The Composite Sensor Values tab shows the sensor values for the instance if sensors are configured for the composite.
- Clicking on Flow ID for each instance will open up a Flow Trace pop-up window with a detailed flow trace for the instance. The flow trace provides detailed auditing and status for each individual component in the composite. If the instance propagates through multiple composites or components deployed to the same domain, the flow trace is able to unify it as a single trail. Clicking on an individual component within the audit trail will drill down into the activities executed within the component. The status of the components and the activities within them can help administrators identify the exact failure point. The Flow Trace window, shown in the following screenshot, also has tabs to view alerts, sensor values, and composites, similar to the details pane in the Flow Instances page:

Figure 7.12: Instance Tracking dashboard
Oracle SOA Suite 12c has introduced a fault management module called error hospital. It is used to aggregate transactions that have generated errors and can be used to perform actions such as recovery, abortion, and deletion on transactions with common errors collectively. The aggregations can be based on various criteria based on fault types, names, or at a composite level. Administrators also have the ability to schedule bulk operations to optimize server resources so that they can be executed when business transactions are not.
The SOA Infra dashboard in Fusion Middleware Control provides a summarized view of all faults in the environment based on a specified time period. Figure 7.13 shows the Business Transactions Fault section that displays a chart providing a snapshot on the nature of faults/fault handling in a given period. The following section provides instructions on how administrators can drill down into details of these reported faults and take corrective action:
- In the Business Transaction Faults regions, select an interval from the available dropdowns and click on the refresh icon. This will present a stacked chart of the failed messages grouped by fault states.
- Click on the chart to navigate to the Error Hospital tab page. The page opens with the same query selection from the dashboard. This page has access to the search palette similar to the one used in the Flow Instances tab page.
The fault messages are grouped based on various criteria. These criteria can be changed by choosing a value from the Group By drop down box. The total faults and their current state for each category are also displayed.
Clicking on Total Faults and Recovery Required will drill into the Flow Instances tab where details of the faults can be viewed:
- Bulk actions can also be performed on groups of messages by clicking on either the Bulk Recovery or Bulk Abort options on the top menu bar.
Let's have a look at the following screenshot:

Figure 7.13: Error hospital in Oracle SOA Suite 12c
Recovering faulted instances is a crucial administrative function, especially in long-running and durable processes where the process instance has faults after performing a set of activities. If the process is stateful, then in most cases when a fault occurs at a step, it is desirable to perform a recovery from the point of failure. Enterprise Manager Fusion Middleware Control can display detailed audit logging of an instance execution, providing valuable information such as the point of failure, nature of fault, fault details, and remediation options.
The following Figure 7.14 shows a faulted instance of the OrderProcessing BPEL component that failed due to a remote exception (endpoint unavailable) and was marked as Recovery Required. Once the target system is available, the fault can be recovered by retrying it. Let's have a look at the following screenshot:

Figure 7.14: Recovering individual instances with the Retry Action
The Error Message panel inside the instance audit trail shows distinct faults, and also provides the ability to recover them. Clicking on the ![]() action button drills down to show the Fault Details and Recovery Options screen as shown in Figure 7.15. A Retry Recovery option can be used to recover this fault once the endpoint is available to resume its processing from the point of failure. If the fault is due to an incorrect message being sent to the target service, the fault recovery console also provides the ability to fix the payload before retrying.
action button drills down to show the Fault Details and Recovery Options screen as shown in Figure 7.15. A Retry Recovery option can be used to recover this fault once the endpoint is available to resume its processing from the point of failure. If the fault is due to an incorrect message being sent to the target service, the fault recovery console also provides the ability to fix the payload before retrying.
It is important to note that recovery always does not necessarily mean retrying. Depending upon the nature of the processing logic, sometimes other recovery actions, such as Replay and Continue, may also be used. The recovery options available in Oracle SOA Suite 12c are briefly described as follows:
- Retry: This action immediately retries the instance from the point of failure.
- Abort: This terminates the entire instance and marks the instance as Terminated.
- Replay: This replays the entire scope activity in which the fault occurred. It is only applicable for faults in a BPEL component. Fault recovery using the Replay action is required in scenarios where maintaining the transactional integrity of the process is mandatory. Imagine a BPEL process that inserts order information in three systems via three different invoke operations. Now if these three invokes are defined in a single scope, and any one of the invokes fails, the transaction is rolled back from the previous systems. When performing a recovery for such faults, if the Retry option is chosen, it would be incorrect as it will lead to inconsistent updates across different systems.
- Rethrow: This rethrows the fault and propagates it to BPEL fault handlers (that is, Catch branches). By default, all exceptions are caught by the fault management framework unless an explicit Rethrow fault policy is provided.
- Continue: This ignores the fault and continues processing. Again, this option should be chosen with proper consideration. If the subsequent processing of the instance is dependent on the faulted action, performing a recovery with the Continue action will again lead to errors.
There is a certain limitation to this approach as bulk fault recoveries cannot be performed at this level. Also, the message recovery information available on the instance's Flow
Trace page depends upon the AuditConfig property set for the environment. Accessing this MBean from the Common
Infrastructure MBean Properties page will reveal that the default value of element bpelRecoveryStatus is set to All. This is how recovery information is made available. To prevent it from being displayed, set the bpelRecoveryStatus key to Off.
Let's have a look at the following screenshot:

Figure 7.15: Recovering individual instances with Retry Action
So far you have seen how individual faulted instances can be recovered. Recovering individual faulted instances, though necessary in some cases, may prove to be cumbersome and time consuming. Enterprise Manager Fusion Middleware Control allows administrators to perform both manual and automatic bulk recovery of faulted and recoverable messages. Figure 7.16 shows how the composite error hospital displays different fault types associated with the instances and a mechanism to recover them in bulk.
For instance, for faults to be identified as recoverable, a fault policy must be defined at design time and bound to the composite. The fault policy should be able to categorize faults and bubble them up to the Enterprise Manager console for manual recovery. In the absence of any fault policies, the fault takes its standard course and it is left to the judgment of the SOA Suite 12c infrastructure engines to determine whether it is recoverable or not. It is also important to note that not all faults are recoverable. The following transaction errors will generally not have the option to be recovered:
- Messages with payload errors
- Synchronous messages that have exhausted the retry count
- Messages that triggered a component to throw a non-recoverable error
The bulk recovery commands can be issued by clicking on the Bulk Recover icon (![]() ) to perform a remedial action as shown in Figure 7.16. This will pop up a Recovery Request window where scheduling (when to start and end the recovery process) and throttling (how many instances to require at a time and frequency) parameters can be provided. Leaving the default values will execute the recovery immediately. Oracle SOA Suite 12c introduced a first-class scheduling component called Enterprise Scheduler (ESS), covered in detail in Chapter 11, Introducing Oracle Enterprise Scheduler. Bulk recovery of faulted instances is managed by ESS in 12c. Let's have a look at the following screenshot:
) to perform a remedial action as shown in Figure 7.16. This will pop up a Recovery Request window where scheduling (when to start and end the recovery process) and throttling (how many instances to require at a time and frequency) parameters can be provided. Leaving the default values will execute the recovery immediately. Oracle SOA Suite 12c introduced a first-class scheduling component called Enterprise Scheduler (ESS), covered in detail in Chapter 11, Introducing Oracle Enterprise Scheduler. Bulk recovery of faulted instances is managed by ESS in 12c. Let's have a look at the following screenshot:

Figure 7.16: Bulk Recovering composite instances with a Bulk Recovery Job
When a bulk recovery request is submitted, it creates an ESS job and provides a job creation confirmation link. This link can be clicked and administrators can view details of the job on the ESS console. The status of the recovery job can be checked by refreshing the console shown in Figure 7.17. ESS provides a very powerful tool for Oracle SOA Suite 12c administrators to automate the fault recovery process by scheduling bulk recovery jobs to execute during non-business hours or when the server resources are under considerably less duress. Let's have a look at the following screenshot:
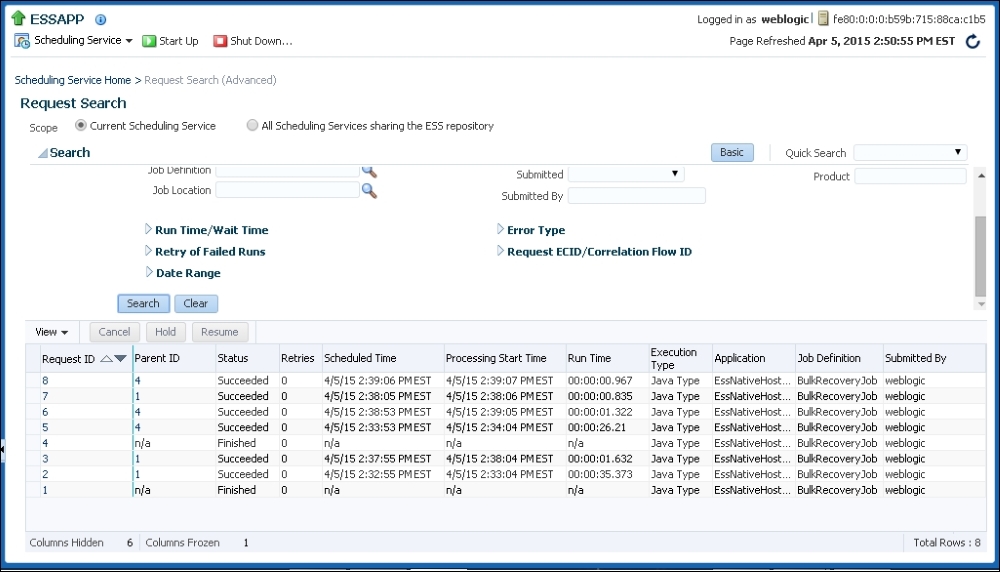
Figure 7.17: ESS Console for viewing Bulk Recovery Jobs
Once the job is completed, checking on the status of the messages that were marked for recovery will show them as Recovered, as shown in Figure 7.18. Click on the link in the Total Faults field to view them on the Flow Instances page. If the fault was recovered successfully, the flow state will show as Completed. This state represents the final state of the instances and not the intermediate states that it assumed during the execution. Intermediate states can be viewed by launching the flow trace by clicking on the Flow ID of one of the messages. The message audit trail shows the state adjusted to Recovered from Recovery Required. Let's have a look at the following screenshot:

Figure 7.18: Recovered instances after a Bulk Recovery Job
Administrators who wish to not use ESS for scheduling fault recoveries can leverage the auto-recovery feature of Oracle SOA Suite 12c. This is, however, only applicable for faults that are encountered in the BPEL engine. The auto-recovery feature is controlled through an MBean property that allows recovery of messages either at the time of restarting the SOA servers or a scheduled recovery during off-peak hours. Messages being recovered can be throttled by limiting the number of messages picked up on each run. Figure 7.19 shows the RecoveryConfig configuration dashboard in System MBean Browser along with the property settings to schedule automatic recovery. The steps to do so are listed here:
- Log in to Oracle Enterprise Manager Fusion Middleware Control.
- Right-click on soa-infra(soa_server1) and navigate to SOA Infrastructure | SOA Administration | BPEL Properties | More BPEL Configuration Properties.
- Click on the
RecoveryConfigMBean.- The
RecurringScheduleConfigMBean allows configuring a time window, preferably non-peak production hours when automatic recovery through retry can be scheduled. - The
maxMessageRaiseSizeproperty controls the number of messages recovered in one go. StartupScheduleConfigon the other hand instructs the engine to recover faulted messages on server startup.- The amount of time allocated by the engine for recovery is determined by
startupRecoveryDuration.
- The
However, it is not always possible to recover everything automatically. Auto-recovery is subject to some conditions. Consider the two scenarios explained here:
- Scenario 1: If the BPEL component uses a fault policy and the fault is handled using the
ora-human-interventionaction, the fault is marked asRecoverableand the instance state is set toRunning. In this scenario, such faults marked asRecoverablecannot be auto-recovered. - Scenario 2: If the fault policy applied to a BPEL component catches a fault and rethrows it using the
ora-rethrow-faultaction, the fault is marked asRecoverableand the instance state set toFaulted, provided the fault is a recoverable one (for example, in the case of a destination system not being available). In this scenario, suchRecoverablefaults can be auto-recovered on server startup and/or prescheduled recovery.
Let's have a look at the following screenshot:

Figure 7.19: Scheduling automatic bulk retries for BPEL engine faults from the RecoveryConfig MBean
Oracle SOA Suite 12c also introduced a new feature allowing administrators to create error notification rules at the SOA infrastructure level or at the individual partition level. Error notification rules can cause alert messages to be triggered when specific fault criteria are met. Alerts can be directed to the Enterprise Manager dashboard and viewed under the Fault Alerts section. Alternatively, communication channels such as e-mail, SMS, or IM can be used for sending notifications. Error notifications provide a very useful means for administrators to create alerts on critical fault conditions that require immediate/proactive monitoring and remediation.
Error notifications can be scheduled. For example, an alert can be sent every day at 7:00 pm if a fault criterion is met. They can also be sent when an error occurs on an individual instance through fault policy actions, or an aggregated notification can be sent for faults occurring at an infrastructure or partition level. The following steps provide an example of how error notification rules can be configured:
- Log in to Oracle Enterprise Manager Fusion Middleware Control.
- Right-click on soa-infra (soa_server1) and navigate to SOA Infrastructure | Error Notification Rules. This will open the Error Notification Rules creation dashboard.
- Click on the Create button to define a new error notification rule. An error notification can be defined by providing information such as the rule metadata (name and description), schedule (frequency), and condition (what criterion caused the trigger).
- As pointed out before, ESS is required to configure an Error Notification Rule. A schedule has to be created beforehand so that it can be selected during error notification rule creation.
- Right-click on soa-infra (soa_server1) and navigate to SOA Infrastructure | Define Schedules.
- The package name for the schedule must be /oracle/apps/ess/custom/soa so that it is accessible on the Error Notification Rule page.
- A schedule can be created by providing information such as the schedule metadata (name, description, and package), frequency, and duration. Refer to the following screenshot:

Figure 7.20: Defining a schedule for an error notification rule
- Once a Schedule is created it can be selected in the dropdown when creating the Error Notification Rule as shown in the following screenshot:

Figure 7.21: Defining a new error notification rule
- By default, newly created error notification rules are set to Enabled. They can be disabled by selecting the alert on the Edit Notification Rules page and clicking on Disable.
- When error notification rule criteria are met, the alert is triggered and displayed in the Fault Alerts section of the SOA Infra dashboard. The frequency with which a rule is invoked is based upon the selected Schedule.