
Infrastructure issues can be related to these problems: starting up the server, the server being unavailable or unresponsive, or transactions failing. It might even be due to errors in backbone resources that your infrastructure is dependent upon. These are all examples of infrastructure problems, and in most of these cases, the logs will guide you to the root of your issue. However, in other cases, the log information may not be sufficient, at which you may have to consider increasing the logger levels to obtain more information.
Chapter 6, Monitoring Oracle SOA Suite 12c, included a section titled Identifying and viewing log file entries, wherein we described how to configure logger levels. For example, you can easily increase a logger from NOTIFICATION:1 (INFO) to TRACE:32 (FINEST) to dump more information into the logs. Regardless of the type of problem (including composite issues), increasing the logger level temporarily may help you obtain more information.
The following screenshot shows top-level logger names and default log levels:

Figure 9.1: The top-level logger names and default log levels
Logger levels can provide more information on pretty much everything. The top-level logger names are shown in Figure 9.1. For example, some of the loggers that can be modified include: DVMs (oracle.soa.dvm), the BPEL engine (oracle.soa.bpel.engine.*), Mediator filters (oracle.soa.mediator.filter), human workflow (oracle.soa.services.workflow.*), Enterprise Manager Console (oracle.sysman), Oracle Web Services Manager (oracle.wsm.*), and Oracle Service Bus (oracle.osb.*). There are too many loggers to mention and there is no comprehensive list that describes each one. However, many are self-descriptive and often Oracle Support can guide you to what you may need to increase during your troubleshooting efforts. The logs themselves can point you to a logger. Observe the logger highlighted in the following code snippet:
<Aug 5, 2014 12:00:02 AM EDT> <Error> <oracle.soa.bpel.engine.dispatch> <BEA-000000> <failed to handle message
javax.ejb.EJBException: EJB Exception: : java.lang.StackOverflowError
Here, the oracle.soa.bpel.engine.dispatch logger threw a StackOverflowError exception. Increasing this specific logger may (or may not) yield additional useful information.
An important thing to keep in mind is that loggers contain hierarchies. Exercise caution when setting root-level loggers to FINE, FINER, or FINEST. Consider the case from the preceding code, where you have encountered an EJB exception in the BPEL engine. If the root logger (that is, oracle.soa.bpel.engine) is set to FINEST, all the descendants that inherit from it will have the same logging level. As a result, a large amount of unused log entries are produced, which might actually make troubleshooting the issue much more difficult. Therefore, if possible, you should set only the corresponding child logger (oracle.soa.bpel.engine.dispatch) to a lower level without enabling the root logger.
You will likely notice a lot of errors in the wls_soa1.out log file. The key is to be able to differentiate between infrastructure errors and composite instance errors. In most cases, it is obvious, though some cases may require further troubleshooting. Here, we describe nine examples of various errors.
StackOverflowError is usually an indication of an infrastructure error, as the error does not appear tied to any specific composite. Based on the oracle.soa.bpel.engine.dispatch logger, it is thrown by the BPEL dispatch engine, as shown in the following example:
<Aug 5, 2015 12:00:02 AM EDT> <Error> <oracle.soa.bpel.engine.dispatch> <BEA-000000> <failed to handle message
javax.ejb.EJBException: EJB Exception: : java.lang.StackOverflowError
For an error like this, when you have little or no information even after you throttle all your loggers to full, it is wise to search My Oracle Support (https://support.oracle.com) or engage Oracle Support.
Here, the Mediator Service Engine (as shown by the oracle.soa.mediator.serviceEngine logger) appears to have thrown SOAPFaultException, which in itself is not very useful. However, the details of the error are quite clear. This is a business exception thrown by an external service or resource. Though there is no information here to tie it back to a specific composite or instance, the same error, in more detail, can be found in the wls_soa1.log file, which will provide the specific information. Rest assured, this exception will also appear in the composite instance fault on the console. Refer to the following log entry:
<Aug 6, 2015 10:10:33 AM EDT> <Error> <oracle.soa.mediator.serviceEngine> <BEA-000000> <Got an exception: oracle.fabric.common.FabricInvocationException: javax.xml.ws.soap.SOAPFaultException: CreateOrder failed with Message: Cannot insert the value NULL into column 'OrderID', table '@Orders'; column does not allow nulls. INSERT fails.
The error is obvious; a table column does not allow NULL and therefore insertion is rejected by the database.
Some infrastructure exceptions are related to the backend components that are unavailable or configured improperly. Some of them may be categorized by a warning instead of an error, but this is still a problem. Refer to the error in the following log entry that appears to be related to a WebLogic JMS Server. In this case, the JMS Server named CustomJMSServer was referencing the persistent file store CustomFileStore that did not exist:
<Aug 25, 2015 7:30:41 PM EST> <Warning> <Management> <BEA-141197> <The deployment of CustomJMSServer failed.weblogic.management.DeploymentException: Internalrror activating the JMS Server CustomJMSServer: weblogic.management.DeploymentException: The persistent store "CustomFileStore" does not existSuch exceptions can be resolved by making sure that the required backbone infrastructure is present. This specific issue is resolved by creating the required file store and restarting the targeted managed servers.
FabricInvocationException is thrown by the Mediator Service Engine. The Unable to access the following endpoint error is somewhat misleading, as it could be related to any number of exceptions:
<Aug 29, 2015 11:45:06 AM EST> <Error> <oracle.soa.mediator.serviceEngine> <BEA-000000> <Got an exception: oracle.fabric.common.FabricInvocationException: Unable to access the following endpoint(s): http://payment-processing-server-dev:7777/proc/servlet/createCustomer
By reviewing the nested exception later on (not shown here), you will find that this particular error was due to a timeout of the external service. Though technically this is not a coding error since it is something that occurred only at runtime, it is not a SOA infrastructure error either, as it is related to an external service on which we have no control. From a development standpoint, the developer should be able to handle these cases by enabling some type of retry and/or error logging. You can also enable more detailed logging for these issues by enabling debugging while starting the server as follows:
-Djavax.net.debug=all
Note
You can also consider increasing the timeout for external services should these errors happen frequently. Refer to Chapter 7, Configuration and Administration, to see how you can do this.
This
Unable to allocate additional threads error appears to be quite serious, but it really is not. However, this is an infrastructure-related issue and should be remedied.
Let's refer to the following log snippet:
<Sep 30, 2015 11:30:04 PM EDT> <Warning> <oracle.integration.platform.instance.store.async> <BEA-000000> <Unable to allocate additional threads, as all the threads [10] are in use. Threads distribution : Fabric Instance Activity = 1,Fabric-Instance-Manager = 9,>
This error is apparently due to a failed transaction that continues to retry. The Oracle WebLogic Server is unable to process more messages in parallel and has run out of threads that would eventually clear themselves. It is possible to increase the number of threads if this becomes a persistent problem.
The following exception is due to the fact that at runtime, the XSD was not available:
java.io.IOException: oracle.mds.exception.MDSException: MDS-00054: The file to be loaded oramds:/apps/Fault/Common/XSD/SalesOrderHeader.xsd does not exist.
This actually could either be a coding error or an infrastructure error. Therefore, further investigation is required. If the soa-mds data source is unavailable, this error would be attributed to an infrastructure problem. If the data source is available though, then it is likely due to the code referring to a resource that does not exist in the MDS.
The following exception is returned in the wls_osb1.log file. From the looks of it, a particular OSB business service is responsible for this error:
####<Aug 16, 2015 10:57:11 AM EDT> <Info> <OSB Kernel> <soahost1> <wls_osb1> <[ACTIVE] ExecuteThread: '1' for queue: 'weblogic.kernel.Default (self-tuning)'> <<anonymous>> <> <c3674305f67d3622:-7bff816b:136a9bbdd80:-8000-0000000000008a10> <1334588231098> <BEA-398102> <
 [OSB Tracing] Exiting route node with fault:
<con:fault xmlns:con="http://www.bea.com/wli/sb/context">
  <con:errorCode>BEA-380000</con:errorCode>
  <con:reason>Request Entity Too Large</con:reason>
  <con:location>
    <con:node>CustomerBusSvc</con:node>
    <con:path>response-pipeline</con:path>
  </con:location>
</con:fault>>
Since this error appears to be specific to a single OSB service, a few online searches reveal the root cause of the Request Entity Too Large error, which is that authentication cannot be handled automatically in chunked mode, and this particular service was using authentication. A simple request to the developer to disable the Use Chunked Streaming Mode setting can remedy this, or the administrator can make this change dynamically at runtime.
By now, you must know that the engine that is responsible for executing composite instances in your infrastructure is soa-infra, which in itself is a J2EE application. The soa-infra application, in some cases, may fail to load in all the managed servers across a cluster and is partially available due to the following exception:
Instantiation of bean failed; nested exception is org.springframework.beans.BeanInstantiationException: Could not instantiate bean class [oracle.integration.platform.blocks.cluster.CoherenceClusterInterfaceImpl]: Constructor threw exception; nested exception is com.tangosol.net.RequestTimeoutException: Timeout during service start: ServiceInfo(Id=0, Name=Cluster, Type=Cluster
The preceding issue is due to the fact that the coherence multicast channel in use by the domain in a clustered mode is overloaded. The coherence cluster address for the domains is set to a unique multicast address and port in the setDomainEnv.sh file. To confirm whether the multicast channel in use is not overloaded, use a simple multicast test by following the steps in the code:
source setAntEnv.sh
export CLASSPATH=${ORACLE_HOME}/wlserver/server/lib/weblogic.jar
java utils.MulticastTest -N [managedServerName] -A [multicastHost] -P [multicastPort] -T 10 –S
The issue can be resolved by untargeting the soa-infra application from all servers in the cluster, bouncing back all managed servers, and retargeting it back to the cluster. This is an infrastructure problem.
Not all errors are directly due to issues within your SOA Infrastructure. All running and completed instances in Oracle SOA Suite 12c are saved in a backend data store. Lack of space in the database may prevent the composite instances to complete their processing. For instance, you are most likely to see the following exception if your database runs out of disk space:
oracle.toplink.exceptions.DatabaseException
Internal Exception: java.sql.BatchUpdateException: ORA-01691: unable to extend lob segment DEV_SOAINFRA.SYS_LOB$$ by 128 in tablespace DEV_SOAINFRA
These messages typically indicate space issues in the database that will likely require you to add more data files or more space to the existing data files. Additionally, completed instances can be purged and disk space can be reclaimed. This is discussed in Chapter 8, Managing the Database. Another useful guide to dealing with databases can be found in Managing Database Growth of the Oracle® Fusion Middleware Administering Oracle SOA Suite and Oracle Business Process Management Suite, which can be found at https://docs.oracle.com/middleware/1213/soasuite/administer/soa-database-growth-manage.htm#SOAAG97257.
We have covered several types of exceptions that can be encountered to give you an idea of the types of errors that you might expect. It is impossible to provide a comprehensive list of errors, and our intent is to show you why we have classified some errors as infrastructure errors and others as instance errors. Most of the time, the type of error is obvious, but other times, it is not. Differentiating between both helps you narrow your troubleshooting efforts to a particular area.
The following figure shows a warning on AdminServer. Warnings do not necessarily mean that the managed server is unresponsive, but is an indication for us to look into the root cause(s) of the warning.
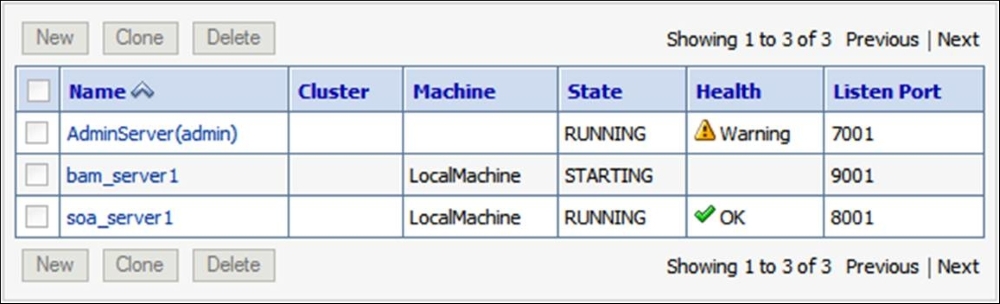
Figure 9.2: A managed server warning in the Oracle WebLogic Server Administration Console
Without understanding that the health of a managed server in a Warning state is usually related to stuck threads, you won't know that you need to click on AdminServer and navigate to Monitoring | Threads to get more information.
The following screenshot illustrates how to monitor the threads of a managed server:

Figure 9.3: Monitoring the threads of a managed server
Under Self-Tuning Thread Pool in Figure 9.3, we see a warning, which is likely due to the Hogging Thread Count being greater than 0. In the Self-Tuning Thread Pool Threads table immediately under it, we are able to see the stuck thread, indicated by [STUCK] ExecuteThread: '0' for queue: 'weblogic.kernel.Default (self-tuning)'. All we can ascertain from this error is that ExecuteThread '0' is the stuck thread, yet this is still not enough information.
Looking at the ${DOMAIN_HOME}/servers/AdminServer/logs/AdminServer.log file, we can see the stuck thread, which apparently had kept on working for over 10 minutes:
####<Mar 23, 2015 6:03:49 PM EST> <Error> <WebLogicServer> <soahost1> <AdminServer> <[ACTIVE] ExecuteThread: '8' for queue: 'weblogic.kernel.Default (self-tuning)'> <<WLS Kernel>> <> <cb680017c6a0acfe:-606797c4:134357968da:-8000-0000000000001062> <1324681429443> <BEA-000337> <[STUCK] ExecuteThread: '0' for queue: 'weblogic.kernel.Default (self-tuning)' has been busy for "658" seconds working on the request "weblogic.kernel.WorkManagerWrapper$1@2a8605ce", which is more than the configured time (StuckThreadMaxTime) of "600" seconds.
It turns out that we had just tried to unsuccessfully start the BAM managed server 10 minutes earlier. By observing ${DOMAIN_HOME}/servers/wls_bam1/logs/wls_bam1.log, we find that the same ExecuteThread '0' thread is unable to register MBean due to an java.lang.OutOfMemoryError exception:
####<Mar 23, 2015 5:53:36 PM EST> <Error> <JMX> <soahost1> <bam_server1> <[ACTIVE] ExecuteThread: '0' for queue: 'weblogic.kernel.Default (self-tuning)'> <<WLS Kernel>> <> <> <1324680816405> <BEA-149500> <An exception occurred while registering the MBean com.bea:Name=AdminServer,Type=WebServiceRequestBufferingQueue,WebServiceBuffering=AdminServer,Server=AdminServer,WebService=AdminServer.
java.lang.OutOfMemoryError: PermGen space
Fortunately, looking back at the AdminServer.log file a few hours later, we see that ExecuteThread '0' has become unstuck:
####<Mar 23, 2015 10:42:42 PM EST> <Info> <WebLogicServer> <soahost1> <AdminServer> <[STUCK] ExecuteThread: '0' for queue: 'weblogic.kernel.Default (self-tuning)'> <<WLS Kernel>> <> <cb680017c6a0acfe:-606797c4:134357968da:-8000-0000000000001070> <1324698162702> <BEA-000339> <[STUCK] ExecuteThread: '0' for queue: 'weblogic.kernel.Default (self-tuning)' has become "unstuck".>
In this example, we navigated to multiple areas, starting from the stuck thread, to get to the root cause of the warning on the health state of AdminServer. To recap, we performed the following:
- We found AdminServer to be in a Warning state, which is usually due to a stuck thread
- We confirmed that there was indeed a stuck ExecuteThread thread, as shown on both the Oracle WebLogic Administration Console and the
AdminServer.logfile - By reviewing the
wls_soa1.logandwls_bam1.logfiles, we found startup errors in the BAM server log - The BAM server was unable to register an AdminServer MBean due to a
java.lang.OutOfMemoryErrorexception that was thrown - Eventually, the stuck thread was able to self-tune and unstuck itself
No action was needed in this scenario, but by inspecting the log files, we identified the root cause. Also, keep in mind that stuck threads can happen during regular executions of various applications and aren't inherently bad, but they do have the potential to locate inefficiencies.