
If every customer paid everything they were billed for in a timely fashion, this module would be called Customer Receipts. The reality is that this is far from the case; hence, the name Receivables Management (RM).
This module in Microsoft Dynamics GP can do so much for you: using features in RM and these BI tools will help you make decisions about when to push collections, discontinue service, and show a good customer more attention.
What we will build:
- Sharable aged trial balance
- Customer sales this year compared to last year
All organizations, whether for-profit or nonprofit, have two important things to manage: money going out and coming in. Managing what is owed to you is not only critical to the success of your company, but it's also critical for you to receive your paycheck! Keeping track of what is owed and when it is owed, is what the aged trial balance is all about. The report we'll build is all about creating an aged trial balance in a format that will help all involved, with customers and the management of the checkbook, to know where the accounts receivables stand. This is a favorite auditor request and it can be challenging to get it into Excel using the native GP report.
This report is for a company that wanted to make a non-GP user responsible for collection calls, keeping the notes in their CRM system. Rather than purchase an additional license, this refreshable report was built.
It's difficult to set up GP so that the aged trial balance can print in a format that is an easy to read and layout for an Excel worksheet.
Our goal is to share Excel reports with those who do not have access to GP. Secondarily, we want to create reports that can be refreshed in Excel without having to export from GP SmartList each time.
There are two parts to these steps. The first part is technical, containing steps that involve work in SQL Server. The second part is the actual building of the report. You may choose to obtain assistance with the technical part, especially if you do not have access to SQL Server.
Create the following view in SQL Server:
CREATE VIEW view_BI_RM_TRX AS
SELECT 	CT.CUSTNMBR AS [Customer ID],
CM.CUSTNAME AS Customer,
CM.HOLD AS [Customer Hold],
CM.CUSTCLAS AS [Customer Class ID],
CM.CNTCPRSN AS Contact,
CM.PHONE1 AS Phone, CASE CT.RMDTYPALWHEN 1 THEN 'Invoice' WHEN 2 THEN 'Scheduled Payment'
    WHEN 3 THEN 'Debit Memo'
    WHEN 4 THEN 'Finance Charge'
    WHEN 5 THEN 'Service Repair'
    WHEN 6 THEN 'Warranty'
    WHEN 7 THEN 'Credit Memo'
    WHEN 8 THEN 'Return'
    WHEN 9 THEN 'Payment'
    ELSE 'Other'
    END AS [Document Type],
CT.DOCNUMBR AS [Document Number],
CT.DOCDATE AS [Document Date],
CASE
WHEN (CT.RMDTYPAL < 7) THEN CT.DUEDATE
ELSE CT.DOCDATE
END AS [Due Date],
CT.GLPOSTDT AS [GL Date],
CT.POSTDATE AS [Posted On],
CT.PSTUSRID AS [Posted By],
CASE
WHEN (CT.RMDTYPAL < 7) THEN CT.ORTRXAMT
ELSE - CT.ORTRXAMT
    END AS [Document Amount],
CASE
WHEN (CT.RMDTYPAL < 7) THEN CT.CURTRXAM
ELSE - CT.CURTRXAM
END AS [Unapplied Amount],
CASE
WHEN (CT.RMDTYPAL < 7) THEN CT.SLSAMNT
ELSE - CT.SLSAMNT
END AS [Sales Amount],
CASE
WHEN (CT.RMDTYPAL < 7) THEN CT.COSTAMNT
ELSE - CT.COSTAMNT
END AS [Cost of Goods Sold],
CT.SLSAMNT - CT.COSTAMNT AS [Gross Margin],
- CT.WROFAMNT AS [Writeoff Amount],
CT.TRXDSCRN AS [Transaction Description],
CT.SLPRSNID AS [Salesperson ID],
CT.SLSTERCD AS [Sales Terrritory],
CT.DINVPDOF AS [Date Paid Off],
CM.PYMTRMID AS [Payment Terms],
CASE CM.CRLMTTYP
    WHEN 0 THEN 'No Credit'
    WHEN 1 THEN 'Unlimited'
    WHEN 2 THEN 'Amount'
    ELSE 'Unknown'
    END AS [Credit Limit Type],
CM.CRLMTAMT AS [Credit Limit Amount],
YEAR(CT.DOCDATE) AS YEAR,
MONTH(CT.DOCDATE) AS MONTH
FROM dbo.RM00101 AS CM
INNER JOIN dbo.RM20101 AS CT ON CM.CUSTNMBR = CT.CUSTNMBR
WHERE (CT.VOIDSTTS = 0)

UNION

SELECT 	CT.CUSTNMBR AS [Customer ID],
CM.CUSTNAME AS Customer,
CM.HOLD AS [Customer Hold],
CM.CUSTCLAS AS [Customer Class ID],
CM.CNTCPRSN AS Contact,
CM.PHONE1 AS Phone,
CASE CT.RMDTYPAL
WHEN 1 THEN 'Invoice'
WHEN 2 THEN 'Scheduled Payment'
WHEN 3 THEN 'Debit Memo'
WHEN 4 THEN 'Finance Charge'
WHEN 5 THEN 'Service Repair'
WHEN 6 THEN 'Warranty'
WHEN 7 THEN 'Credit Memo'
WHEN 8 THEN 'Return'
WHEN 9 THEN 'Payment'
ELSE 'Other'
END AS [Document Type],
CT.DOCNUMBR AS [Document Number],
CT.DOCDATE AS [Document Date],
CASE
WHEN (CT.RMDTYPAL < 7) THEN CT.DUEDATE
ELSE CT.DOCDATE
END AS [Due Date],
CT.GLPOSTDT AS [GL Date],
CT.POSTDATE AS [Posted On],
CT.PSTUSRID AS [Posted By],
CASE
WHEN (CT.RMDTYPAL < 7) THEN CT.ORTRXAMT
ELSE - CT.ORTRXAMT
END AS [Document Amount],
CASE
WHEN (CT.RMDTYPAL < 7) THEN CT.CURTRXAM
ELSE - CT.CURTRXAM
END AS [Unapplied Amount],
CASE
WHEN (CT.RMDTYPAL < 7) THEN CT.SLSAMNT
ELSE - CT.SLSAMNT
END AS [Sales Amount],
CASE
WHEN (CT.RMDTYPAL < 7) THEN CT.COSTAMNT
ELSE - CT.COSTAMNT
END AS [Cost of Goods Sold],
CT.SLSAMNT - CT.COSTAMNT AS [Gross Margin],
- CT.WROFAMNT AS [Writeoff Amount],
CT.TRXDSCRN AS [Transaction Description],
CT.SLPRSNID AS [Salesperson ID],
CT.SLSTERCD AS [Sales Terrritory],
CT.DINVPDOF AS [Date Paid Off],
CM.PYMTRMID AS [Payment Terms],
CASE CM.CRLMTTYP
WHEN 0 THEN 'No Credit'
WHEN 1 THEN 'Unlimited'
WHEN 2 THEN 'Amount'
ELSE 'Unknown'
END AS [Credit Limit Type],
CM.CRLMTAMT AS [Credit Limit Amount],
YEAR(CT.DOCDATE) AS YEAR,
MONTH(CT.DOCDATE) AS MONTH
FROM dbo.RM00101 AS CM
INNER JOIN dbo.RM30101 AS CT ON CM.CUSTNMBR = CT.CUSTNMBR
WHERE (CT.VOIDSTTS = 0)
GO

GRANT SELECT ON view_BI_RM_TRX TO DYNGRP
Tip
Review the technical steps for the first report in Chapter 2, Business Intelligence for the General Ledger, for details on how to create a view.
With the SQL Server part completed in the previous section, let's build a report!
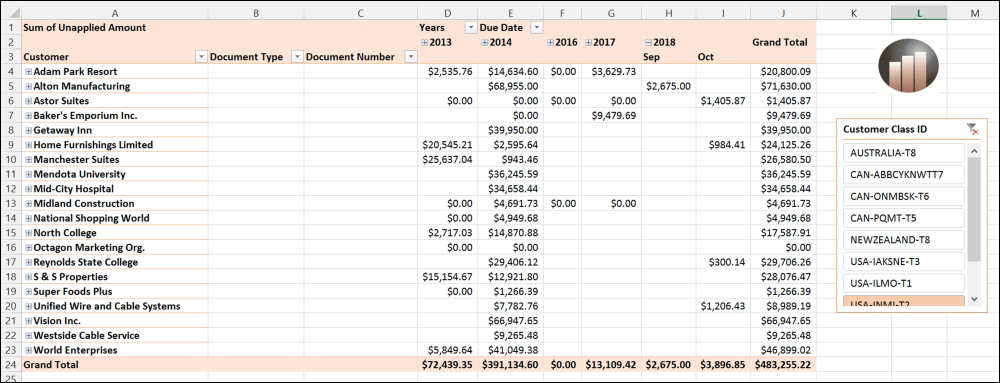
Know what you want. We've already figured that out and have provided a screenshot of an example here:
Tip
As always, we must know what we want our end result to look like before we start. Draw it on a paper or perform a mock-up in Excel. Starting with the end in mind will save you many, many hours of time. We'll say this over and over again because it's that important! The preceding screenshot shows how we want our report to look like.
Let's make a connection to the GP data:
- Open a blank workbook in Excel and, from the menu bar, choose Data. In the Get External Data portion of the ribbon, choose From Other Sources. Then, choose From SQL Server as the source.
- Enter your Server name and your network or AD login credentials. Then, click on Next.
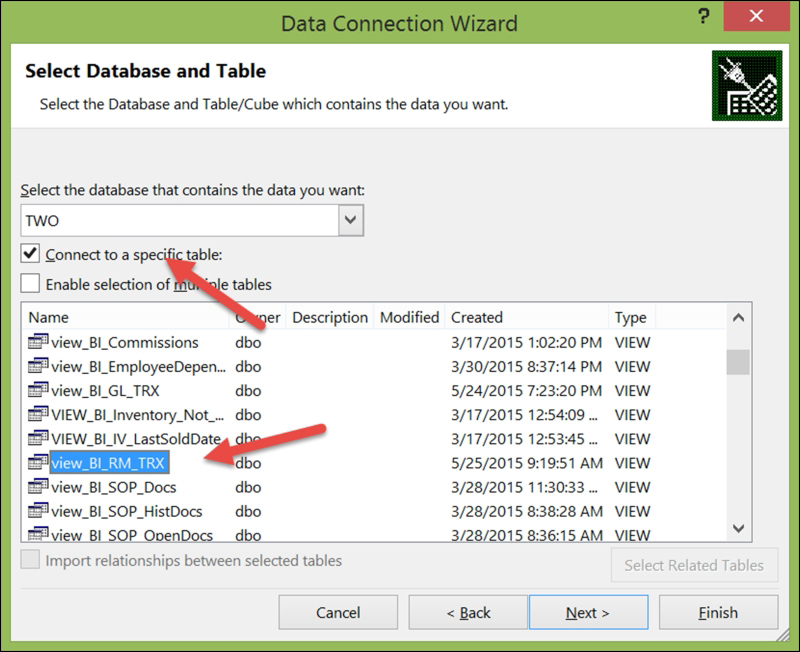
- Select your database from the drop-down list. Please note that the views (in this window in Excel) display in alphabetical order, followed by tables in alphabetical order; so a view that starts with view will appear before a table that starts with A. Now, select view_BI_RM_trx and click on Finish.
Let's build the first PivotTable report:
- On the Import Data window, select PivotTable Report. Make sure that you are putting the data in the Existing worksheet option in the =$A$1 cell. Then, click on OK.
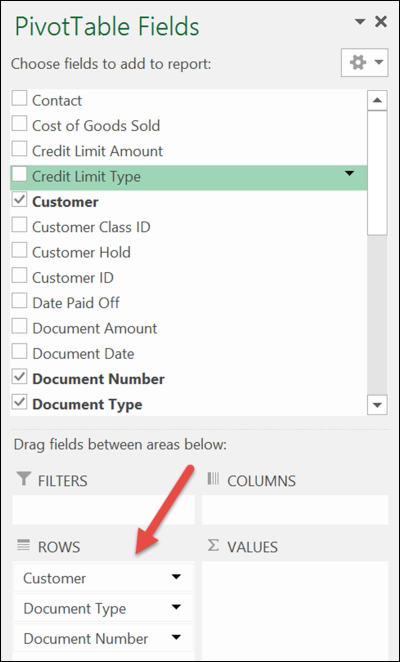
- The PivotTable canvas will appear. In the PivotTable Fields list on the right-hand side, drag the following Customer, Document Type, and Document Number fields down to the ROWS area:.
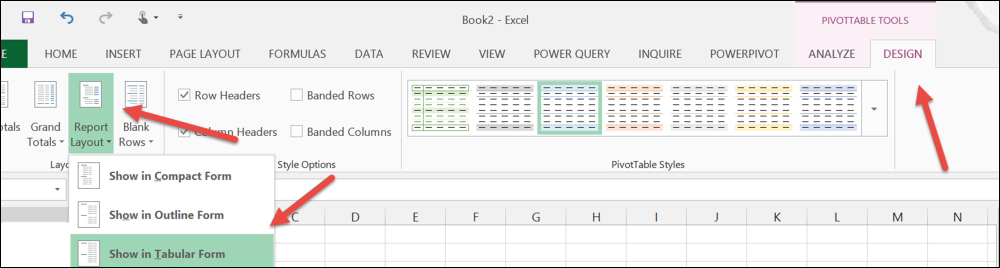
- Click anywhere on the PivotTable and new menu options will appear called PIVOTTABLE TOOLS. On the DESIGN tab, under PIVOTTABLE TOOLS, choose Report Layout in the Layout section of the ribbon. Now, select Show in Tabular Form:
- Click anywhere on the PivotTable and new menu options will appear called PIVOTTABLE TOOLS. On the DESIGN tab, under PIVOTTABLE TOOLS, choose Subtotals in the Layout section of the ribbon. Now, select Do Not Show Subtotals:

- In the PivotTable Fields list, drag UnappliedAmount to the VALUES area.
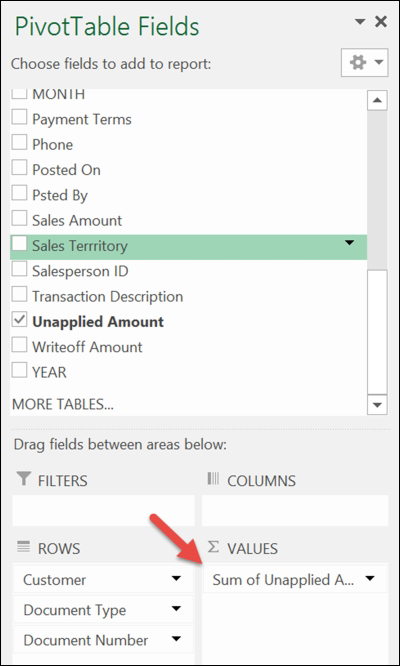
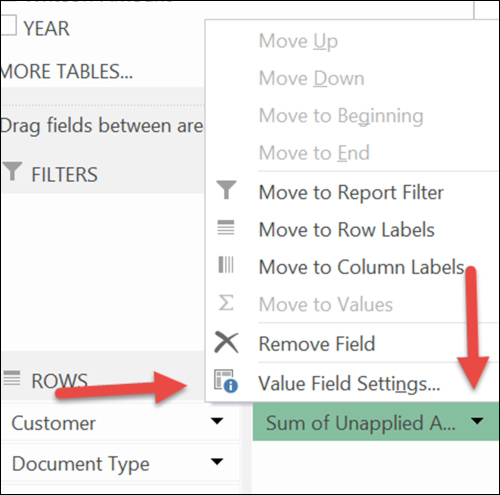
- In the PivotTable Fields list, in the VALUES area, click on the drop-down list for the Sum of Unapplied Amount field. Now, select Value Field Settings:
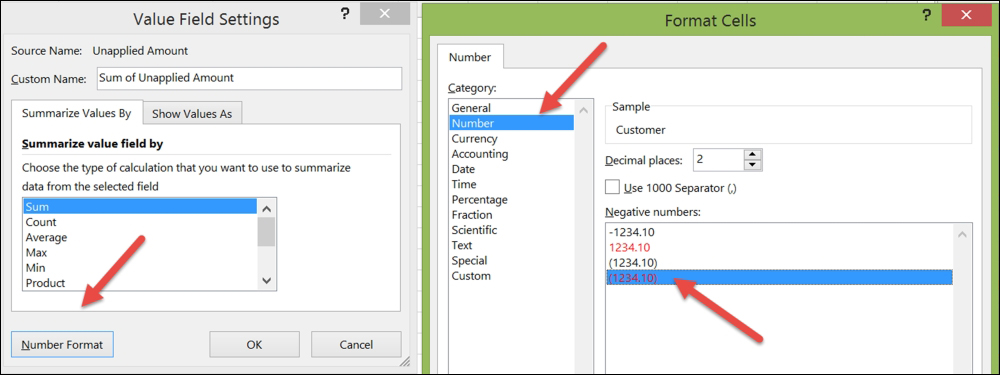
- In the Value Field Settings window that opens, make sure that Sum is selected as the Summarize value field by option. Click on Number Format and the Format Cells window will open. Change Category to Currency. Select how you would like your payments and credits to display, and then click on OK for each window to close:
Let's add slicers and filters.
Adding slicers will allow us to easily see various versions of the data with just a couple of mouse clicks:
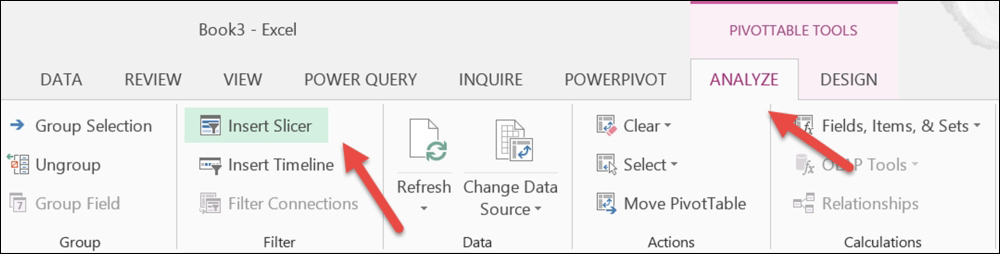
- Click anywhere on the PivotTable and new menu options will appear called PIVOTTABLE TOOLS. On the ANALYZE tab, under PIVOTTABLE TOOLS, choose Insert Slicer in the Filter section of the ribbon:
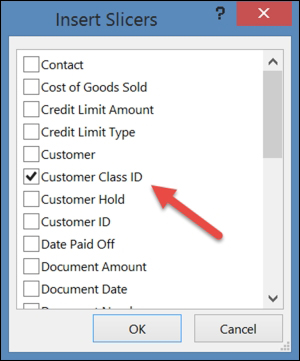
- In the Insert Slicer window, select the check box for the Customer Class ID. Then, click on OK:
- Arrange and resize the slicer according to where and how it should appear.
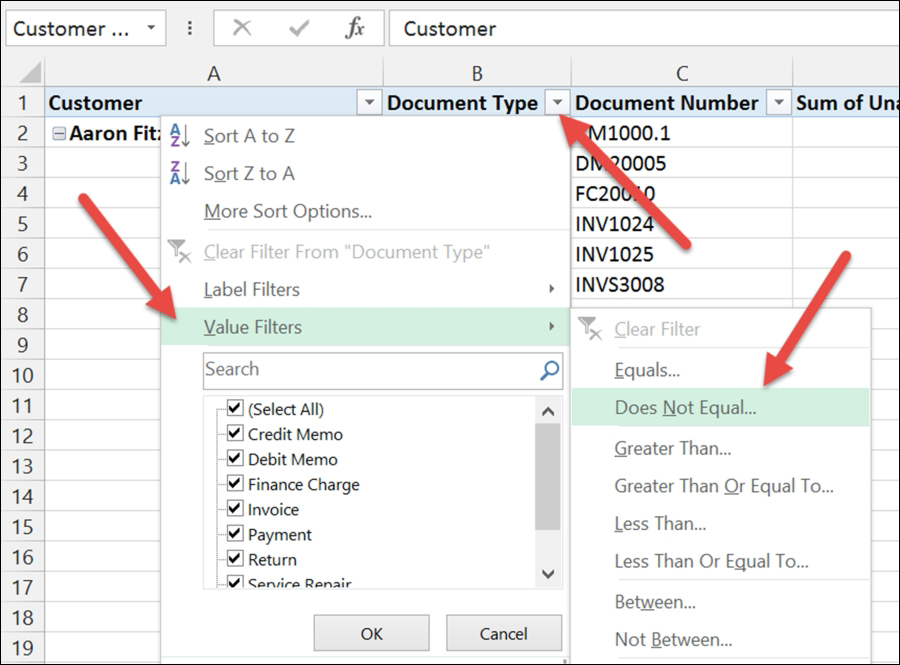
- On the PivotTable, choose the drop-down list for Document Type. Select Value Filters and then Does Not Equal:
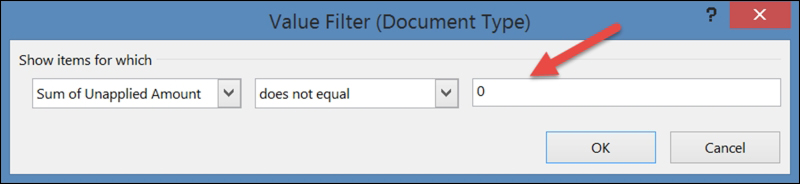
- In the Value Filter (Document Type) window, make sure you set the Sum of Unapplied Amount to does not equal 0. This will remove any document that no longer has a balance in accounts receivable:
Using the report:
- You can now collapse Document Type (for summarizing by type) by clicking on the - symbol, next to Document Type. You can also summarize the entire Customer by clicking on the - symbol, next to Customer Name:
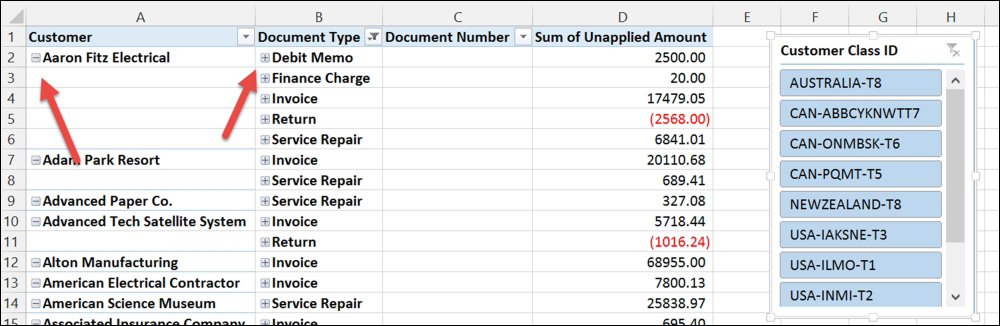
- You can also collapse all items at once by selecting a Customer or Document Type. Then, right-click and select Expand/Collapse | Collapse Entire Field:

This allows a single report to appear either by summary or detail.
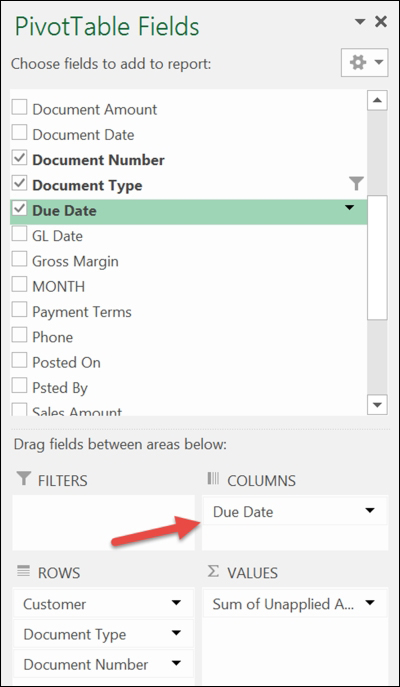
- In the PivotTable Fields list, drag the Due Date field to the COLUMNS section:
- Click on any date in the column header; on the ANALYZE tab, under PIVOTTABLE TOOLS, select Group Field in the Group section of the ribbon:
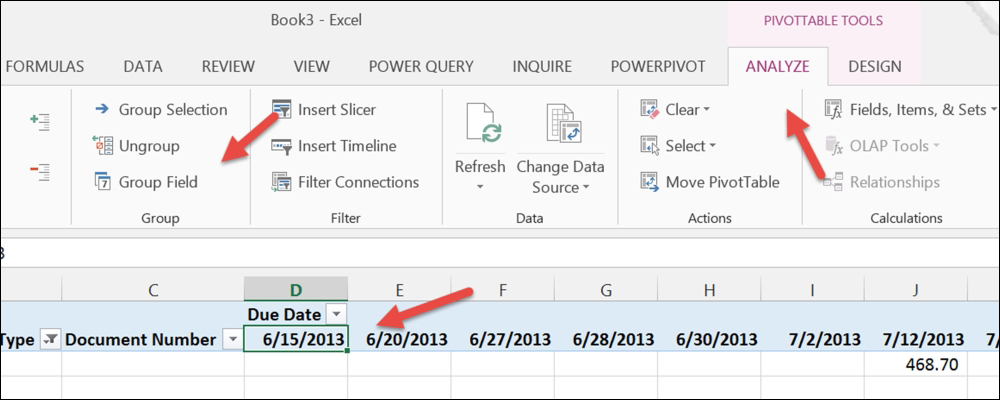
- In the Grouping window, select both Months and Years (click to both select and unselect; all selected items will be highlighted). Then, click on OK:

- Add a logo and any text you like. To refresh the data from GP, click on Refresh All, under the Data tab.
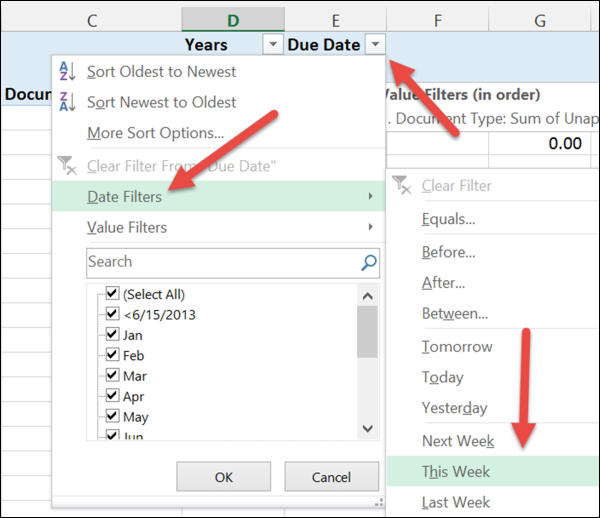
- If you skip the date Group Field steps above, you can then click on the drop-down filter for Due Date and select Date Filters. This will allow you to filter the report only to items that are due in a certain period. We'll choose This Week in our example:
Now, this report is one that shows all outstanding accounts that are due this week:
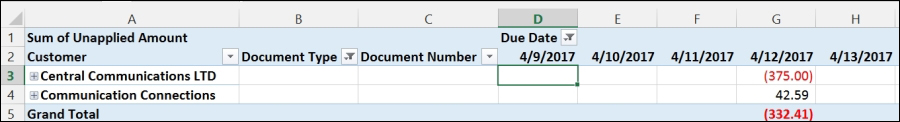
We now have the capacity to review the receivables in a variety of methods, all within a single report. We are able to see what we expect to collect this month, this week, next quarter, and so on. We can look at the customer balance in the summary, or see the details of the balance. We can also use filters and slices to see only customers in a certain class, or customers that belong to a certain salesperson.