
This chapter is all about creating reports to make managing sales orders easier. Rather than focusing on how much we sold or how much we made, we're going to focus on the managing of orders for fulfilment, shipment, and any other operating process required or utilized as part of your Sales Order Processing (SOP) operating procedures.
In the previous chapter, we spent time reviewing both posted and unposted transactions. We looked at sales by item class, salesperson, state, and even a custom category field. As important as monitoring sales is, equally important to a successful distribution company is managing the steps of the sales… the life cycle, if you will. How does it get from a quote to an invoice, are all the steps being followed, are the steps occurring in a timely fashion, and will the customer be satisfied with the speed at which these steps are occurring? Hopefully, these BI tools will help you answer these and other questions.
What we will build:
- SOP documents on process holds
- Items shipped within the last 30 days with tracking numbers
- Returned items report
The process holds are sort of a lightweight version of workflow that has been around long before workflow was cool. These holds can be placed on SOP documents to prevent certain events or processes from occurring. These events include transferring a document, posting, fulfilling, printing, and advanced fulfillment workflow statuses.
This report is for a distribution company that uses SOP process holds to identify documents that are ready to be fulfilled. This company owns the inventory until it reaches their customer's location. To manage this inventory, they use a site ID for items "in transit to customer". When an order is entered, the warehouse site the inventory leaves from is used. When the item is shipped, it is transferred from the warehouse site to the "in transit to customer" site. The process hold is employed to remind the users that the site for all line items needs to be changed to the "in transit to customer" site. The order is transferred to an invoice when the items are shipped and emailed. The invoice is then posted when the customer is in receipt of the goods. Although this is a tedious process, the volume of invoices is low (fortunately for the company, the dollar value is high!).
Although the native GP window for inquiry on process holds is very good, it lacks the ability to narrow down by batch ID, requested ship date, or look at multiple holds at one time. This company needed to be able to see everything and/or a narrowed down set of holds.
We will be using the table feature of Excel, since this is the type of content that would need to be refreshed regularly and can have ad hoc analysis applied to it.
There are two parts to these steps. The first part is technical, containing steps that involve work in SQL Server. The second part is the actual building of the report. You may choose to obtain assistance with the technical part, especially if you do not have access to SQL Server.
Create the following view in SQL Server:
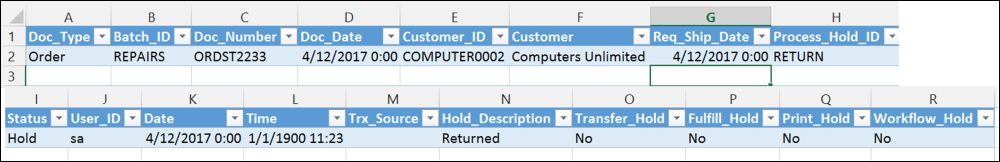
CREATE VIEW view_BI_SOP_Sales_Process AS
SELECT CASE SH.soptype
 WHEN 3 THEN 'Invoice'
 WHEN 4 THEN 'Return'
 WHEN 1 THEN 'Quote'
 WHEN 2 THEN 'Order'
 WHEN 5 THEN 'Backorder'
 WHEN 6 THEN 'Fulfillment_Order'
 ELSE 'Other'
 END AS Doc_Type,
 SH.BACHNUMB AS Batch_ID,
 SH.SOPNUMBE AS Doc_Number,
 SH.DOCDATE AS Doc_Date,
 SH.CUSTNMBR AS Customer_ID,
 SH.CUSTNAME AS Customer,
 SH.ReqShipDate AS Req_Ship_Date,
 SP.PRCHLDID AS Process_Hold_ID,
 CASE SP.DELETE1
 WHEN '0' THEN 'Hold'
 ELSE 'Removed'
 END AS Status,
 SP.USERID AS User_ID,
 SP.HOLDDATE AS Date,
 SP.TIME1 AS Time,
 SP.TRXSORCE AS Trx_Source,
 PM.DSCRIPTN AS Hold_Description,
 CASE PM.XFERPHOL
 WHEN 1 THEN 'Yes'
 ELSE 'No'
 END AS Transfer_Hold,
 CASE PM.FUFIPHOL
 WHEN '1' THEN 'Yes'
 ELSE 'No'
 END AS Fulfill_Hold,
 CASE PM.PRINPHOL
 WHEN '1' THEN 'Yes'
 ELSE 'No'
 END AS Print_Hold,
 CASE PM.WORKFLOWHOLD
 WHEN '1' THEN 'Yes'
 ELSE 'No'
 END AS Workflow_Hold
FROM dbo.SOP10100 AS SH
INNER JOIN dbo.SOP10104 AS SP ON SH.SOPTYPE = SP.SOPTYPE
AND SH.SOPNUMBE = SP.SOPNUMBE
INNER JOIN dbo.SOP00100 AS PM ON SP.PRCHLDID = PM.PRCHLDID
WHERE (CASE SP.DELETE1 WHEN '0' THEN 'Hold' ELSE 'Removed' END = 'Hold')
GO
GRANT SELECT ON view_BI_SOP_Sales_Process TO DYNGRP
Let's build a report!
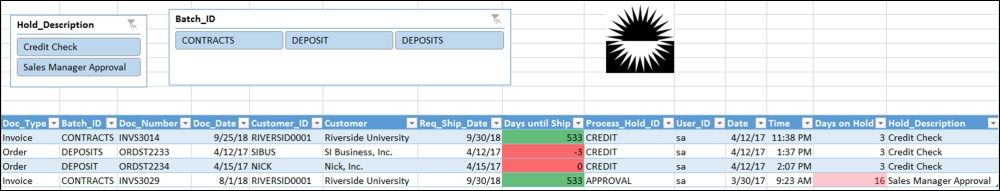
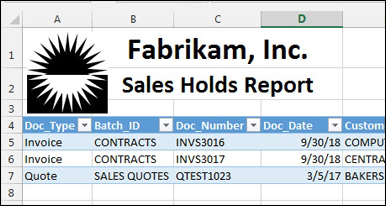
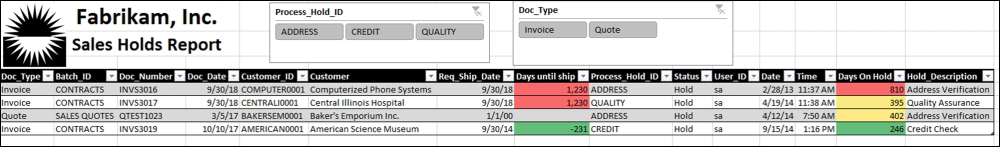
Know what you want to save you time and define your requirements. Here is our mock-up. We want a report that lists all active or pending holds only, and then we can narrow it down to specific holds that we want to view:
Let's make a connection to the GP data:
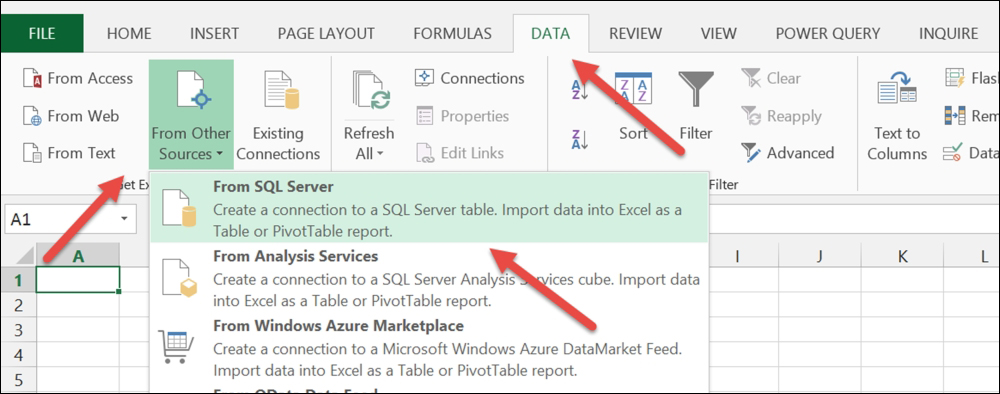
- Let's start by opening up Microsoft Excel 2013. Choose DATA from the menu, and then From Other Sources from the ribbon; finally, choose From SQL Server from the drop-down menu:
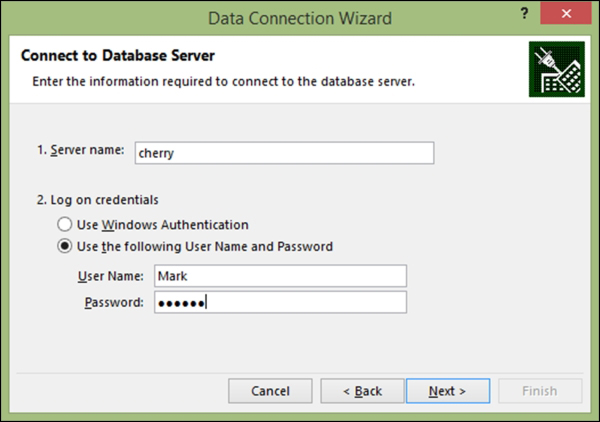
- Enter your Server name; click on Use the following User Name and Password and enter your network or AD login and password. Then, click on Next:
- In the Select the database that contains the data you want drop-down list, select your company database. At the bottom, scroll down until you find the view we just created called view_BI_SOP_Sales_Process, and click on Finish:

Let's build the table report:
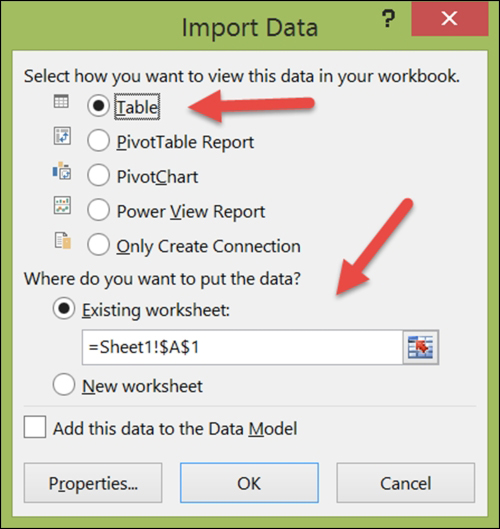
- In the Import Data window, make sure the Table default is selected and that the Where do you want to put the data? selection is set to Existing worksheet: in the =$A$1 cell. This will ensure that the top will be placed in the top-left corner of your existing Excel worksheet. Then, click on OK:
- A table will appear that contains all Open or Pending holds from SOP documents:
- To refresh the data from GP, simply click on DATA from the menu bar, and select Refresh All from the Connections area of the ribbon.
- Save your Excel file to a location of your choice.
- First, let's clean up our date fields. Either select one column at a time, or multiselect all three date columns (Doc_Date, Req_Ship_Date, and Date). Right-click and select Format Cells… from the pop-up list.
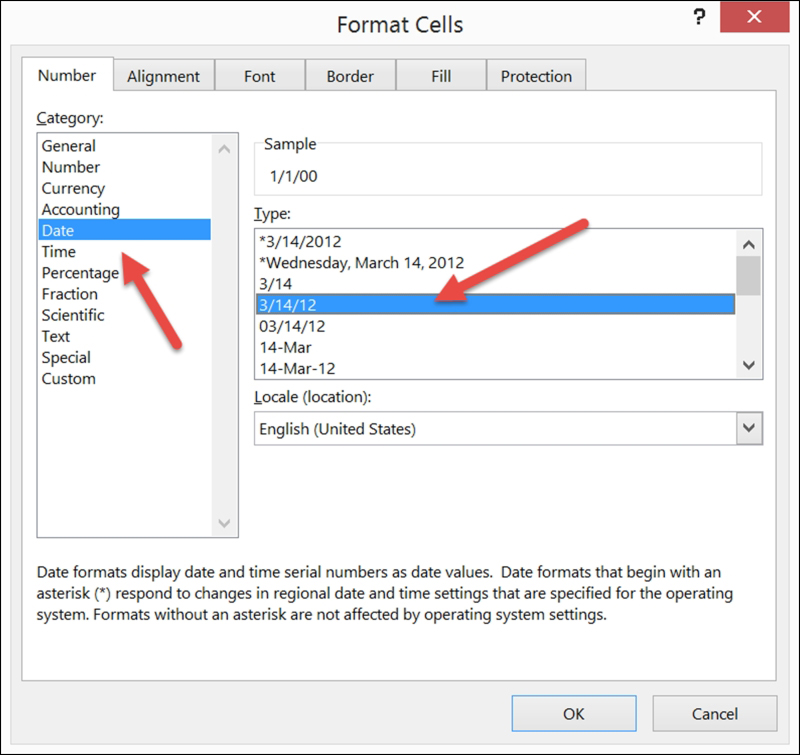
- In the Format Cells window, select Date from the Category list, and then select the format Type you prefer. Then, click on OK:
- Next, let's clean up the Time column. A few fields are time stamped in GP. Fortunately, the time a hold is assigned is recorded; so we can see not only the date, but the time as well. Although dates in SQL Server record both date and time, process holds track the date in one field and the time in another. Both will initially display in Excel as Date Time, so we must format the time field to show just the time.
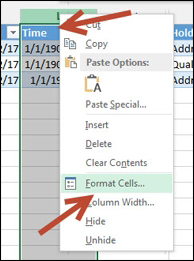
Right-click on the Time column and select Format Cells from the pop-up list:
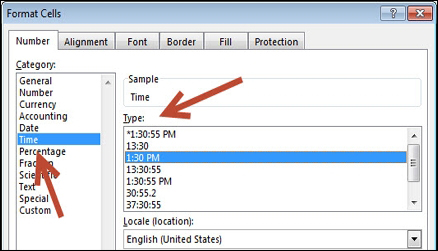
- In the Format Cells window, select Time from the Category list, and then select the format Type that you prefer. Then, click on OK:
- On our report, we do not care to see what kind of hold exists; we are only interested in reviewing which documents are on which holds. We'll delete the last four columns that display what the hold prevents. These columns are Transfer_Hold, Fulfill_Hold, Print_Hold, and Workflow_Hold.
- Delete the Trx_Source column as well. We're not even sure what this field is used for. It was in the SQL database, we thought it might hold something important eventually (although we haven't ever seen it used), so we added it. Better safe than sorry!
- Between the last two columns, Time and Hold_Description, let's add a column that displays the number of days this document has been assigned this hold. Right-click on the last column and choose Insert from the pop-up list.
Label the new column Days on Hold.
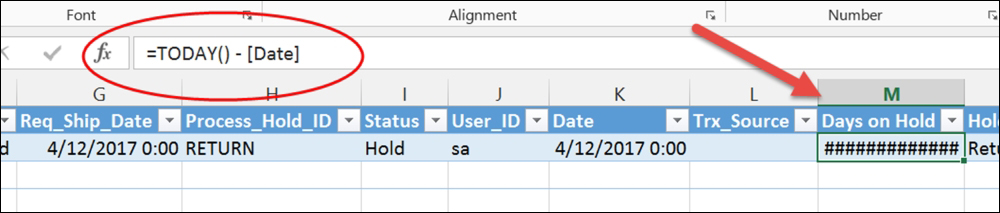
- Click in the first blank row of this new column (for us, it is row 2, column M) and enter the following formula:
=TODAY() - [Date]
Since this is an Excel table, the formula will automatically copy down the column for all rows, and for any new ones that are added when refreshing.
This formula represents whatever today's date is minus the date the document had a hold assigned to it, displaying how many days it has been on hold:
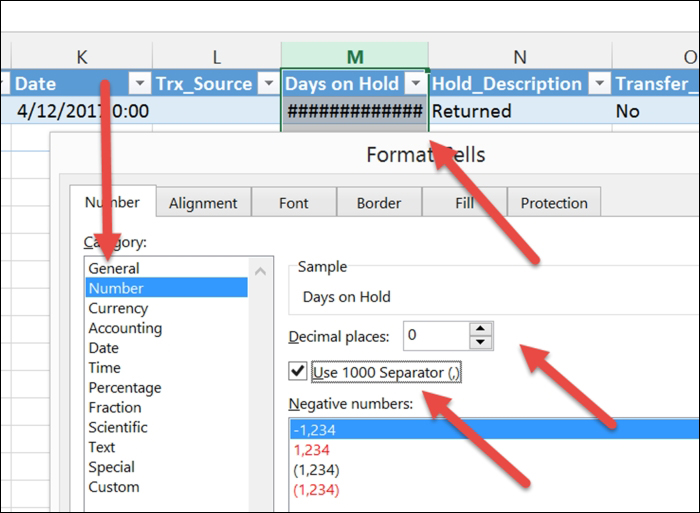
- The new column picks up the format of adjacent cells, so we'll need to reformat it. Right-click on the column, select Format Cells, and choose the Category as Number, and set the decimal places to zero. We will also like to add a 1000 separator (,):
- Let's add a similar column, counting the days until the requested ship date:
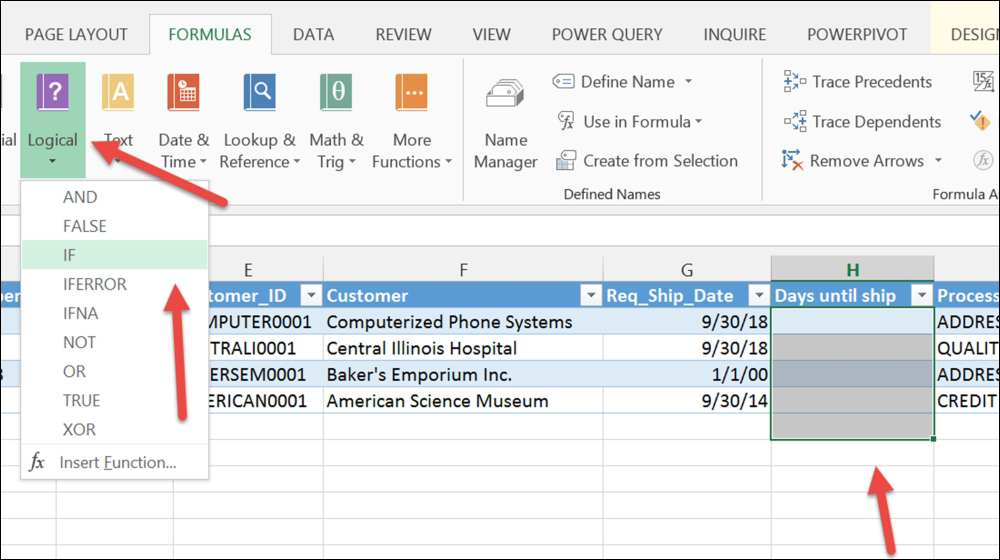
Add a column right after the Req_Ship_Date column (for us, it will be column H). Name the column Days until ship.
- Click on the first blank row of this new column. For us, it is row 2, column H. From the menu bar, select FORMULAS. From the Function Library area of the ribbon, select Logical. From the drop-down menu, select IF:
- On the Logical_test line enter: [@[Doc_Type]] = "Quote".
- On the Value_if_true line enter: " ".
- On the Value_if_false line enter: [Req_Ship_Date] - TODAY():
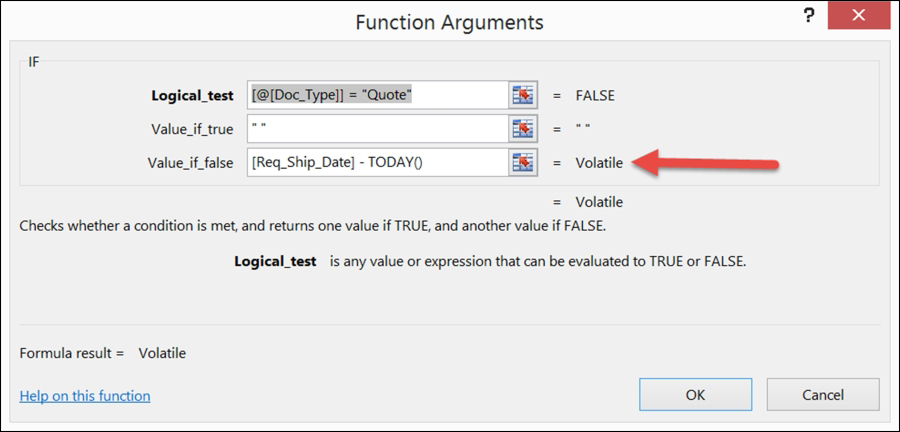
- Your screen will look like the preceding screenshot. Note that you are warned that your formula results are Volatile. This is because the formula for today's date is used. The volatile part is that today might be January 1 and tomorrow January 2, meaning the results can change. This is normal and is correct. The alternative is hardcoding the date and having to manually change it each time.
- Click on OK.
- Again, since this is an Excel table, the formula will copy down the column for all rows, and for any new ones that are added when refreshing.
Format the column as a number with zero decimal places, as we did on the Days on Hold column previously.
Let's add some formatting and filters:
- Let's insert just a few blank lines above the table to insert our logo, a report name, and other items.
- Add your logo by choosing INSERT from the menu, and Pictures from the Illustrations area of the ribbon. Select your picture and insert.
Type your company name, if you like. We've added a logo, company name, and report name:
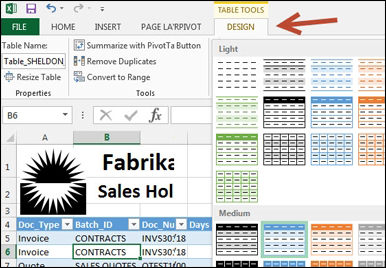
One more aesthetic: let's change the table colors to match our logo colors of black and white:
- Click anywhere on the table and a new menu option will appear called TABLE TOOLS. This menu option will have a tab called DESIGN.
- On the right-hand side of this ribbon, in the Table Styles area, select a color combination that matches your logo:
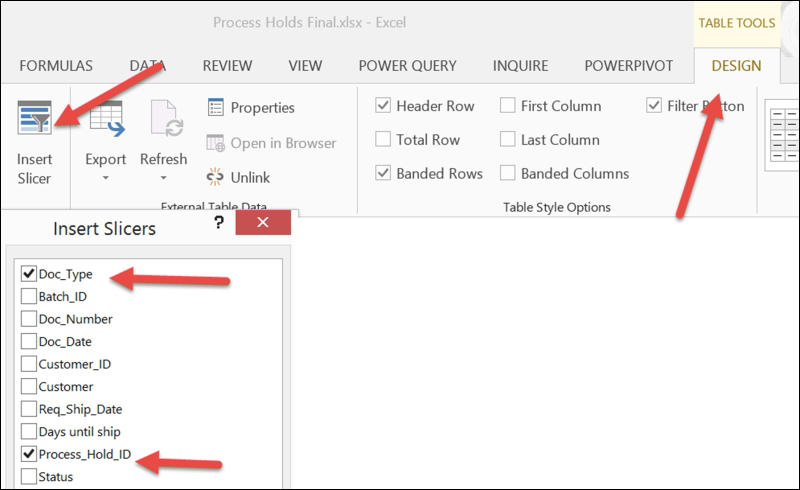
Let's add slicers, so we can easily see various versions of the data with just a couple of mouse clicks.
- Click anywhere on the table, and then from the DESIGN tab, under TABLE TOOLS, select Insert Slicer from the Tools area of the ribbon.
- From the Insert Slicers window, select both Doc_Type and Process_Hold_ID. Then, click on OK:
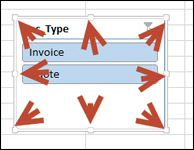
- Resize the slicers using the handles, and move to the top blank lines:
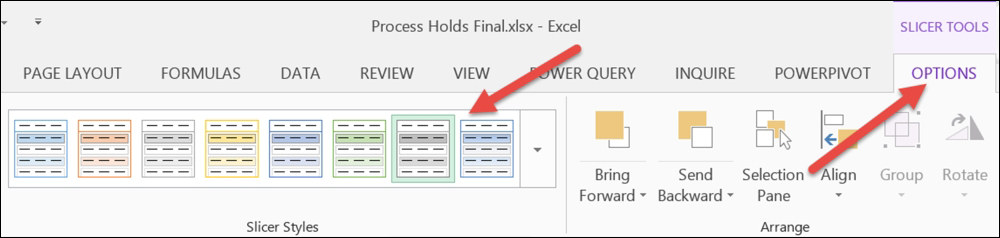
- Click on the slicers (one at a time) and a new menu option will appear: SLICER TOOLS with an OPTIONS tab. From this OPTIONS tab, select a matching color from the Slicer Styles area of the ribbon:
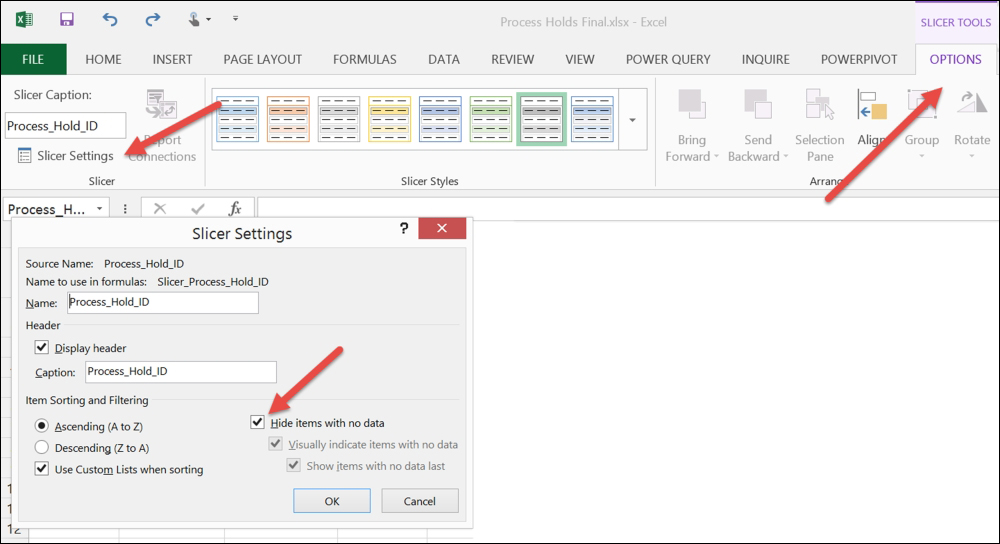
- Click on the slicers (one at a time), and click on Slicer Settings in the Slicer area of the ribbon. Click on the checkbox for Hide items with no data. Then, click on OK. This will then only display options in each slicer that has data:
- Our sample only has two potential process holds, so a small slicer box is fine. However, we can have more document types, so we want to make the box wider and have the buttons appear as columns. To do this, click on a slicer so that the SLICER TOOLS | OPTIONS tab appears. In the Buttons area of the ribbon, select the number of columns you want. In the Size area of the ribbon, select the width you want. You can also resize using the handles:

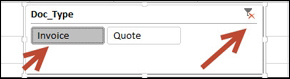
- The slicers will allow you to quickly and easily narrow down the data being displayed. If you want to only see invoices, just click on the Invoice button. If you want to see all document types, click on the Remove Filter button in the top-right corner. You can use either, or both slicers at the same time:
Finally, let's add some conditional formatting to highlight documents that require our immediate attention:
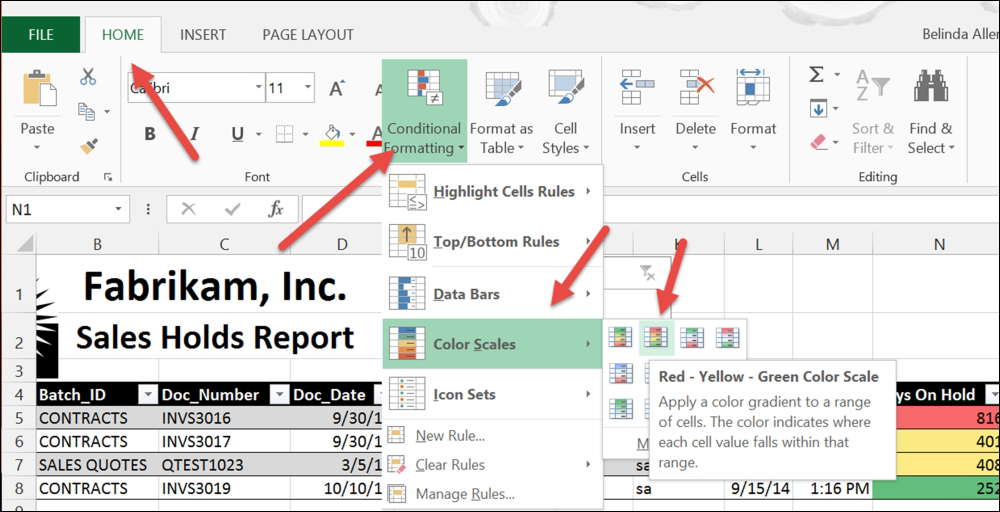
- Click on Home on the menu, and then highlight the entire column you want to format. Let's choose the Days on Hold column. For us, it's column N.
- Click on Conditional Formatting from the Styles area of the ribbon.
- On the drop-down list, select Color Scales and then choose a scale. We want documents that have been on hold the longest to appear as red and the documents that have been on hold the shortest to appear as green. Using this scale, everything in the middle will appear yellow. We then know we should look at everything that is red first:
- Follow these exact same steps for the Days until ship column. You now have a finished report:
By using this report, you can improve customer service by processing orders faster. An example of this would be if you had a hold for credit checks. If you are responsible for credit checks, you can look at this report each day or hour, and so on, and see every order waiting for a credit check. You can use a slicer and see every document with a credit check hold assigned. It's a great win-win situation if you can make your job easier AND improve customer satisfaction!