
Managing returned inventory items is critical for a variety of reasons. Was the item returned because it was damaged? Are many of the items we sell to our customers damaged? If returned items are not damaged, can they be resold? If they can be resold, are they being placed back into the inventory as available to sell? Is there a particular item or group of items that are being returned?
More and more companies are making it easier to return items, as a means to ensure customer satisfaction. It costs more to acquire and sell to a new customer than to sell to a returning customer, so keeping our customers happy is paramount to our success. So, let's review our returned items to see if we can learn anything.
This report can be used for any company using SOP. Although it focuses on items and includes where they are being returned in the inventory module, the focus is on the return itself. Even a company that uses SOP for services rendered can benefit from monitoring returns. In their case, a return will be a credit against services rendered. Since you cannot resell an hour from last week, monitoring these returns becomes just as important as returns for distribution companies.
The goal of this report is to help us obtain any information about our returns. Hopefully, we can learn and do something to prevent or dramatically reduce future returns and credits.
We will be using an Excel PivotTable for this report. Using Excel, we can give access to this report to inventory and sales managers; some, or both, of whom may be non-GP users.
There are two parts to these steps. The first part is technical, containing steps that involve work in SQL Server. The second part is the actual building of the report. You may choose to obtain assistance with the technical part, especially if you do not have access to SQL Server.
Create the following view in SQL Server:
CREATE VIEW view_BI_SOP_Returns AS

SELECT SL.SLPRSNID AS Salesperson,
 SL.SOPNUMBE AS Return_Number,
 SH.DOCDATE AS Return_Date,
 dbo.RM00101.CUSTCLAS AS Customer_Class,
 SH.CUSTNMBR AS Customer_ID,
 SH.CUSTNAME AS Customer_Name,
 IM.ITMCLSCD AS Item_ClassID,
 SL.ITEMNMBR AS Item_Number,
 SL.ITEMDESC AS Item_Description,
 SL.LOCNCODE AS Sited_ID,
 SL.QTYBSUOM * SL.QUANTITY AS Quantity,
 IU.BASEUOFM AS Base_UofM,
 SL.QTYONHND AS Returned_to_Inventory,
 SL.QTYRTRND AS Returned,
 SL.QTYDMGED AS Damaged,
 SL.QTYINUSE AS In_Use,
 SL.QTYINSVC AS In_Service
FROM dbo.SOP30300 AS SL
INNER JOIN dbo.SOP30200 AS SH ON SL.SOPTYPE = SH.SOPTYPE
AND SL.SOPNUMBE = SH.SOPNUMBE
INNER JOIN dbo.IV00101 AS IM ON SL.ITEMNMBR = IM.ITEMNMBR
INNER JOIN dbo.IV40201 AS IU ON IM.UOMSCHDL = IU.UOMSCHDL
INNER JOIN dbo.RM00101 ON SH.CUSTNMBR = dbo.RM00101.CUSTNMBR
WHERE (SL.SOPTYPE = 4)
 AND (SH.VOIDSTTS = 0)

GO
GRANT SELECT ON view_BI_SOP_Returns TO DYNGRP
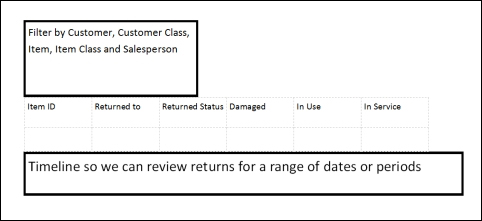
Know what you want. This time we just drew out what we wanted, rather than performing a mock-up with data. While doing so, we realized we wanted the ability to filter on more items than we originally thought.
If we had performed this step after working on the SQL view, we would have had to rework the view, costing us time. KNOW THY REQUIREMENTS:
Let's make a connection to the GP data:
- Open a blank Microsoft Excel workbook. Click on DATA from the menu, and in the Get External Data area of the ribbon, select From Other Data Sources. On the drop-down list, select From SQL Server.
- In the Data Connection Wizard window, enter your Server name and log in using Microsoft Dynamics GP username and password. Then, click on Next.
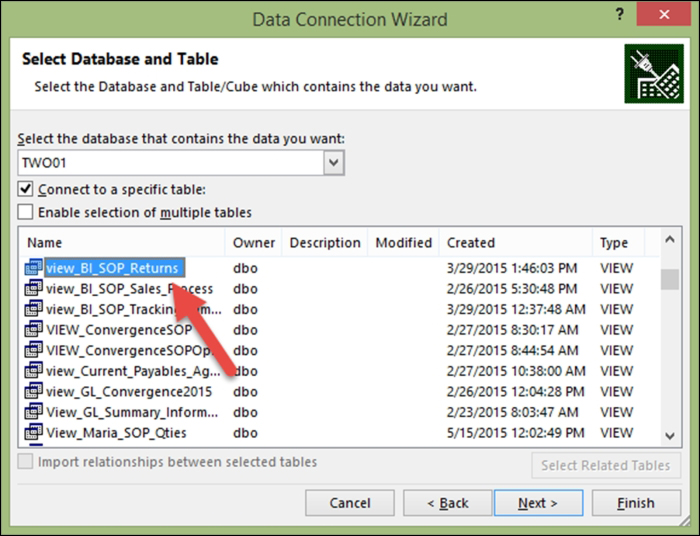
- Select your database, then scroll down and select the view_BI_SOP_Returns view. Then, click on Finish:
- On the Import Data window, make sure the Table default is selected and that the Where do you want to put the data? option is set to Existing Worksheet in the =$A$1 cell. Then, click on OK:

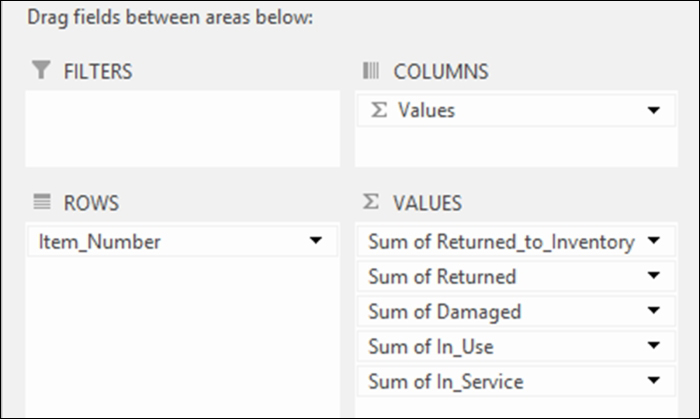
- The PivotTable canvas will appear. In the PivotTable Fields list, drag Item_Number to ROWS.
- In the PivotTable Fields list, drag Returned_to_Inventory, Returned, Damaged, In_Use, and In_Service to VALUES:
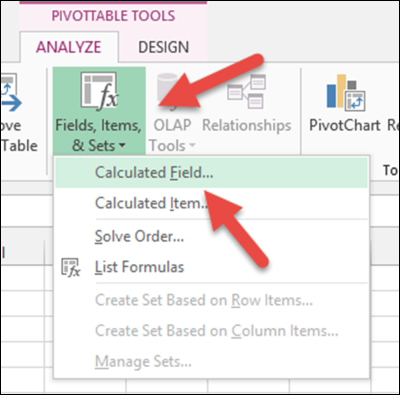
- Click on the ANALYZE tab in the PIVOTTABLE TOOLS portion of the Excel menu. If it is not showing, just click anywhere in the PivotTable.
- Click on Fields, Items & Sets, which is located on the Calculations area of the Excel ribbon.
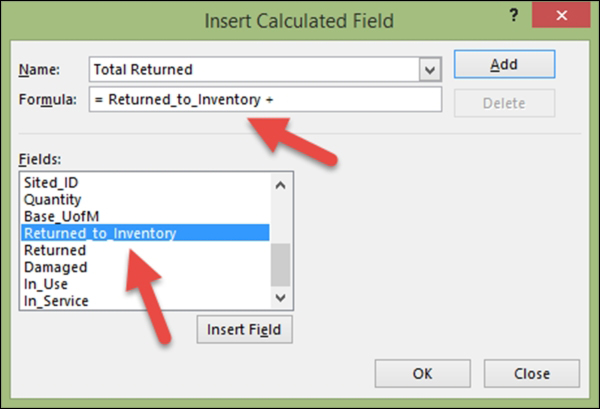
- Click on Calculated_Field. The Insert Calculated Field window will open:
- In the Name field, enter Total Returned.
- In the Formula field, remove the 0, but leave the =.
- In the Fields list, select Returned_to_Inventory to highlight, and then click on Insert Field.
- Click behind Returned_to_Inventory in the Formula field, and enter a plus sign (+):
- In the Fields list, select Returned to highlight, and then click on Insert Field.
- Click behind Returned in the Formula field, and enter a plus sign (+).
- In the Fields list, select Damaged to highlight, and then click on Insert Field.
- Click behind Damaged in the Formula field, and enter a plus sign (+).
- In the Fields list, select In_Use to highlight, and then click on Insert Field.
- Click behind In_Use in the Formula field, and enter a plus sign (+).
- In the Fields list, select In_Service to highlight, and then click on Insert Field.
- Click on OK:
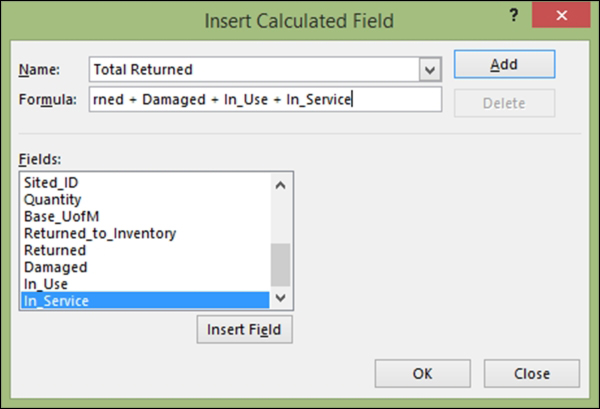
This calculation added an additional field to the PivotTable. It added the total amount returned for each item.
- Click on the ANALYZE tab in the PIVOTTABLE TOOLS portion of the Excel menu. If it is not showing, just click anywhere in the PivotTable.
- Click on Insert Timeline, which is located on the Filter area of the Excel ribbon.
- When the Insert Timeline window opens, there should only be one option, Returned_Date. Select it and click on OK.
- Click on the ANALYZE tab in the PIVOTTABLE TOOLS portion of the Excel menu. If it is not showing, just click anywhere in the PivotTable.
- Click on Insert Slicer, which is located on the Filter area of the Excel ribbon.
- When the Insert Slicers window opens, select Customer_Name, Customer_Class, Item_ClassID, and Salesperson. Then, click on OK.
- Highlight each slicer (one slicer at a time) and the Excel ribbon will change to SLICER TOOLS | OPTIONS. Then, select Slicer Settings.
- In the Slicer Settings window, mark Hide items with no data. This will keep the slicers smaller when actively using this report:

- Use the design features of the PivotTable and slicers to format color, and add a logo or report name.
- Our final report looks like the following:
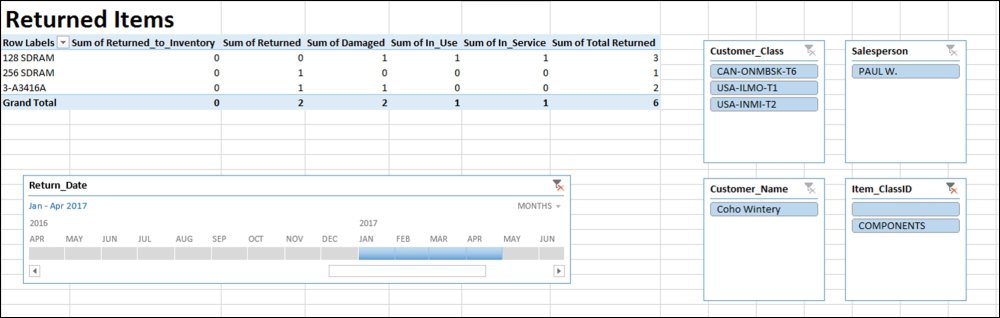
This report allows for in-depth evaluation of the return (credit): who is returning the goods, why were they returned, where are they in inventory now, and who is the salesperson on the return. This company can add different slicers than the ones we have chosen to see even more information. Also, the timeline can be edited to display returns in days, months, quarters, or years. Charts can be added for more visualization to spot trends.