Debugging and logging are the tools that a developer can use to identify the root cause of bugs or unexpected behavior of applications.
The aim of debugging is to find a defect or pain point in our code, which is responsible for a problem. Logging gives us information about an application's state and the various stages of processing it. In this chapter, we will cover the following topics:
- Debugging a Play application
- Configuring logging
- Experimenting in a Scala console
Play applications can be debugged using a Java Platform Debugger Architecture (JPDA) transport. According to the Oracle documentation (refer to http://docs.oracle.com/javase/7/docs/technotes/guides/jpda/conninv.html):
A JPDA Transport is a method of communication between a debugger and the virtual machine that is being debugged (hereafter the target VM). The communication is connection oriented - one side acts as a server, listening for a connection. The other side acts as a client and connects to the server. JPDA allows either the debugger application or the target VM to act as the server.
We can start a console in debug mode with any one of the following commands:
- By using
play:play debug - By using
activator:activator -jvm-debug <port> - By using
sbt:sbt -jvm-debug <port>
All these commands are just wrappers used to start the target VM in debug mode through the invocation options:
-Xdebug -Xrunjdwp:transport=dt_socket,server=y,suspend=n,address=<port>
Once we start the console in debug mode, we can connect our IDE and debug the application when it's running. If you are familiar with how this can be done, you can skip this section.
The process of configuring the IDE will be similar to the one used in all the IDEs. Let's see how it's done in IntelliJ Idea through the following steps:
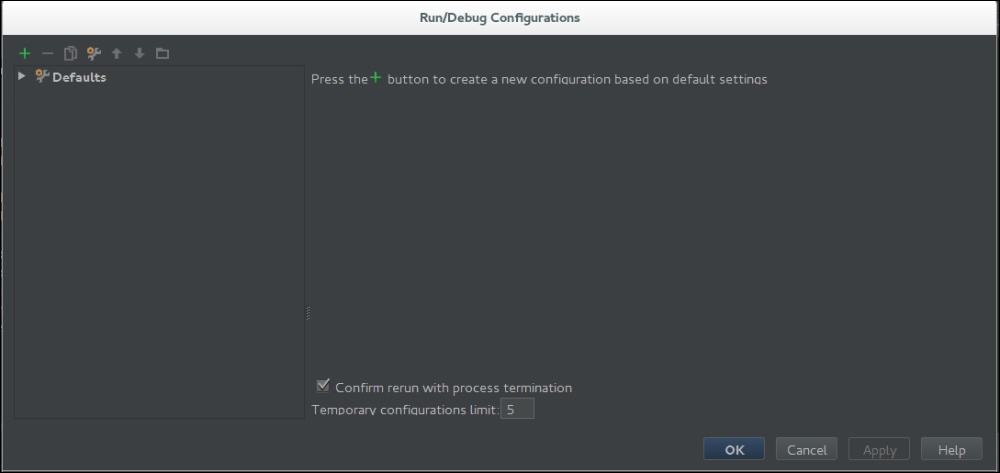
- Select Edit Configurations… from the the Run menu. A dialog will pop up. It will be similar to the following screenshot:
- Click on + and a menu similar to this screenshot will be visible:
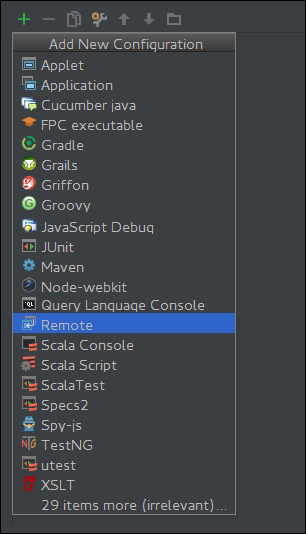
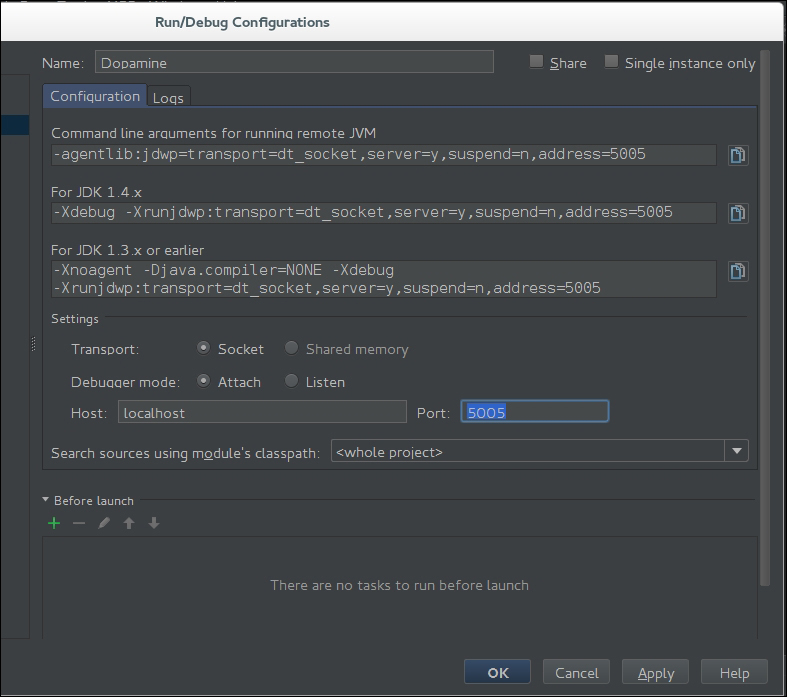
- Select Remote and update the Name and Port fields:
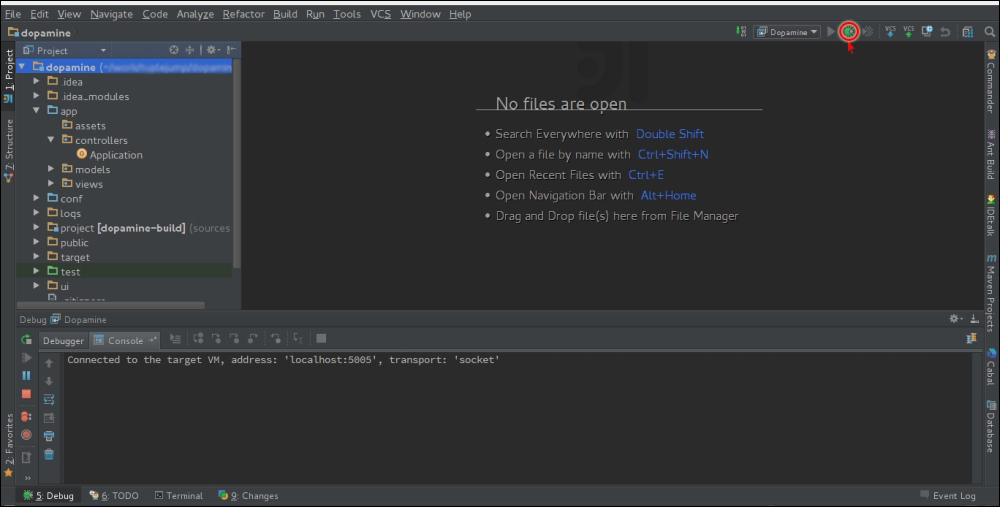
- After this, click on the green bug, which is now visible at the top-right corner of the IDE, and we are ready to start debugging the application: